≡ Menu

Data Snooping

Reggie Wayne dominates when seeing blue

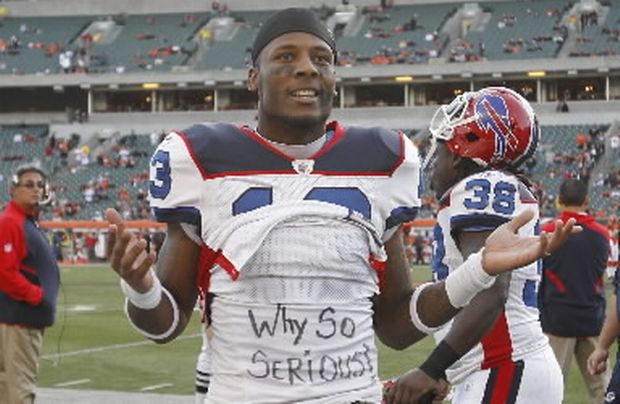
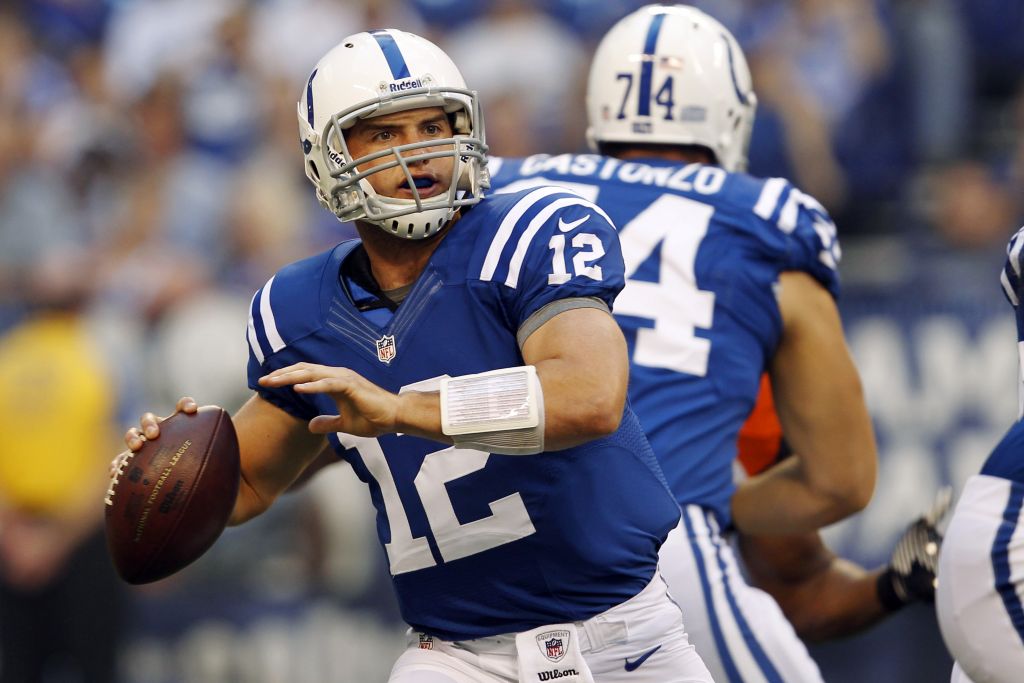
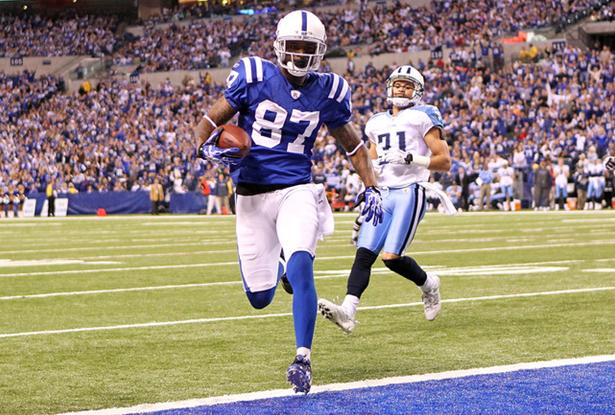
Reggie Wayne dominates when seeing blue.

Over the last few years, the football analytics movement has made tremendous progress.  There are many really smart people with access to a large amount of useful information who have helped pioneer the use of statistics and analytics in football.  Major news organizations and NFL teams seem to be embracing this movement, too.  Unfortunately, there are some less-than-desirable side effects as the reward for presenting “statistical information” seems larger than ever.

Data snooping is the catch-all term used to describe a misuse of data mining techniques.   There are perfectly legitimate uses to data-mining, but data snooping is a big ‘no-no’ for the legitimate statistician.  If the researcher does not formulate a hypothesis before looking at the data, but instead uses the data to suggest what the hypothesis should be, then he or she is data snooping.

I’m guilty of data snooping, but (hopefully) only in a tongue-in-cheek fashion.   When I said Reggie Wayne was much better against blue teams than other opponents, that was data snooping.  We’ve all been taught that history repeats itself; that translates to “if the evidence indicates a strong relationship in the past, then it is likely to continue in the future” when it comes to statistical analysis.  For example, history tells us that first round picks will perform better, on average, then sixth round picks.  That’s both what the data suggest and an accurate statement.

But what happens when the data suggest that being born on February 14th or February 15th means a player is more likely to be a great quarterback?  After all, the numbers tell us that 14% of all the NFL’s 31,000-yard passers were born on one of those two days, which only account for 0.6% of the days of the year.  Just because history tells us that those dates are highly correlated with success — and the p-value would surely be very impressive — doesn’t mean that there is any predictive value in that piece of information.
[continue reading…]

{ 23 comments }

Sid Luckman did it twice. Two Packers quarterbacks, Arnie Herber and Irv Comp, did it with help from Don Hutson. Sammy Baugh did it as a rookie in 1937.

In five out of eleven seasons from 1936 to 1946, the league leader in passing yards also won the NFL championship. Otto Graham led the AAFC in passing yards in ’47, ’48, and ’49, and the Browns won the championship each of their four seasons in the AAFC. But since then, only two quarterbacks have led the league in passing yards in the same season as winning a title. Can you name them?

Click Show for Answer Show

Want to take a look at the list of all 95 players to lead their league in passing and their team’s final results? Click the “Show” button below:

All Passing Leaders Show

Of course, you already knew that passing yards wasn’t strongly correlated with winning. But what about being the league’s most valuable player? This year, the Miami Heat won the NBA title and LeBron James was the MVP (for the second straight year). But in the NFL, it’s much rarer for a player to pull off that feat: Adrian Peterson won MVP, but the Minnesota Vikings weren’t very close to winning the Super Bowl. Can you name the last player to win the MVP and the Super Bowl in the same year?

Click Show for Answer Show


One more bit of trivia. To really be like LeBron, an NFL player would need to win the MVP, the Super Bowl, and the Super Bowl MVP. That’s happened six times in NFL history, but only once by a non-quarterback. Can you name him?

Click Show for Answer Show

{ 3 comments }

Smith has excelled despite playing for a ground-based attack

Smith has excelled despite playing for a ground-based attack.

We don’t rank quarterbacks by passing yards because “passing yards” is largely a function of pass attempts. The same is true for receiving yards, as the number of times a team passes the ball has a big impact on a receiver’s yardage total. I’ve spent some time this year looking at ways to rank wide receivers and am throwing another log on that fire today. One idea I like in theory is receiving yards per team pass attempt, as it helps to solve the problem of dealing with receivers who play on pass-heavy teams.

But there are some obvious drawbacks to that approach. There are more passing options on the field now than ever before, so it’s tough to use receiving yards per team pass attempt across eras. For example, Jim Benton in 1945 owns the record in this metric at 5.36 yards per team attempt in 1945; even if you consider that high number a byproduct of World War II, Harlon Hill averaged 4.5 yards per team pass in 1956 for the Bears. Carolina’s Steve Smith is the single-season leader in yards per team attempt since 1970. And he also holds down the #2 on that list. Smith averaged 3.48 yards per team pass attempt in 2005; three years later, he averaged 3.43 Yd/TPA (but in the 14 games he played, Smith averaged an absurd 4.04 Yd/TPA).

A few weeks ago, I ranked receivers by their percentage of team receiving yards in their best six seasons. I thought it would be fun to do the same thing with yards per team pass attempt (excluding sacks). The results are listed below for the top 200 receivers; I’ve also included the six years selected for each receiver to come up with their average. As always, you can use the search box to find your favorite receiver, and the table is sortable, too. [1]Note that I am only giving a receiver credit for his receiving yards with each team in each season, so for say, Wes Chandler, his 1981 season is undervalued.
[continue reading…]

References

References
1 Note that I am only giving a receiver credit for his receiving yards with each team in each season, so for say, Wes Chandler, his 1981 season is undervalued.
{ 18 comments }

On September 13, 2008, Doug Drinen wrote this post, which I reproduce in full below.

I’m hearing and reading a lot of crazy stuff this week.

So I just want to document my predictions that (a) the Patriots will win at least 11 games this year, (b) the Patriots will clinch the East before week 17, and (c) Matt Cassel will be a top-12 fantasy quarterback from here out.

That is all.

You think I'm going to lose my top 5 receivers next year? Hahaha. Ok

You think I'm going to lose my top 5 receivers next year? Hahaha. Ok.

With the combination arrest/release of Aaron Hernandez stacked upon five surgeries in seven months for Rob Gronkowski and the departure of Wes Welker to Denver, it’s fair to say that many are wondering about the fate of the New England passing game. In addition to those three, Tom Brady is without Brandon Lloyd (free agent) and Danny Woodhead (San Diego), the fourth and fifth leading receivers on the 2012 Patriots. As Jason Lisk pointed out, that puts Brady in historically bad territory when it comes to roster turnover.

So today’s post doubles as a temperature check and a contest entry. Please predict the following for Tom Brady in 2013, based on the assumption that he is responsible for 99.4% of all Patriots pass attempts by quarterbacks for the second year in a row. To the extent he is not, I will pro-rate his numbers for purposes of judging the contest. To enter, simply copy and paste this table below in the comments and fill out each line.

Your name:
Brady’s number of pass attempts:
Brady’s number of passing yards:
Brady’s number of passing touchdowns:
Brady’s number of interceptions:
Brady’s number of sacks:
Brady’s number of sack yards lost:
Commentary:
[continue reading…]

{ 28 comments }

Vernon Davis as Art Monk

After the voters did not select Shannon Sharpe as part of the 2009 Hall of Fame Class, I wrote this post comparing Sharpe to Art Monk. While many viewed Sharpe as a receiver playing tight end, I noted that the Redskins used Monk not just as a wide receiver, but as an H-Back and as a tight end. My friend and football historian Sean Lahman once wrote this about Monk:

Even though Monk lined up as a wide receiver, his role was really more like that of a tight end. He used his physicality to catch passes. He went inside and over the middle most of the time. He was asked to block a lot. All of those things make him a different creature than the typical speed receiver…. His 940 career catches put him in the middle of a logjam of receivers, but he’d stand out among tight ends. His yards per catch look a lot better in that context as well.

I haven’t heard anyone else suggesting that we consider Monk as a hybrid tight end, but coach Joe Gibbs hinted at it in an interview with Washington sportswriter Gary Fitzgerald:

“What has hurt Art — and I believe should actually boost his credentials — is that we asked him to block a lot,” Gibbs said. “He was the inside portion of pass protection and we put him in instead of a big tight end or running back. He was a very tough, physical, big guy.”

With Michael Crabtree likely to miss most if not all of the 2013 season due to a torn Achilles, the 49ers may consider moving Vernon Davis from tight end to wide receiver. The most likely explanations for Davis playing exclusively at wide receiver in mini-camp are (a) he doesn’t need more practice at tight end while his route-running could probably use some refining, (b) the 49ers have several young tight ends who could benefit from more reps in mini-camp, and (c) the wide receiver group is currently depleted, and it’s June, so why not try something outside the box?
[continue reading…]

{ 3 comments }

Man at Work.

Man at Work.

Did you know that Aaron Rodgers is the longest-tenured Packer? Today I want to take a look at the current player who has been with each team the longest. Now that Ronde Barber, Ray Lewis, and Jason Hanson have retired, the longest-tenured player in the NFL is…Patrick Mannelly? Don’t feel bad if you have never heard of the Chicago long snapper: I hadn’t, either. How’s this for a crazy fact: as a rookie, Mannelly snapped to punter Mike Horan, who was a Falcons draft pick in 1982. Think you can guess the most senior veteran in the other 31 locker rooms? Good luck.

AFC East

Buffalo Bills – Punter Brian Moorman and defensive end Chris Kelsay are gone, so placekicker Rian Lindell — who is entering his 11th year of the service with the team — is now the longest-tenured Bill. Defensive back Terrence McGee had also been with the team since 2003, but he was released in the offseason. George Wilson is now in Tennessee, which means Kyle Williams (2006) is the most senior non-kicker.

Miami Dolphins – Long snapper John Denney (since 2005) is the longest-tenured Dolphin. After him, it’s punter Brandon Fields and defensive tackle Paul Soliai, both of whom joined Miami in 2007.

New England Patriots – no surprise here: Tom Brady has been around since 2000; the runner up is Vince Wilfork, who came aboard in 2004.

New York Jets – Bryan Thomas, Brandon Moore, and Sione Pouha were casualties of John Idzik’s offseason house cleaning. That leaves two 2006 first round picks — D’Brickashaw Ferguson and Nick Mangold — as the longest tenured players.
[continue reading…]

{ 6 comments }

Steve Johnson doesn't care about the NFL schedule

Steve Johnson doesn't care about the NFL schedule.

Chris Brown of buffalobills.com is not happy with the way the Bills’ schedule shakes out. Again. Last year, this is what Brown wrote after examining the 2012 schedule:

After playing what is expected to be a physical contest with the 49ers in San Francisco in Week 5 [Chase: In retrospect, not that physical], the Bills then face the Cardinals in Arizona in Week 6. The Cards will have the benefit of three extra days of prep time for Buffalo as their Week 5 game is on Thursday night.

The very next week when the Bills play host to Tennessee, the Titans will also have three extra days of prep time for Buffalo because they’re playing on Thursday night the previous week (Week 6) as well.

The Bills look to get a break as they’ll have a bye week in Week 8 to get two weeks to prep for the Texans in Houston. But that extra prep time will be a wash because Houston also has their bye in Week 8.

Finally while the Bills are battling the Texans in Houston, the Patriots will be on their couches watching at home while their head coach grinds tape for two weeks to prepare for the Bills who travel to New England in Week 10 as the Pats have their bye in Week 9.

Brown’s claims were accurate: Buffalo did face a team coming off extra rest (i.e., more than eight days) four times in five weeks. Of course, those were the only times all season the Bills played a team coming off extra rest. Still, if we look at the 2012 season, it’s fair to say the Bills got the short end of the scheduling stick.

But they don’t have the biggest beef. Philadelphia faced four teams coming off bye weeks last year, tying the ’09 Falcons, ’05 Chargers, ’03 Cowboys, and ’99 Chargers for facing the most teams coming off a bye week since 1994.
[continue reading…]

{ 3 comments }

Contest Results

contestLast week Chase announced this contest in honor of Football Perspective’s first birthday. Here’s the backstory…

A couple of years ago, I moved. The house I was moving into, like many houses, had walls. The walls did not have artwork pre-installed, so I spent a good six months of my life obsessed with finding good wall-art. Somewhere in there, I stumbled on the open-source visualization program called Gephi. It looked super-cool, so I decided to play around with it.

The bug/bean/Australia/peanut/hairball Chase posted last week is the result. In addition to framing one for my own wall, I framed one each for Chase and Lisk, and I mailed them off. I don’t use the word “hero” very often, but really, what other word is there for someone who is talented enough to create world-class art and generous enough to send it to his friends? This was a good thing I had done. So what’s a hero to do when he is told, tactfully of course, by both Chase and Lisk, that his art kinda sucks? I thought the bean’s worth was self-evident.

The mechanics are straightforward. I don’t even remember the specifics but, as you all figured out, this is a roster of the best players in modern-ish NFL/AFL history. The size of a player’s dot represents his quality, as measured by career AV or 100-95-90-… AV — I can’t remember which. The strength of a connection between two players is the number of games they played with and against each other. So Peyton Manning is strongly connected to Marvin Harrison, less connected to Tom Brady, still less connected to Brian Urlacher, and not at all connected to Dan Fouts or Bill George. The layout was determined by Gephi’s “force atlas” algorithm. My understanding is that it pretends the connections are elastic bands — the stronger the connection the tauter the band — and then lets the physics take over. Manning and Harrison naturally end up close together because they are connected by a tight band. Urlacher sort of wants to be close to Manning, but there are tighter bands pulling him in other directions so he doesn’t get too close. He does get closer than Dan Fouts does, though.
[continue reading…]

{ 8 comments }

Rookie Passing, Rushing, and Receiving

In the graph below, the blue line shows the number of passing yards by rookies in each year since 1970, while the red line shows the number of passing yards by non-rookies in the same season. Both are measured against the left Y-Axis; the green line shows the percentage of rookie passing yards to veteran passing yards. As you can see, Andrew Luck, Robert Griffin III, Russell Wilson, Ryan Tannehill, and Brandon Weeden were part of an extremely productive rookie class:

rk vet pass yds [continue reading…]

{ 3 comments }

Matt Stafford won the 2012 ESPY for most double chins in a leading role

Matt Stafford won the 2012 ESPY for most double chins in a leading role.

Last year’s article on the Lions was somewhat negative. Detroit went 4-12 in 2012, but the Lions are going to win more games this year. This is the type of article that Jason Lisk, Bill Barnwell, Brian Burke, or Aaron Schatz could write in their sleep. But I’m writing it while watching TV, writing a more complicated article, working out, taking out the trash, and tweeting. Let’s see Lisk do that!

The Lions went 3-9 in games decided by 8 or fewer points last year, giving them the most losses and the worst winning percentage of all teams in one-possession games. While this might imply that the Lions lack the mental fortitude to win close games, you might recall that in 2011, the Minnesota Vikings (2-9) and the Indianapolis Colts (1-7) were the worst two teams in such situations and then made the playoffs last year.

Another way to convey similar information is to look at each team’s Pythagorean record, which is calculated based on a team’s points scored and points allowed and is a better predictor of future winning percentage than past winning percentage. The table below shows each team’s number of wins, points scored and allowed, and number of Pythagorean wins for 2012, using 2.57 as my exponent(which produced the best fit for recent years). The table is sorted by the difference between actual wins and Pythagorean wins:
[continue reading…]

{ 20 comments }

In 2008, Larry Fitzgerald had a fantastic regular season capped off by a historically great postseason; in the Super Bowl, he set the record for receiving yards in a season, including playoff games, with 1,977 yards. Of course, 2008 was decades ago in today’s era of what have you done for me lately. The table below shows Fitzgerald’s stats over the past four seasons. The final two columns show the total number of receiving yards generated by all Cardinals players and Fitzgerald’s share of that number.

YearRecYdsYPRTDARI Rec YdsPerc
200997109211.313420026%
201090113712.66326434.8%
201180141117.68395435.7%
20127179811.24338323.6%

2009 was the last season of the Kurt Warner/Anquan Boldin Cardinals. The 97 receptions and 13 touchdowns look great, although hitting those marks and not gaining 1,100 receiving yards is very unusual. Fitzgerald was only responsible for 26% of the Cardinals receiving yards that season, although one could give him a pass since he was competing with another star receiver for targets.

Can Fitzgerald rebound in 2013?

Can Fitzgerald rebound in 2013?

In 2010, Derek Anderson, John Skelton, Max Hall, and Richard Bartel were the Cardinals quarterbacks: as a group, they averaged 5.8 yards per attempt on 561 passes. Arizona’s passing attack was bad, but without Boldin, Fitzgerald gained 34.8% of the team’s receiving yards. Steve Breaston chipped in with 718 receiving yards yards while a 22-year-old Andre Roberts was third with 307 yards. In other words, Fitzgerald performed pretty much how you would expect a superstar receiver to perform on a team with a bad quarterback and a mediocre supporting cast: his raw numbers were still very good (but not great) because he ate such a huge chunk of the pie. After the 2010 season, I even wondered if he could break any of Jerry Rice’s records (spoiler: he can’t).

In 2011, Skelton, Kevin Kolb and Bartel combined for 3,954 yards on 550 passes, a 7.2 yards per attempt average (Kolb was at 7.7 Y/A). That qualifies as a pretty respectable passing game and Fitzgerald appeared to have a monster year, gaining 35.7% of the Cardinals’ receiving yards (Early Doucet was second with 689 yards and Roberts was third with 586 yards). It’s always hard splicing out cause and effect, but my takeaway is that with a more competent passing game, Fitzgerald continued to get the lion’s share of the team’s production but unlike in 2010, this led to great and not just good numbers.
[continue reading…]

{ 12 comments }

Yesterday, Joe Fortenbaugh canonized Mike Lombardi for discovering and emphasizing one of the game’s great hidden stats: the number of rushing attempts plus completions a team has in a game. If you hit 50, you’re in great shape. Fortenbaugh reminds us that Lombardi, whose last team went 2-14, “possesses a vast range of knowledge spanning from management to game theory.” Fortenbaugh does the math for us, noting that the “top-10 teams in rushing attempts + completions combined to post a record of 101-59 (.631) in 2012, with seven of those ten organizations advancing to the postseason. On the opposite end of the spectrum, the bottom-10 teams combined for a 62-97-1 (.387) mark, with zero total playoff berths.” Then, he blows us away with the prize-winning line:

If you take only the teams that averaged 50.0 or more rushing attempts + completions per game over the last five years, you get a combined regular season record of 339-189 (.642), with 22 of 33 (66%) teams qualifying for the postseason. That winning percentage puts a team in between 10 and 11 wins per season.

The headline to the article reads: Average a combined total of 50 rushing attempts and completions per game and a winning season will likely follow. I’ll do the article one better: From 2008 to 2012, including playoffs, teams with 50+ rushes + completions have a record of 819-325-3, giving them a .715 winning percentage.

After reading that article and getting an inside look into Lombardi’s wisdom, I had considered the code to producing a winning season cracked. But I’ve got a robust database, so I thought maybe I could do even better than that .715 winning percentage Lombardi’s stat produces. The following information is based on the results from every game, regular and postseason, since 2008:
[continue reading…]

{ 31 comments }

Yards per Attempt is the basic statistic around which the passing game should be measured. It forms the base of my favorite predictive statistic (Net Yards per Attempt) and my favorite explanatory statistic (Adjusted Net Yards per Attempt). But it’s not perfect.

In theory, Yards per Attempt is a system-neutral metric. If you play in a conservative, horizontal offense, you can have a very high completion percentage, like David Carr in 2006. But if you’re not any good (like Carr in 2006), you’ll produce a low yards-per-completion average, dragging down your Y/A average. You can’t really “game” the system to get a high yards per attempt average; the way to finish among the league leaders in Y/A is simply by being very good.

Courtesy of NFLGSIS, I have information on the length of each pass (or Air Yards) thrown during the 2012 regular season. I then calculated, for each distance in the air, the average completion percentage and average yards per completion. In the graph below, the X-Axis shows how far form the line of scrimmage the pass went (or, as Mike Clay calls it, the depth of target). The blue line shows the average completion percentage (off the left Y-Axis) based on the distance of the throw, while the red line shows the average yards per completion (off the right Y-Axis). For example, passes four yards past the LOS are completed 69% of the time and gain 5.4 yards per completion, while 14-yard passes are at 50% and 17.6.

Cmp vs. YPC2

We can also follow up on yesterday’s post by looking at Air Yards vs. YAC for each distance or depth of throw. Air Yards is in red and on the right Y-Axis, while average yards after the catch is in blue and measured against the left Y-Axis. Initially, there is a pretty strong inverse relationship, just like with completion percentage and yards per completion. On a completion that is one yard past the line of scrimmage, the average YAC is 5.5; on a completion 10 yards downfield, the average YAC drops to 3.0. This is why players like Percy Harvin and Randall Cobb will rack up huge YAC numbers. But once you get past 13 or 14 yards, YAC starts to rise again. This makes sense, as that far down the field, a player is just one broken tackle away from a huge gain (I suspect using median YAC might paint a different picture).
[continue reading…]

{ 16 comments }

Luck winds up to throw deep

Luck winds up to throw deep.

Consider the following example. The Colts gain possession at the 20-yard line. Andrew Luck is in shotgun and throws a strike to Reggie Wayne, who catches it at the 30, runs 15 yards, and gets tackled at the 45-yard line. Luck gets credited with 25 passing yards and Wayne records 25 receiving yards. Wayne is also credited with 15 yards after the catch, a statistic that you’ll occasionally see discussed or cited.

But you rarely see Luck’s completion split into (a) 10 yards through the air, and (b) 15 yards after the catch by his receiver. Brian Burke calls those 10 yards “Air Yards” and I think that is a pretty useful moniker. The question is, what do you do with Air Yards? Luck led the NFL in Air Yards per completed pass last year (8.0), but that doesn’t make the statistic an indicator of quality. Tim Tebow’s 2011 performance produced the highest single-season Air Yards per completion average since 2006 (8.9), while Jake Delhomme (2008) and Derek Anderson (2010) each have led the league in that metric, too. Air Yards per completed pass is a very useful way to describe a player’s style, but you can’t use it alone to determine a player’s quality.

One question I have: Are Air Yards more repeatable for a quarterback than the yards he gains via his receivers’ YAC? It’s important to keep that question separate from this one: Is a quarterback who has a high number of air yards and a low YAC better than a quarterback in the opposite situation? Today, I plan to focus on the first question, but let’s take a second to address the second one.

According to ESPN’s research, yards after the catch is more about what the receiver does than the quarterback. As a result, a completion that is in the air for 40 yards is better for a quarterback’s ESPN QBR than a pass that is in the air for 5 yards on which the receiver runs for 35 yards after the catch. That makes sense, I suppose, and I suspect that’s probably true more often than not. The easiest counterargument is to point to Joe Montana, and say that what made Montana great was his pinpoint accuracy that enabled players like Jerry Rice to rack up big YAC numbers.I’m going to put off any further analysis of how much of YAC should be attributed to the quarterback and how much to the receiver, because it’s pretty complicated. One thing that is a bit easier to analyze is how “sticky” Air Yards are from year to year.
[continue reading…]

{ 25 comments }

Over at Footballguys.com, I look at a different method to project receiving yards.

The number of receiving yards a player produces is the result of a large number of variables. Some of them, like the receiver’s ability, are pretty consistent from year to year. But other factors are less reliable, or less “sticky” from year to year. I thought it would be informative to look at three key variables that impact the number of yards a wide receiver gains and measure how “sticky” they are from year to year. These three variables are:

  • The number of pass attempts by his team;
  • The percentage of his team’s passes that go to him; and
  • The receiver’s average gain on passes that go to him.

We can redefine receiving yards to equal the following equation:

Receiving yards = Receiving Yards/Target x Targets/Team_Pass_Att x Team_Pass_Att.

You’ll notice that Targets and Team Pass Attempts are in both the numerator and denominator of one of the fractions, and they will cancel each other out: that’s why this formula is equivalent to receiving yards.

By breaking out receiving yards into these three variables, we can then examine the stickiness of each one, which should help our Year N+1 projections. Below are the best-fit equations for each of those variables in Year N+1:

Future Pass Attempts = 36 + (450 x Pass_Attempts/Play) + (0.255 x Offensive Plays)

Future Percentage of Targets = 6.2% + 71.3% x Past Percentage of Targets

Future Yards/Target = 5.5 + 0.29 x Past Yards/Targets

I then used those three equations to come up with a starting point for receiving yards projections for 28 wide receivers. You can read the full article here.

{ 0 comments }

On June 15, 2012, I launched Football Perspective. Since that day, Football Perspective has posted a new article every single day. This the site’s 445th post, so I won’t blame you if you’ve missed an article here or there. At the top of every page is a link to the Historical Archive, a page that is updated after each post is published. To get in on the celebration, you can enter the Football Perspective Birthday Contest.

A couple of weeks ago, I thanked many of my friends and colleagues who helped mold me into the writer and person I am today. All of those people are responsible for this site getting to see its first birthday, so I thank them again right now. I also want to give an added thank you to Neil, who occasionally adds another voice to this site and is a wonderful sounding board. And I want to thank you, the reader: without you, there wouldn’t be a site. It means a lot to me that you’ve chosen to come here and stop by every day, once or week, or whenever you like.

I checked the stats, and the five most viewed posts in Football Perspective history were:

If you’ve been to this site, there’s a good chance you’ve read at least one of those posts. But to the newer readers, I thought I’d take a quick a stroll through the Historical Archive and point out some of my more memorable (at least, for me) articles.

If you had a favorite post or two from this year, let me know in the comments. One of my goals for Year Two is to get comments section to become a little more active.

{ 22 comments }

Football Perspective Contest

Football Perspective turns one tomorrow. To celebrate, Doug Drinen has come up with a contest centered around the following picture.

contest
Question 1: Explain what this is a picture of.

Question 2: Make a case to your real or hypothetical significant other that this is worthy of being printed, framed, and hung on your wall.
[continue reading…]

{ 20 comments }

Top Ten Players Named Mike Williams in NFL History

Somebody forgot to cover Mike Williams

Somebody forgot to cover Mike Williams.

#10: Tie: Mike Williams – linebacker, 1986 (Pittsburgh); Michael Williams – tight end, 2013-current (Detroit)

Nine Mike Williamses have played in the NFL. A Tulsa linebacker of the same name was drafted by the Steelers in the 12th round of the 1986 Draft but never appeared in a game. In April, the Lions selected Alabama tight end Michael Williams. Assuming the former Crimson Tide Williams plays in an NFL game, he will move into sole possession of the #10 slot.

#9: Michael Williams – safety, 1995 (San Francisco 49ers)

An undrafted free agent out of UCLA, Williams played in only four games for the 49ers. Despite the limited playing time, he still recorded 31 solo tackles and forced two fumbles.

#8) Mike Williams – tight end, 1982-1984 (Washington)

A fifth round pick out of Alabama A&M, Williams was part of the Redskins teams that made back-to-back trips to the Super Bowl in ’82 and ’83. Joe Gibbs was famous for using multiple tight ends, which kept Williams on the roster even though he was strictly a blocker and fourth on the depth chart. During Williams’ three-year career, Washington tight ends Don Warren (65-727-2), Clint Didier (41-513-10), and Rick Walker (34-312-4) put up respectable numbers, while Williams recorded just three catches (all in 1982).
[continue reading…]

{ 5 comments }

The Dungy Index: Version 2.0

Each coach is given bonus points for mustaches.

Each coach is given bonus points for mustaches.

Back in 2006, Doug Drinen came up with the Dungy Index, a way to measure a coach’s performance in the regular season relative to expectations. Because Doug understands regression to the mean, he was impressed by Tony Dungy’s ability to continue to string together 12-win seasons year after year. [1]Admittedly, this looks less impressive when you consider that Jim Mora, Jim Caldwell, and John Fox have won 13+ games with Peyton Manning, too. But Doug didn’t want to just use winning percentage to rate coaches: expectations are lower when a coach inherits a bad team, and that needs to be taken into account.

Defining “expectations” is challenging. I don’t have a perfect way, but I do have a simple one: use a linear regression based off of last year’s Pythagorean winning percentage to predict the number of games a team should be expected to win this year. [2]All ties are counted as half-wins. I did just that, and the best-fit formula was:

Year N+1 Wins = 4.23 + 0.472 * Year N Wins

So a 3-win team should be expected to win 5.6 games in Year N+1, a 10-win team is projected at 9.0 wins, and a 13-win team drops down to 10.4 expected wins. If you subtract the number of expected wins from the number of actual wins by the coach in a season, you are left with his number of wins over expectation. You’ll see pretty quickly why this is called the Dungy Index: he fares very, very well in it.
[continue reading…]

References

References
1 Admittedly, this looks less impressive when you consider that Jim Mora, Jim Caldwell, and John Fox have won 13+ games with Peyton Manning, too.
2 All ties are counted as half-wins.
{ 15 comments }

Brodie (left) and Tittle (right) on the 49ers. Photo by Associated Press/1960 Photo: 1960, Associated Press.

Entire books have been written about the West Coast Offense. Friend of the program Chris Brown has an excellent primer on some of the principles of the system. Due to time constraints, this post is not going to dissect a voluminous playbook, translate Spider 3 Y Banana into English, or discuss the role of motions or shifts in the offense. This post will not help you find the winning edge.

I thought it would be interesting to see if certain statistics could help identify teams that ran a West Coast Offense. My initial thought was that an effective West Coast Offense would manifest itself in three key statistics:

  • Completion percentage. The WCO is built around short passes that work as a substitute for running plays. These long handoffs lead to high completion percentages for the quarterback.
  • Yards per completion. Short passes imply lower yards per completion. Ideally, we’d analyze yards per completion after removing yards after the catch, but that’s not something the NFL kept records of historically. Still, I think a low yards per completion average can be a good indicator that a team ran a West Coast Offense.
  • Passing first downs. In a West Coast Offense, teams are moving the chains through the air. With fewer long gains and a pass-first mentality, one would expect a lot of passing first downs.

Background

If you’re a historian, you can skip this section. The classic story told about the birth of the West Coast Offense takes us back to before the AFL-NFL merger. In 1969, the Bengals had Paul Brown as head coach and Bill Walsh as the assistant coach/offensive coordinator. That year, quarterback Greg Cook had one of the great rookie seasons in history, but injuries to his rotator cuff and biceps ruined his career. The team turned to backup Virgil Carter, a very smart and accurate passer but who was destined to be a backup because of his size and weak arm. Those factors led Walsh and Brown to implement an offense that catered to Carter’s strengths and hid his weaknesses.

Carter wasn’t just smart for football. In 1970, he published a seminal paper that was the precursor to the Expected Points models we see today; in ’71, Carter led the NFL in completion percentage, but ranked third to last among the 21 qualifying quarterbacks in yards per completion. The Bengals ranked 9th in passing first downs, and those statistics seem to jive with the picture we all have in our heads of a West Coast Offense.
[continue reading…]

{ 9 comments }

Vegas likes Alabama a lot more than it likes LSU

Vegas likes Alabama a lot more than it likes LSU.

The Simple Rating System is a set of computer rankings focused on only two variables: strength of schedule and margin of victory. I published weekly college football SRS ratings each week last season, and you can read more about the SRS there. Last month, Jason Lisk of the Big Lead took the Las Vegas point spread for each NFL game to come up with a set of power rankings; I stole Lisk’s idea and used the same point spreads to create implied SRS ratings for every NFL team. The idea is that if the 49ers are a 10.5-point neutral site favorite over the Jaguars, that’s one data point that implies that Las Vegas views San Francisco as 10.5 points better than Jacksonville. By taking every data point, and using Excel to iterate the ratings hundreds of times, you can create a set of implied team ratings.

Last week, the Golden Nugget released the point spreads for 248 college football games. By using the same process, those point spreads can help us determine the implied ratings that Las Vegas has assigned to each team.

We don’t have a full slate of games, but we do have at least 1 game for 83 different teams. Theoretically, this is different than using actual game results: one game can be enough to come up with Vegas’ implied rating for the team. That’s because once we’re confident in Oklahoma’s rating, Tulsa being 18-point underdogs in Norman gives us a good estimate for how Vegas views Tulsa. I assigned 3 points to the road team in each game in coming up with the implied SRS ratings. For example, Arizona is an 11-point favorite on the road against California. So for that game, we assume Vegas believes the Wildcats are 14 points better than the Golden Bears; if we do this for each of the other 247 games, and then iterate the results hundreds of times, we can come up with a set of power ratings.

Unsurprisingly, Alabama comes out as the highest-rated team. The Crimson Tide are being rated as 19.6 points better than “average,” although average isn’t really a concept with much meaning here. The SRS rating has little meaning in the abstract, but is useful to get a sense of the Crimson Tide’s rating relative to the rest of the teams. If Alabama is 10 points better in the SRS than a team, that means Alabama would be projected as a 10-point favorite on a neutral site. In the table below, I’ve included the number of games for which we have point spreads for each team on the far left. The “MOV” column shows the home field-adjusted average point spread for that team, the “SOS” column shows the average rating of each team’s opponent (for only the number of games for which we have lines), and the “SRS” column shows the school’s SRS rating.
[continue reading…]

{ 3 comments }

What can we learn from Game Scripts splits?

Christian Ponder actually played better in the worst Vikings games last year

Christian Ponder actually played better in the worst Vikings games last year.

When I ask a question in the title of a post, I usually have an answer. But not this time. From 2000 to 2012, 163 different quarterbacks started 16 games. I thought it might be interesting to check out their splits based on the Game Script of each game. I grouped each quarterback’s statistics in their team’s 8 highest Game Scripts and 8 worst Game Scripts in the table below. The statistics in blue are from the 8 best games, while the numbers in red are for the 8 worst games (as measured by average points margin in each game).

I don’t know if individual splits will tell us much, but Rex Grossman had the largest split. In 2006, the year the Bears went to the Super Bowl, he averaged 8.54 AY/A in Chicago’s best 8 games but just 3.24 AY/A in their worst games. Splicing out cause and effect is tricky: in games where a quarterback has lots of interceptions, his team is probably going to be losing and will have a negative game script for that game. In Chicago’s 8 best games that year (according to Game Scripts), Grossman threw 16 TDs and 4 INTs; in their 8 worst, he threw 7 TDs and 16 INTs.

Maybe there’s nothing to make of this. But it’s Sunday, so I’ll present the day and open the question to the crowd. What can we make of Game Scripts splits? Check out the table below.
[continue reading…]

{ 5 comments }

NFL Average Plays per Team Since 1950

In light of the Patriots nearly breaking the NFL record for plays, and the promise of up-tempo offenses in Philadelphia (under Chip Kelly) and Denver (Adam Gase), it’s easy to think that the number of plays run per team is about to reach historic levels. But that seems really unlikely.

The graph below shows the number of plays run per team game for each season since 1950. The total number of plays run is in blue for the NFL; I also added the same data for the AFL in red. As you can see, the number of plays per team game has been relatively steady over the last 64 years, but the high-water marks were the early ’50s and most of the 1980s.

In addition to plays run, the graph also shows:

  • The number of rushing plays per team game in green, a number that’s obviously on the decline.
  • The number of completions per team game in black, which has risen as the number of runs has declined.
  • The number of incomplete passes per team game in orange. Incomplete passes stop the clock, so I thought we might see something interesting there. How’s this for trivia: there were 13.5 incomplete passes per team game in 2012, the same number that existed in 1948! While 1948 is off the graph, you can see that the number of incomplete passes per game has been remarkably consistent throughout NFL history. In fact, the average from 1950 to 2012 is 13.5 incompletions per game, and the league average was 13.5 +/- one incompletion in over 80% of the seasons since 1950.
  • The number of sacks per team game is in purple, a number that has also stayed very consistent over time. Only three times since 1950 has the league average been less than two sacks per game or more than three sacks per game.
playslgavg1950
{ 5 comments }

Records of Great Coaches Against Great Coaches

ESPN is counting down its top 20 coaches in NFL history. So far, we have:

Old school Parcells/Belichick

Can you believe the Jets hired Pete Carroll? I would never go there.

No. 20: Tony Dungy
No. 19: Mike Shanahan
No. 18: Sid Gillman
No. 17: Marv Levy
No. 16: Hank Stram
No. 15: Bud Grant
No. 14: Tom Coughlin
No. 13: Jimmy Johnson
No. 12: John Madden
No. 11: Bill Parcells
No. 10: Curly Lambeau
No. 9: Joe Gibbs
No. 8: Tom Landry
No. 7: Bill Belichick
No. 6: Paul Brown

No doubt, the final five coaches are Don Shula, Chuck Noll, George Halas, Vince Lombardi; and Bill Walsh. But this post isn’t me complaining about those rankings or coming up with my own system.

Grading coaches across eras is even more difficult than it is with players. How do you compare Lambeau, who coached for 33 years and won 6 NFL championships, to Belichick? Lombardi became a head coach in ’59, Shula in ’63. But how do you vault when over the other when Lombardi died in 1970 while Shula was still coaching in 1995? John Madden has the best winning percentage among coaches with at least 100 games, but he took over a team that went 25-3 in the two years before he arrived. What’s the appropriate way to compare him to Walsh or Johnson?

Instead of trying to answer the difficult questions, I’ll answer something I’m very well-equipped to handle. I’ve seen people cite the records of certain coaches against each other as evidence for or against a particular coach. That’s an obviously flawed way to break a divide, but hey, it’s Friday in the offseason, so let’s look at head-to-head coaching records.
[continue reading…]

{ 8 comments }

Eleven Years And Counting

Outstanding. Now the real question? Want to be a Footballguy?

That was the e-mail I received from David Dodds on June 6, 2002. The co-owner of Footballguys.com then and now, Dodds was replying to a freelance article I submitted to his site. Two days later, my article was posted, and I had become a paid writer.

Eleven years ago, there was no twitter, blogging wasn’t mainstream, and fantasy football was probably less cool and definitely less popular than Dungeons and Dragons. I hated writing: growing up, I was always a “math person.” I thought of writing proficiency as a soft skill, itself a euphemism for a useless skill, and had no desire to spend a moment of my time writing. My brother was and is a sports anchor/reporter, and he was the writer in the family.

I began playing fantasy sports in the late ’90s, which was a year-round hobby as fantasy basketball and fantasy football rose in popularity (I started off with fantasy baseball). I was quickly hooked on fantasy football, but it took a couple of years before Footballguys came across my radar. The articles were terrific and opened my eyes to the intricacies and strategies of the game. But the real treasure was the site’s message board. I could post on the board and minutes later someone would reply. That was my first introduction to the value of reader feedback. I didn’t think of “posting” on the message board as writing, but it was there that I learned the appropriate ways to craft an argument. The board also helped me develop a pretty thick skin for internet criticism, the sort of armor every blogger needs.
[continue reading…]

{ 37 comments }

After hearing that the other Steve Smith was retiring, Kyle on twitter asked me where Smith’s 2009 season ranked in the pantheon of anomalous wide receiver seasons. In case you forgot, take a look at Smith’s yearly production:

Year Age Tm G GS Rec Yds Y/R TD
2007 22 NYG 5 0 8 63 7.9 0
2008 23 NYG 16 4 57 574 10.1 1
2009* 24 NYG 16 15 107 1220 11.4 7
2010 25 NYG 9 7 48 529 11.0 3
2011* 26 PHI 9 1 11 124 11.3 1
2012 27 STL 9 0 14 131 9.4 0
Career 64 27 245 2641 10.8 12
4 yrs NYG 46 26 220 2386 10.8 11
1 yr PHI 9 1 11 124 11.3 1
1 yr STL 9 0 14 131 9.4 0

Smith had what looked like a breakout season in 2009, catching 107 passes for 1,220 yards and seven touchdowns. As it turned out, those numbers represent 44% of his career receptions, 46% of his career receiving yards, and 58% of his career touchdowns.

So how do we measure the biggest outlier seasons of all time? One way would be to compare each receiver’s best season to his second best season and see the difference. I used Adjusted Catch Yards — calculated as Receiving Yards plus five yards for every Reception and twenty yards for every Receiving Touchdown — to do that for every retired receiver and tight end in NFL history. The table below shows all receivers who gained at least 800 more Adjusted Catch Yards in their best season than in their second best season. For example, here’s how to read the Germane Crowell line. Crowell’s best season came with Detroit in 1999, when he caught 81 passes for 1,338 yards and 7 touchdowns. That’s equal to 1,883 Adjusted Catch Yards. In his second best year, he caught only 34 passes for 430 yards and three touchdowns, giving him only 660 ACY. That’s 1,223 Adjusted Catch Yards fewer than in his best season. Using this method, Steve Smith comes in with the sixth most anomalous season in NFL history.
[continue reading…]

{ 3 comments }

Which NFL teams draft from which colleges? Part II

You can see why the Bengals like the Bulldogs.

You can see why the Bengals like the Bulldogs.

Last week, I posted this article analyzing NFL team/college pairings in the NFL Draft. In that study, I included every draft pick since 1936, as the goal was to get a flavor of NFL history. However, I thought it would be fun to do the same thing but to look at more recent time periods. Today’s post will be mostly tables, so hopefully you guys can add the analysis. Let’s start by looking at all (but only) the drafts in the post-merger period in NFL history.

NFL Drafts from 1970 to 2013

Top Five Schools for each Team

The Rams/UCLA connection is still at the top of the list, but the Pittsburgh/Pittsburgh combination falls off. In fact, the Chiefs and 49ers have drafted as many Panthers since the merger (10) as the Steelers. The table below shows the top five schools for each team: [continue reading…]

{ 2 comments }

Throwing deep against Charles Tillman can be hazardous to your passer rating

Throwing deep against Charles Tillman can be hazardous to your passer rating.

Last off-season, I produced an exhaustive analysis of fumble recovery rates. With 13 years of play-by-play data at my disposal, I thought it would be worthwhile to take a closer look at interceptions. You can skip to the results section if you like, but let me start with a few disclaimers.

Interceptions are tricky to analyze. Interception rates are very inconsistent from year to year, so much so that completion percentage alone may be a better predictor of future interception rate than actual interception rate. But putting aside randomness, there are two other big factors that determine interception rates: the score in the game and the length of the throw.

Just about every quarterback will throw more interceptions when his team is trailing in the fourth quarter. Situation plays a huge role in football, and that’s true when it comes to interception rates, too. Similarly, quarterbacks are much more likely to be intercepted on deep passes than short ones. One thing I wanted to look at was how much league-wide interception rates varied over a wide range of circumstances.

Unfortunately, there still is a bit of bias in the data. The best quarterbacks are most likely to be winning and the worst quarterbacks are most likely to be losing. That means to the extent that trailing teams throw more interceptions than leading teams, the results are probably slightly overstated. Still, I think getting a sense of the league baseline over hundreds of thousands of throw — even if not evenly distributed — can be a useful exercise.

The Results

From 2000 to 2012, there were 6,689 interceptions thrown. Here’s the breakdown with respect to the points differential (i.e., points scored minus points allowed) for the offensive team immediately before the interception. For example, teams trailing by more than four touchdowns have thrown 110 interceptions over the last 13 regular seasons. That accounts for 1.6% of all interceptions thrown over that time period:
[continue reading…]

{ 15 comments }

Over at Footballguys.com, I explain my method of how to value a player that we know is going to a certain number of games. You can’t simply use the player’s projected number of fantasy points because that will underrate him. But if you go by his projected points per game average, he’ll be overrated. Using Rob Gronkowski as an example, I explained my method:

First, you need to determine the fantasy value of a perfectly healthy Gronkowski.  Prior to today’s news, David Dodds had projected Gronkowski to record 70 catches for 938 yards and 9 touchdowns… but in only 14 games.  This means Dodds had projected the Patriots star to average 10.6 FP/G in standard leagues, 15.6 FP/G in leagues that award one point per reception, and 18.1 FP/G in leagues like the FFPC that give tight ends 1.5 points per reception.

But those numbers aren’t useful in a vacuum: the proper way to value a player isn’t to look at the number of fantasy points he scores.  Instead, the concept of VBD tells us that a player’s fantasy value is a function of how many fantasy points he scores relative to the other players at his position.  I like to use a VBD baseline equal to that of a replacement player at the position, and “average backup” is a good proxy for that.  In a 12-team league that starts one tight end with no flex option, that would be TE18.  In standard leagues, TE18 on a points per game basis is Brandon Myers, the ex-Raiders tight end now with the Giants.  Footballguys projects Myers to average 5.4 FP/G in standard leagues and and 8.9 FP/G in PPR leagues.  In 1.5 PPR leagues, Martellus Bennett comes in at TE18 in our projections, with an average of 10.6 FP/G.

You can read the full article, which includes a neat table, here.

{ 4 comments }

At Footballguys.com, I explain why fantasy football owners need to understand the concept of regression to the mean. Readers of this blog probably don’t need the long background, but you might enjoy some of the graphs at the end. For example, this is the distribution of yards per carry in Year N and yards per carry in Year N+1:

regression ypc

You can read the full article here.

{ 4 comments }
Previous Posts