≡ Menu

Let’s take a quick look at the point spread for the NFC East games today:

The Cowboys are 3.5 point home favorites against the Browns.
The Football Team are 14-point home dogs against the Ravens.
The Giants are 13.5-point underdogs in Los Angeles against the Rams.
The Eagles are 9-point road underdogs tonight in San Francisco.

Yes, indeed, Mr. Tanier is correct: the NFC East are underdogs of 33 or 33.5 points today (the Baltimore/Washington line has fluctuated between 14 and 14.5 points). That sounds like a lot. It is a lot. But how much of an outlier is that?

As it turns out, there has been just one week since 1978 (which is as far back as PFR’s points spread database goes back) where the collective points spread for Dallas, Washington, New York, and Philadelphia was worse: week 13 of the 1998 season. That was the week that Randy Moss had three 50+ yards touchdown catches on Thanksgiving against the Cowboys, Washington was 2-9 under Norv Turner but upset the Raiders, the Giants under Kent Graham were 13-point dogs against a high-powered 49ers team (and lost by 24), and the Eagles and Koy Detmer were 18-point dogs against the two-time defending NFC Champion Packers.

And that’s it. Week 4 of the 2020 season is the second-worst week in history, at least as far as perception relative to opponent goes, for this quartet of teams. [1]Note that I am not saying NFC East history, as I am excluding the Cardinals from this post. Here’s the average points spread over the course of each season since 1978 for the Giants, Cowboys, Eagles, and the WFTFKATR. Remember, when looking at point spreads, it’s the reverse of points differential: a positive number indicates a weaker team. [continue reading…]

References

References
1 Note that I am not saying NFC East history, as I am excluding the Cardinals from this post
{ 0 comments }

Jameis Winston Is A Very Fun QB

Jameis Winston has played 15 games so far this season, and he’s thrown for 4,908 yards, with 31 touchdowns and 28 interceptions.  He is going to run away with the INT crown, is a good favorite to win the passing yards crown, and will likely finish anywhere from 1st to 3rd in passing touchdowns. Winston also is in a tight race with two half-season guysMatthew Stafford and Ryan Tannehill — to win the yards per completion crown.  Oh, and he leads the NFL right now in sacks taken, too.

Some of this is a function of him leading the NFL in pass attempts (he’s also played 15 games, while most teams play their 15th game today).   But Winston is also just extreme in almost every fun stat, which is why I decided to revisit my Fun QB Index with some tweaks.

Here are the rules for being fun:

  • Passing a lot.
  • A high yards per completion average.
  • Touchdowns.
  • Interceptions.

So here’s the simple formula I came up with:

Fun = [ (Yards per Completion – 10.0) * Completions, plus 45 x INTs, plus 45 x TDs ] / Games Played

This isn’t a rate stat, which means you get more credit for passing more often…. except when it comes to yards per completion.  There, you only get credit for your yards per completion above 10.0.

Let’s use this formula for Winston.  He’s completed 367 of 602 passes for 4,908 yards, a 13.37 yards per completion average.  So he gets credit in the YPC component of the formula for (3.37 * 367), or 1,237 yards.  With 59 combined TDs/INTs, that gets him another 2,655 yards.  That gives him 3,892 fun yards, which is an average of 259.5 yards per game of fun.

Now, that probably means nothing to you in the abstract. But here is how the 2019 quarterbacks look when you run them through the same formula: [continue reading…]

{ 0 comments }

I like to run a contest where I ask you 38 questions, you answer them, and we all look silly after the season. This year, Adam Steele did the lion’s share of the work, and we thank him for that.

Below you will find 38 pairs of numbers. In each case, you tell me which number will be bigger. One point for each correct answer. Most points wins.

Ties — and I expect there to be a nontrivial number of them — go to the side that had fewer votes. For example, here is a pair:

Number of wins by the Lions
Number of wins by the Ravens

Let’s say 49 people take the Lions and 44 take the Ravens. If the Lions and Ravens end up with the same number of wins, then each Ravens-backer will get a point and each Lions-backer will not. Last year, JimZornsLemma won with 25 correct guesses out of 38; the average was just 19 correct guesses. Thanks to Jeremy De Shetler for an assist on some of this year’s questions.

GRAND PRIZE: the main prizes will be (1) honor and (2) glory. There may also be some sort of trinket to be named later. By the time this thing is over, more than five months will have passed, so that gives me some time to scrape something together. But you probably shouldn’t enter unless honor and glory are sufficient.

MORE RULES:

1. Everyone is limited to one entry per person. This will be enforced by the honor system. If caught breaking this rule, you, your children, and your children’s children will be banned from all future FP contests.

2. I won’t enter the contest myself, which will allow me to arbitrate any dispute impartially. Any ambiguity in the rules will be clarified by me in whatever way causes me the least amount of hassle.

3. While there are quite a few items that refer in some way to the NFL postseason, unless specifically stated, all the items below refer to regular season totals only.

5. You may enter until 1:00 p.m. Eastern time on Sunday, September 9th, 2018. However, there’s an incentive to entering early because…

6. In the event that the contest ends in a tie, the winner will be the person whose entry was submitted first. [continue reading…]

{ 0 comments }

The NFL Is Partying Like It’s 1978

For the majority of the NFL, the 2017 season feels pretty similar to the 1978 season.

In 1978, the Rams won 75% of their games and the Redskins went .500.
In 2017, the Rams have won 75% of their games and the Redskins are .500.

In 1978, the Colts had a superstar quarterback (Bert Jones) in the prime of his career, but he was hurt, and the team finished with the worst points differential in the NFL. In 2017, the Colts have a superstar quarterback in the prime of his career (Andrew Luck), but he is hurt, and the team has the worst points differential in the NFL.

The 1978 49ers had the worst record in the NFL. The 2017 49ers have the worst record in the NFL.

In 1978, the Packers won 8 games with a Hall of Fame QB on the sidelines in head coach Bart Starr; the 2017 Packers are 4-4 with a Hall of Fame QB on the sidelines in Aaron Rodgers.

The 1978 Giants finished in last place in the NFC East. The 2017 Giants are going to finish in last place in the NFC East.

The 1978 Jets went 8-8; with a win over the Bucs this Sunday, the 2017 Jets will be 5-5.

Speaking of Tampa Bay, the ’78 Bucs finished last in their division by two games; the ’17 Bucs are currently last in their division by two games.

But you know who was good in 1978? The Patriots, Steelers, Cowboys, and Eagles.

In 1978, New England started 6-2 and won the AFC East. In 2017, New England is 6-2 and in first place in the AFC East.

In 1978, Pittsburgh had a top-5 defense and a Hall of Fame quarterback in Terry Bradshaw; in 2017, Pottsburgh has a top-5 defense and a Hall of Fame quarterback in Ben Roethlisberger.

In 1978, Philadelphia made the playoffs with Ron Jaworski in his second season as quarterback of the Eagles; in 2017, Philadelphia will make the playoffs with Carson Wentz in his second season as quarterback of the Eagles.

In 1978, Dallas made the playoffs with Pro Bowlers at QB, RB, WR, and TE in Roger Staubach, Tony Dorsett, Tony Hill, and Billy Joe DuPree; in 2017, Dallas is 5-3 and on the road to the postseason thanks to star QB Dak Prescott, star RB Ezekiel Elliott, star WR Dez Bryant, and star TE Jason Witten.

In 1978, the Vikings won their division; in 2017, the Vikings are in first place in their division.

In 1978, the Bengals and their 29-year-old franchise quarterback Ken Anderson had a down year; Anderson went 4-8 as the starter. In 2017, the Bengals and their 30-year-old franchise quarterback Andy Dalton is having a down year; Dalton is 3-5 as a starter.

In 1978, the Bears had a losing record and yet still ranked last in pass attempts; in 2017, the Bears have a losing record and yet still rank last in pass attempts.

In 1978, the Falcons were a year removed from greatness on one side of the ball, and sputtered around .500; in 2017, the Falcons are a year removed from greatness on one side of the ball, and are sputtering around .500.

In 1978, the Lions finished 7-9 with an average offense and an average defense; in 2017, the Lions are 4-4 with an average offense and an average defense.

In 1978, the Cardinals had a losing record and an ugly offense; in 2017, the Cardinals have a losing record and an ugly offense.

In 1978, the Raiders disappointed; after an 11-3 season with a great quarterback in Ken Stabler, the team missed the playoffs. In 2017, the Raiders are disappointing; after a 12-3 season with Derek Carr in 2016, the Raiders are on track to miss the postseason.

In 1978, the Chargers had a Hall of Fame quarterback in Dan Fouts, but a 1-4 start and a tough division kept them out of the playoffs. In 2017, the Chargers have a Hall of Fame caliber quarterback in Philip Rivers, but a 1-4 start and a tough division might is likely to leave them out of the playoffs.

The 2017 Browns have lost 8 games, just like the 1978 Browns.

Not all teams are playing like it’s 1978, of course. The Ravens, Jaguars, Panthers, and Texans didn’t exist. The Saints were 7-9 that year, while this year’s Saints are 6-2 and look to be one of the better and more balanced (!) teams in the league. The Broncos were 10-6 with a great defense and a pretty good offense; this year’s Broncos are 3-5 with a terrible offense and a pretty good (and sometimes great) defense. This year’s Seahawks team is 6-3 and has a good chance of making the playoffs thanks to a good offense and a good defense; the ’78 Seahawks had a very good offense but a terrible defense, finishing 9-7 and out of the playoffs. Kansas City was one of the worst teams in the NFL in 1978, but one of the best in 2017. And the Bills were bad in ’78 but good in ’17, while the Dolphins are the reverse.

{ 8 comments }

The normal way to measure a franchise’s winning percentage is the simplest. All you need to do is take the team’s total number of wins, add to that number the total number of ties divided by two, and then take that sum and divide it by the team’s total number of games.

That’s simplest and makes sense and is perfectly correct. However, it also means games in 1960 are given the same weight as games in 2016. And depending on what you want to measure, that may not be what you want to do. If you want to measure something like the amount of pleasure a fanbase receives from its team [1]Why would you want to do this? I have no idea., you want to put more weight on recent seasons. [continue reading…]

References

References
1 Why would you want to do this? I have no idea.
{ 19 comments }

Passing Yardage Will Always Be For Lovers

Passing is for lovers

There have been 44 quarterbacks in NFL history to throw for at least 30,000 yards. Given enough time, you could probably guess that Drew Bledsoe, Jim Kelly, and Steve McNair are three of them. All three have something else in common: they were all born on February 14th.

If we drop the cut-off to 16,000 yards, we jump to 137 quarterbacks but get to include David Garrard, another Valentine’s Day baby. But wait, there’s more: If we drop the threshold to 3,500 passing yards, we get to include Patrick Ramsey and Anthony Wright. Those guys may not impress you, but consider that only 334 players have thrown for 3,500 yards. That means dozens of days have zero quarterbacks with 3,500 yards — including New Year’s Day, Cinco De Mayo, Halloween, and Christmas Eve — so slotting in Ramsey and Wright as QB5 and QB6 on your birthday dream team is pretty damn good. [continue reading…]

{ 2 comments }

The Washington Redskins have made five Super Bowls in their history:

  • To conclude the 1972 season, with Republican Richard Nixon in office as President of the United States;
  • At the end of the 1982, 1983, and 1987 seasons, with Republican Ronald Reagan as the sitting POTUS;
  • In January 1992, during the final year of Republican George H. W. Bush’s presidency.

During the Super Bowl era, Washington has gone 272-180-3 while a Republican is in office. That translates to a .601 winning percentage, the best of any team.

But the Redskins have been a lot worse with a Democrat in office. In fact, Washington has a lowly 150-201-5, a 0.428 winning percentage that is the fourth worst of any team during the Super Bowl era. Washington’s best years came under Reagan, Bush, Ford, and Nixon, while the franchise’s worst years have been under Obama, Clinton, and LBJ.  Take a look: [continue reading…]

{ 8 comments }

A fun article at Five Thirty Eight last week noted how insanely top-heavy the NBA is this year. Just about everyone knows that the Warriors set the record for wins in a season with 73, as part of a wire-to-wire display of dominance. But the Spurs were nearly as good. In fact, based on Elo Ratings, San Antonio was the best second-best team in the league in league history. And the Oklahoma City Thunder? They’re currently (since Elo is constantly updating) the strongest 3rd-best team in NBA history. And LeBron James and the Cavs? They’re the toughest 4th-best team in NBA history, thanks in part to a scorched earth run through the Eastern Conference in the playoffs.

Which made me wonder: what NFL season was most comparable to the 2015-2016 NBA season? There are some good candidates out there:

  • In 2012, the Seahawks, 49ers, Patriots, and Broncos were far and away the best teams in the NFL. They were no flukes in this bunch: those four teams met in the conference championship games the next year, after another set of strong regular seasons.

[continue reading…]

{ 7 comments }

In the comments to this post, Ryan noted that Mike Alstott led the Bucs with 557 receiving yards in 1996, but it was the fewest yards of any player who led his team in receiving yards that season. And in 1997, Karl Williams led Tampa Bay with just 486 receiving yards, also the fewest of any player who led his team in receiving yards that year.

Which made Ryan wonder: why isn’t there a list of the lowest team-leading receiving total across the league for each season? That’s a good question, so I went ahead and generated it for every season since 1950. For example, Jacksonville’s undrafted rookie Allen Hurns led the Jaguars with 677 receiving yards in 2014, but every other team had at least one player with more yards. [continue reading…]

{ 5 comments }

There have been 35 quarterbacks in NFL history to throw for at least 30,000 yards. Given enough time, you could probably guess that Drew Bledsoe, Jim Kelly, and Steve McNair are three of them. All three have something else in common: they were all born on February 14th.

If we drop the cut-off to 16,000 yards, we jump to 130 quarterbacks but get to include David Garrard, another Valentine’s Day baby. But wait, there’s more: If we drop the threshold to 3,500 passing yards, we get to include Patrick Ramsey and Anthony Wright. Those guys may not impress you, but consider that only 322 players have thrown for 3,500 yards. That means dozens of days have zero quarterbacks with 3,500 yards, so slotting in Ramsey and Wright as QB5 and QB6 on your birthday dream team is pretty damn good.

By now, regular readers will have picked up on the fact that this post is a blatant ripoff of Doug’s original post back in 2008, which I updated two years ago. In terms of total career passing yards through the entire history of the league, today has an enormous lead on the second-best birthday, March 24, which consists entirely of Peyton Manning, Aaron Brooks, and Scott Brunner.  Put simply, passing yardage is for lovers, with maybe an exception or two for a certain linebacker or running back.

If you’re looking to give birth to an NFL quarterback, let me give you a word of comfort: one need not be so precise with their delivery dates. That’s because tomorrow, February 15th, is another outstanding day for quarterbacks, ranking in the top five for passing yards. It’s the birthday of Football Perspective love icon John Hadl, a (perhaps) one-day-Hall-of-Famer in Ken Anderson, and former Raider Marc Wilson. So my parenting advice to you is to circle May 14 and May 15 on your calendars, to give yourself a little wiggle room.

Oh, and happy 22nd birthday to one man who is most certainly not a lover of quarterbacks: Jadeveon Clowney.

{ 3 comments }

Super Bowl XLVIII Preview Generator

The Super Bowl is still 18 days away, but that doesn’t mean it’s too early to write a preview of The Big Game. In fact, only suckers wait until the conclusion of the conference championship games to write their preview article. So prepare yourself for your first Super Bowl XLVIII Preview:

Super Bowl XLVIII Promises To Be A Classic

The NFL was at its best on championship Sunday, providing us with a delicious appetizer in preparation of Super Bowl XLVIII. In the early game, Tom Brady and Peyton Manning staged yet another all-time classic, and then Russell Wilson and Colin Kaepernick gave us a glimpse of the next great quarterback rivalry in the late game. One thing’s for sure: after two great battles following yet another remarkable season, the two best teams in the league will be meeting this year at MetLife Stadium.

After winning games in Denver and Seattle to get here, I don’t think either team is going to be afraid of the elements in two weeks. You will hear many doomsday predictions for the weather in this game, but truth be told, neither team is at a disadvantage in the first cold-weather Super Bowl. Many narratives will be written about this year’s game, so let me be the first to remind you that this game features [a matchup of two former Jets head coaches in the stadium where the Jets play their home games/rematch of Super Bowl XXIV/Brady against the team he grew up loving/the teams from the only two states in the country to legalize recreational marijuana/]!

One topic of discussion you’ll certainly hear this week: if victorious, many would conclude that OLDQB is the greatest quarterback in NFL history. With multiple MVP awards and multiple Super Bowl rings on top of some pretty incredible statistical accomplishments, it would be hard to argue otherwise. And consider: [Manning would become the first quarterback to win Super Bowls with two different teams and the first quarterback to win the Super Bowl and lead the league in passing yards in the same season./Brady, who win or lose will to become the first quarterback to ever start in six Super Bowls, surpassing John Elway, would join Joe Montana and Terry Bradshaw in the four ring club with a win. Brady would also become the only quarterback to ever win Super Bowls more than a decade apart, an incredible accomplishment.] And while the stakes may not quite be the same for YOUNGQB, a Super Bowl victory would perhaps be the foundation of a Hall of Fame career.

[continue reading…]

{ 10 comments }

One of my favorite sabermetric baseball articles of all time was written by Sky Andrecheck in 2010 — part as a meditation on the purpose/meaning of playoffs, and part as a solution for some of the thorny logical concerns that arise from said mediation.

The basic conundrum for Andrecheck revolved around the very existence of a postseason tournament, since — logically speaking — such a thing should really only be invoked to resolve confusion over who the best team was during the regular season. To use a baseball example, if the Yankees win 114 games and no other AL team wins more than 92, we can say with near 100% certainty that the Yankees were the AL’s best team. There were 162 games’ worth of evidence; why make them then play the Rangers and Indians on top of that in order to confirm them as the AL’s representative in the World Series?

Andrecheck’s solution to this issue was to set each team’s pre-series odds equal to the difference in implied true talent between the teams from their regular-season records. If the Yankees have, say, a 98.6% probability of being better than the Indians from their respective regular-season records, then the ALCS should be structured such that New York has a 98.6% probability of winning the series — or at least close to it (spot the Yankees a 3-0 series lead and every home game from that point onward, and they have a 98.2% probability of winning, which is close enough). [continue reading…]

{ 8 comments }

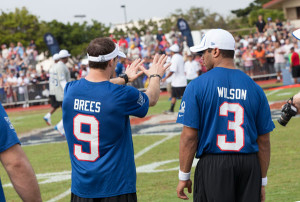
Brees and Wilson scheming to get on an amusement park ride

Brees and Wilson scheming to get on an amusement park ride.

New Orlean’s Drew Brees is officially listed as six feet tall. Seattle’s Russell Wilson is officially listed as 5’11. That means the average height of the starting quarterbacks in tonight’s game is 71.5 inches, tied for the shortest average in any game since 1964. In fact, it’s been twelve years since a game has featured two quarterbacks of such short stature, when in week two of the 2001 season, Doug Flutie (5’10) and the Chargers beat Anthony Wright (6’1) and the Cowboys.

The other two games since 1990 where the average height of the starting quarterbacks was below six feet also involved Flutie facing a 73-inch quarterback: a 24-21 win in 1999 against Pittsburgh and Kordell Stewart and a 17-16 win year earlier against Mark Brunell and the Jags.

Twenty-five years ago, two other Flutie vs. 6’1 Quarterback games make the list: this game against Jim McMahon and this one against Dave Krieg.

You have to go back to 1978 to find a game before tonight where (1) the average height of the starting quarterbacks was under six feet and (2) Doug Flutie was not involved. Fran Tarkenton (6’0) and Pat Haden (5’11) met five times in the mid-to-late ’70s, and Billy Kilmer (6’0) also faced Haden in the final game of the 1977 season.

Kilmer and 5’11 Bob Berry met three times in the early ’70s, and Sonny Jurgensen (5’11) faced Gary Cuozzo (6’0) and Tarkenton twice each. The only other games of the post-merger era were Len Dawson (6’0) vs. Berry in 1972 and Bill Nelsen and Edd Hargett in 1971. [continue reading…]

{ 7 comments }

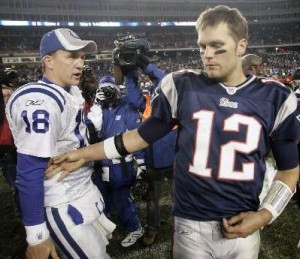
Presented below, without comment, is a table of every matchup featuring Tom Brady & Peyton Manning as the starting quarterbacks. Enjoy:

DateHome TeamFavoritePatriots PassingColts/Broncos PassingAdvantageOutcome
2001-09-30NWECLT -11.513-23, 159 yds, 0 TD, 0 Int, 6.63 ANYPA25-43, 240 yds, 1 TD, 3 Int, 2.72 ANYPA+3.91, NWE44-13, NWE
2001-10-21CLTCLT -10.517-21, 262 yds, 4 TD, 0 Int, 16.29 ANYPA22-34, 305 yds, 1 TD, 0 Int, 8.55 ANYPA+7.73, NWE38-17, NWE
2003-11-30CLTCLT -3.526-35, 226 yds, 2 TD, 2 Int, 4.76 ANYPA29-48, 272 yds, 4 TD, 1 Int, 6.14 ANYPA+1.38, CLT38-34, NWE
2004-01-18 (C)NWENWE -3.522-37, 237 yds, 1 TD, 1 Int, 5.73 ANYPA23-47, 208 yds, 1 TD, 4 Int, 0.94 ANYPA+4.79, NWE24-14, NWE
2004-09-09NWENWE -326-38, 320 yds, 3 TD, 1 Int, 8.38 ANYPA16-29, 244 yds, 2 TD, 1 Int, 7.97 ANYPA+0.41, NWE27-24, NWE
2005-01-16 (D)NWENWE -118-27, 115 yds, 1 TD, 0 Int, 4.50 ANYPA27-42, 230 yds, 0 TD, 1 Int, 4.30 ANYPA+0.20, NWE20-3, NWE
2005-11-07NWECLT -325-40, 254 yds, 3 TD, 0 Int, 7.48 ANYPA28-37, 321 yds, 3 TD, 1 Int, 9.08 ANYPA+1.60, CLT40-21, CLT
2006-11-05NWENWE -2.520-35, 201 yds, 0 TD, 4 Int, 0.60 ANYPA20-36, 301 yds, 2 TD, 1 Int, 7.59 ANYPA+6.99, CLT27-20, CLT
2007-01-21 (C)CLTCLT -321-34, 226 yds, 1 TD, 1 Int, 5.74 ANYPA27-47, 330 yds, 1 TD, 1 Int, 6.10 ANYPA+0.36, CLT38-34, CLT
2007-11-04CLTNWE -521-32, 237 yds, 3 TD, 2 Int, 6.09 ANYPA16-27, 210 yds, 1 TD, 1 Int, 6.17 ANYPA+0.08, CLT24-20, NWE
2009-11-15CLTCLT -1.529-42, 364 yds, 3 TD, 1 Int, 8.61 ANYPA28-44, 316 yds, 4 TD, 2 Int, 6.80 ANYPA+1.81, NWE35-34, CLT
2010-11-21NWENWE -4.519-25, 178 yds, 2 TD, 0 Int, 8.38 ANYPA38-52, 396 yds, 4 TD, 3 Int, 6.56 ANYPA+1.83, NWE31-28, NWE
2012-10-07NWENWE -623-31, 193 yds, 1 TD, 0 Int, 6.09 ANYPA31-44, 324 yds, 3 TD, 0 Int, 8.35 ANYPA+2.26, DEN31-21, NWE
2013-11-24NWEDEN -2.534-50, 324 yds, 3 TD, 0 Int, 7.25 ANYPA19-36, 132 yds, 2 TD, 1 Int, 3.34 ANYPA+3.90, NWE34-31, NWE
{ 6 comments }

(I originally posted this at the S-R Blog, but I thought it would be very appropriate here as well.)

Just a quick hit of a post to let you know that tonight’s MNF matchup between the 0-6 Giants and the 1-4 Vikings is, in fact, the worst ever this late in the season by combined winning percentage:

game_idhomeWLTPFPAroadWLTPFPAyear_idweek_numgame_datecomb_wpctcomb_pt_diffwinner
201310210nygnyg060103209min1401251582013710/21/2013.091-12.6NULL
197512150sdgsdg1110148282nyj39022137819751312/15/1975.167-12.1sdg, 24-16
199411210otioti190147218nyg37017122019941211/21/1994.200-6.0nyg, 13-10
197211060nwenwe25092220clt160941451972811/6/1972.214-12.8clt, 24-17
197011020pitpit2407194cin150931561970711/2/1970.250-7.2pit, 21-10
198110190detdet240118126chi150891331981710/19/1981.250-4.3det, 48-17
199710200cltclt06088155buf3301221591997810/20/1997.250-8.7buf, 9-6
201211260phiphi370162252car28018424320121211/26/2012.250-7.5car, 30-22
200001030atlatl4110251351sfo41102664191999171/3/2000.267-8.4atl, 34-29
200512190ravrav490171253gnb310025525520051512/19/2005.269-3.2rav, 48-3
198310240crdcrd250137218nyg2501261561983810/24/1983.286-7.9tie (20-20)
201112120seasea570216246ram210014029620111412/12/2011.292-7.8sea, 30-13
201011290crdcrd370188292sfo37016021920101211/29/2010.300-8.2sfo, 27-6
200911160clecle17078209rav44020615420091011/16/2009.313-4.9rav, 16-0
198011240nornor0110181341ram74029422819801211/24/1980.318-4.3ram, 27-7
201112050jaxjax380138200sdg47024927520111312/5/2011.318-4.0sdg, 38-14
198312120tamtam2120212345gnb77039640719831512/12/1983.321-5.1gnb, 12-9
198711020daldal330135134nyg150991421987711/2/1987.333-3.5dal, 33-24
199910250pitpit33011793atl150741531999710/25/1999.333-4.6pit, 13-9
200211180ramram450194196chi27018223220021111/18/2002.333-2.9ram, 21-16
200511210gnbgnb270201184min45015422820051111/21/2005.333-3.2min, 20-17
200012040nwenwe390192253kan57028327420001412/4/2000.333-2.2nwe, 30-24
200412130otioti480231294kan48034132620041412/13/2004.333-2.0kan, 49-38
200712100atlatl390171272nor57026627920071412/10/2007.333-4.8nor, 34-14
199112090miamia760256275cin211021137419911512/9/1991.346-7.0mia, 37-13
197311260sfosfo370180232gnb35213819819731111/26/1973.350-5.6sfo, 20-6
197811130cincin190110184rai64019316419781111/13/1978.350-2.3rai, 34-21
200711260pitpit730269145mia010018327420071211/26/2007.350+1.7pit, 3-0
199311290cltclt370154233sdg46016419519931311/29/1993.350-5.5sdg, 31-0
198010270nyjnyj160114164mia430991441980810/27/1980.357-6.8nyj, 17-14
199710270miamia520143124chi0701011991997910/27/1997.357-5.6chi, 36-33
199811020phiphi16079162dal4301741151998911/2/1998.357-1.7dal, 34-0
201211050nornor250190216phi3401201552012911/5/2012.357-4.4nor, 28-13
198311070detdet450202188nyg26116621419831011/7/1983.361-1.9det, 15-9
199111250ramram380181256sfo56021815519911311/25/1991.364-0.5sfo, 33-10
199211300seasea110073218den74017520719921311/30/1992.364-8.0sea, 16-13
200812010htxhtx470252293jax47022424020081312/1/2008.364-2.6htx, 30-17
197111150sdgsdg350150179crd3501351491971911/15/1971.375-2.7sdg, 20-17
197910290atlatl350160181sea3501721811979910/29/1979.375-1.9sea, 31-28
200611130carcar440137163tam26010217320061011/13/2006.375-6.1car, 24-10
200711120seasea440167141sfo26010418620071011/12/2007.375-3.5sea, 24-0
201211120pitpit530191164kan17013324020121011/12/2012.375-5.0pit, 16-13
199010290pitpit340109128ram2401641731990810/29/1990.385-2.2pit, 41-10
201212170otioti490271386nyj67024530620121512/17/2012.385-6.8oti, 14-10
197012070otioti371177249cle56023623619701212/7/1970.386-3.3cle, 21-10
197711210waswas540126132gnb2708315219771011/21/1977.389-4.2was, 10-9
200311170sfosfo450202152pit36017621720031111/17/2003.389+0.5sfo, 30-14
201011220sdgsdg450239197den36020325220101111/22/2010.389-0.4sdg, 35-14
199410170denden140108146kan32090801994710/17/1994.400-2.8kan, 31-28
199911290sfosfo370163281gnb55019220919991211/29/1999.400-6.8gnb, 20-3

It is not, however, the worst by combined PPG margin. That honor belongs to this 1972 game between the 2-5 Patriots and the 1-6 Colts (Baltimore ended up winning 24-17):

game_idhomeWLTPFPAroadWLTPFPAyear_idweek_numgame_datecomb_wpctcomb_pt_diffwinner
197211060nwenwe25092220clt160941451972811/6/1972.214-12.8clt, 24-17
201310210nygnyg060103209min1401251582013710/21/2013.091-12.6NULL
197512150sdgsdg1110148282nyj39022137819751312/15/1975.167-12.1sdg, 24-16
199710200cltclt06088155buf3301221591997810/20/1997.250-8.7buf, 9-6
200001030atlatl4110251351sfo41102664191999171/3/2000.267-8.4atl, 34-29
201011290crdcrd370188292sfo37016021920101211/29/2010.300-8.2sfo, 27-6
199211300seasea110073218den74017520719921311/30/1992.364-8.0sea, 16-13
198310240crdcrd250137218nyg2501261561983810/24/1983.286-7.9tie (20-20)
201112120seasea570216246ram210014029620111412/12/2011.292-7.8sea, 30-13
201211260phiphi370162252car28018424320121211/26/2012.250-7.5car, 30-22
197011020pitpit2407194cin150931561970711/2/1970.250-7.2pit, 21-10
199112090miamia760256275cin211021137419911512/9/1991.346-7.0mia, 37-13
198010270nyjnyj160114164mia430991441980810/27/1980.357-6.8nyj, 17-14
201212170otioti490271386nyj67024530620121512/17/2012.385-6.8oti, 14-10
199911290sfosfo370163281gnb55019220919991211/29/1999.400-6.8gnb, 20-3
197910150nyjnyj240128174min3301071421979710/15/1979.417-6.8nyj, 14-7
200611130carcar440137163tam26010217320061011/13/2006.375-6.1car, 24-10
199411210otioti190147218nyg37017122019941211/21/1994.200-6.0nyg, 13-10
200611060seasea430149177rai250921482006911/6/2006.429-6.0sea, 16-0
199710270miamia520143124chi0701011991997910/27/1997.357-5.6chi, 36-33
197311260sfosfo370180232gnb35213819819731111/26/1973.350-5.6sfo, 20-6
199311290cltclt370154233sdg46016419519931311/29/1993.350-5.5sdg, 31-0
198312120tamtam2120212345gnb77039640719831512/12/1983.321-5.1gnb, 12-9
201211120pitpit530191164kan17013324020121011/12/2012.375-5.0pit, 16-13
200911160clecle17078209rav44020615420091011/16/2009.313-4.9rav, 16-0
200712100atlatl390171272nor57026627920071412/10/2007.333-4.8nor, 34-14
199910250pitpit33011793atl150741531999710/25/1999.333-4.6pit, 13-9
201211050nornor250190216phi3401201552012911/5/2012.357-4.4nor, 28-13
198110190detdet240118126chi150891331981710/19/1981.250-4.3det, 48-17
198011240nornor0110181341ram74029422819801211/24/1980.318-4.3ram, 27-7
197711210waswas540126132gnb2708315219771011/21/1977.389-4.2was, 10-9
199510230nwenwe15069160buf510136951995810/23/1995.500-4.2nwe, 27-14
200611270seasea640203219gnb46018525220061211/27/2006.500-4.2sea, 34-24
201112050jaxjax380138200sdg47024927520111312/5/2011.318-4.0sdg, 38-14
200412060seasea650239223dal47019328920041312/6/2004.455-3.6dal, 43-39
198711020daldal330135134nyg150991421987711/2/1987.333-3.5dal, 33-24
200711120seasea440167141sfo26010418620071011/12/2007.375-3.5sea, 24-0
199010220clecle24098139cin4201541531990710/22/1990.500-3.3cin, 34-13
201110310kankan330105150sdg4201411362011810/31/2011.583-3.3kan, 23-20
197811060cltclt360120230was72018613519781011/6/1978.556-3.3clt, 21-17
200711190denden450153238oti63017815220071111/19/2007.556-3.3den, 34-20
197012070otioti371177249cle56023623619701212/7/1970.386-3.3cle, 21-10
200511210gnbgnb270201184min45015422820051111/21/2005.333-3.2min, 20-17
200512190ravrav490171253gnb310025525520051512/19/2005.269-3.2rav, 48-3
200512120atlatl750277237nor39018329520051412/12/2005.417-3.0atl, 36-17
200211180ramram450194196chi27018223220021111/18/2002.333-2.9ram, 21-16
199410170denden140108146kan32090801994710/17/1994.400-2.8kan, 31-28
197211130sdgsdg251152203cle5301411341972911/13/1972.469-2.8cle, 21-17
197710310crdcrd330124122nyg330911261977710/31/1977.500-2.8crd, 28-0
200512260nyjnyj3110189298nwe95032228920051612/26/2005.429-2.7nwe, 31-21
{ 9 comments }

Making a schedule for a London NFL team

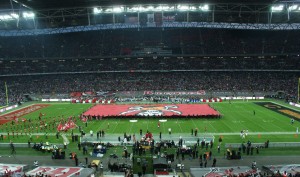
Would the NFL roll out the carpet for London?

Would the NFL roll out the carpet for London?

Bill Barnwell wrote an interesting article about the hurdles the NFL must jump to successfully place a team in London. We don’t know whether the NFL would move an existing team or place an expansion team in London (presumably with the introduction of a second expansion team, likely in Los Angeles, as well). Thirty-four teams is an unwieldy number, so expansion might even bring us to 36 teams (with six teams in three divisions in each conference).

Anecdotally, it seems like most fans are against placing a team in London, or expansion, or change of any kind. For me, the most interesting hurdle to analyze is how to come up with a schedule for a London team. And I think I’ve figured out a decent solution (there are no perfect options). I’m going to use the Buffalo Bills 2013 slate of opponents as a model just because I need to pick some team’s schedule as a model for London’s franchise (I’m going to self-appoint them the Monarchs for purposes of this post). Here are my thoughts:

Week: 1 – Cincinnati Bengals (Home – Friday at 2:30 Eastern)
Week: 2 – Baltimore Ravens (Home)

The big hurdle in creating the schedule is limiting the number of cross-Atlantic trips for the Monarchs.  As a result, you need to bunch together home and road games. And since we want to have the London games in the middle of the season — so we can give the opponents in those games a bye after playing in London — that necessitates a couple of home games early in the year.

The NFL can use the time zone difference to its advantage here, and create a March Madness-style of Friday afternoon fun. On Thursday Night, we have the opener featuring last year’s Super Bowl champion.  And then on Friday afternoon — at 7:30 PM in London — we get another huge event. There would be a Super Bowl-type of atmosphere at the “Week 1 Kickoff Extravaganza” in London on Friday night, and you can be sure that it would get monstrous ratings in England. The NFL doesn’t schedule Friday night games because it doesn’t want to compete with high school football, but the time zone difference works to everyone’s advantage here. The Bengals can fly home after the game and be back in Cincinnati early in the morning on Saturday — which gives them two extra days to prepare for week two.

It also makes sense to have a team that played on Thursday Night in the NFL opener play in London in week two. This year, that would be the Ravens, but it can also be the non-Super Bowl champion appearing in that game.  Baltimore can fly out to London early in the week, using those extra days to help ease some of the travel burden. If they like, the Ravens (or whomever is in the week two slot) can get a Monday Night game in week three.
[continue reading…]

{ 18 comments }

Yesterday, I set up a method for ranking the flukiest fantasy football seasons since the NFL-AFL merger, finding players who had elite fantasy seasons that were completely out of step with the rest of their careers. I highlighted fluke years #21-30, so here’s a recap of the rankings thus far:

30. Lorenzo White, 1992
29. Dwight Clark, 1982
28. Willie Parker, 2006
27. Lynn Dickey, 1983
26. Robert Brooks, 1995
25. Ricky Williams, 2002
24. Jamal Lewis, 2003
23. Mark Brunell, 1996
22. Vinny Testaverde, 1996
21. Garrison Hearst, 1998

Now, let’s get to…

The Top Twenty

20. RB Natrone Means, 1994

Best Season
yeargrushrushydrushtdrecrecydrectdVBD
1994163431,35012392350103.0
2nd-Best Season
yeargrushrushydrushtdrecrecydrectdVBD
199714244823915104012.9

Big, bruising Natrone Means burst onto the scene in 1994 as a newly-minted starter for the Chargers’ eventual Super Bowl team, gaining 1,350 yards on the ground with 12 TDs. In the pantheon of massive backs, he was supposed to be the AFC’s answer to the Rams’ Jerome Bettis, but Means was slowed by a groin injury the following year and never really stayed healthy enough to recapture his old form. The best he could do was to post a pair of 800-yard rushing campaigns for the Jaguars & Chargers in 1997 & ’98 before retiring after the ’99 season.

19. WR Braylon Edwards, 2007

Best Season
yeargrecrecydrectdVBD
200716801,28916107.7
2nd-Best Season
yeargrecrecydrectdVBD
20101653904715.4

The 3rd overall pick in the 2005 Draft out of Michigan, Edwards seemingly had a breakout 2007 season catching passes from fellow Pro Bowler Derek Anderson. But both dropped off significantly the next season, and Edwards was sent packing to the Jets in 2009. He did post 904 yards as a legit starting fantasy wideout in 2010, but he has just 380 receiving yards over the past 2 seasons, and it’s not clear he’ll ever live up to those eye-popping 2007 numbers again.
[continue reading…]

{ 6 comments }

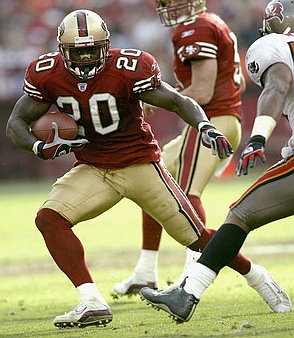
I prefer cooking in a Garrison  Hearst replica jersey

I prefer cooking in a Garrison Hearst replica jersey.

There’s nothing like a truly great fluke fantasy season. Because they can help carry you to a league championship (and therefore eternal bragging rights — flags fly forever, after all), a random player who unexpectedly has a great season will often have a special place in the heart of every winning owner. And even if you only use their jerseys as makeshift aprons to cook in, fluke fantasy greats are a part of the fabric of football fandom. That’s why this post is a tribute to the greatest, most bizarre, fluke fantasy seasons of all time (or at least since the 1970 NFL-AFL merger).

First, a bit about the methodology. I’m going to use a very basic fantasy scoring system for the purposes of this post:

  • 1 point for every 20 passing yards
  • 1 point for every 10 rushing or receiving yards
  • 6 points for every rushing or receiving TD
  • 4 points for every passing TD
  • -2 points for every passing INT

I’m also measuring players based on Value Based Drafting (VBD) points rather than raw points. In a nutshell, VBD measures true fantasy value by comparing a player to replacement level, defined here as the number of fantasy points scored by the least valuable starter in your league. For the purposes of this exercise, I’m basing VBD on a 12-team league with a starting lineup of one QB, two RBs, 2.5 WRs, and 1 TE. That means we’re comparing a player at a given position to the #12-ranked QB, the #24 RB, the #30 WR, or the #12 TE in each season. If a player’s VBD is below the replacement threshold at his position, he simply gets a VBD of zero for the year.
[continue reading…]

{ 2 comments }

How to Improve the NFL Network’s Top 100

For three straight years, NFL Network has produced a list of the Top 100 Players of 20xx. Many people have criticized the results, and this summary from Bill Barnwell hits on some of the main issues. But my issue isn’t with the mistakes the players may be making in the voting booth, but the mistakes made in tabulating the votes. I want to suggest to the fine folks at NFL Network an alternative method for deriving a list of the top 100 players. This method has three big advantages over the current process:

(1) It will take players only a few minutes — or as long as they like — to participate.

(2) More players will be part of the judging, since the time commitment will be lessened.

(3) The results will be more accurate.

Instead of asking players to write down a bunch of names from memory, my suggested method would involve asking them a bunch of simple and straightforward questions. Imagine a player sitting in front of a computer screen, and asked to pick an answer to each of the following:

That’s a lot better than the current system, described below by Mike Florio of Pro Football Talk:
[continue reading…]

{ 18 comments }

Yesterday, Joe Fortenbaugh canonized Mike Lombardi for discovering and emphasizing one of the game’s great hidden stats: the number of rushing attempts plus completions a team has in a game. If you hit 50, you’re in great shape. Fortenbaugh reminds us that Lombardi, whose last team went 2-14, “possesses a vast range of knowledge spanning from management to game theory.” Fortenbaugh does the math for us, noting that the “top-10 teams in rushing attempts + completions combined to post a record of 101-59 (.631) in 2012, with seven of those ten organizations advancing to the postseason. On the opposite end of the spectrum, the bottom-10 teams combined for a 62-97-1 (.387) mark, with zero total playoff berths.” Then, he blows us away with the prize-winning line:

If you take only the teams that averaged 50.0 or more rushing attempts + completions per game over the last five years, you get a combined regular season record of 339-189 (.642), with 22 of 33 (66%) teams qualifying for the postseason. That winning percentage puts a team in between 10 and 11 wins per season.

The headline to the article reads: Average a combined total of 50 rushing attempts and completions per game and a winning season will likely follow. I’ll do the article one better: From 2008 to 2012, including playoffs, teams with 50+ rushes + completions have a record of 819-325-3, giving them a .715 winning percentage.

After reading that article and getting an inside look into Lombardi’s wisdom, I had considered the code to producing a winning season cracked. But I’ve got a robust database, so I thought maybe I could do even better than that .715 winning percentage Lombardi’s stat produces. The following information is based on the results from every game, regular and postseason, since 2008:
[continue reading…]

{ 31 comments }

Tim Tebow's prayers are answered: He's #1

Tim Tebow's prayers are answered: He's #1

With the Jets releasing Tim Tebow, it appears that his NFL career may be over. If that’s the case, it’s time to reflect on a great career that never ceased to captivate the nation. While there are many ways to grade a quarterback, probably the best and simplest measure would be “production in last home start.” After all, the NFL is a ‘what have you done for me lately’ league.

The table below lists the final home start for over 400 retired (or close to retired) quarterbacks (the default is to show just 25 quarterbacks, but the table is fully sortable and searchable, and you can change the number of players displayed by using the drop-down box on the left). For each quarterback, I have provided a link to the boxscore from that game, the result of the game, and the quarterback’s passing and rushing statistics. If Tebow is in fact retired, he will have finished with the highest Adjusted Yards per Attempt (minimum 10 attempts) of any player in his last home start:
[continue reading…]

{ 15 comments }

[In case you missed it, earlier this week, I created an NFL Draft Pick Value Calculator and provided wallet-sized and iPhone-style copies of the 2013 NFL Schedule.]

I find old newspaper articles very entertaining, so I decided to see how the Boston Globe documented the selection of Tom Brady in the sixth round of the 2000 Draft.
On April 17th, the day after the draft concluded, the Globe provided a full summary of each player. Here’s how they described the 199th pick:

6, 199 – Tom Brady, QB, Michigan

A pocket passer who will compete for a practice squad spot with the Patriots . . . Drafted as a catcher by the Montreal Expos in 1995 out of Serra (San Mateo, Calif.) HS . . . Completed 62.8 percent of his passes with 20 TDs and six interceptions. Only Elvis Grbac had more TD tosses in a season for the Wolverines . . . Throws a great slant . . . At almost 6-4, 214 pounds, has some mobility . . . Platooned with sophomore Drew Henson . . . Was projected to go in the third round, but dropped quickly.

[continue reading…]

{ 1 comment }

Will Geno Smith fall in the draft?

Would you risk your job on this man?

Would you risk your job on this man?

I have no inside information and I’m not a draftnik, but that won’t stop me from trying to read the tea leaves. I’m of the opinion that Geno Smith will fall to the late first round of the draft next week. I’m not a huge Smith fan — a passer-friendly system boosted his admittedly impressive numbers — but I wouldn’t label myself a Smith hater, either. So why do I think he’ll slide? Part of the reason is that Smith simply isn’t a slam dunk pick, much to the chagrin of several teams in the top five. Another factor is that following the delusional quarterback carousel last month, no team has a pressing need for a quarterback to start in week 1, a stark contrast to where the Redskins and Colts were this time last year. Finally, while Smith may be the top quarterback prospect on most boards, I’m sure some teams think selecting Matt Barkley, E.J. Manuel, Ryan Nassib, Tyler Wilson, Mike Glennon, Tyler Bray, or Landry Jones in rounds two, three, or four, is preferable to spending a high first round pick on Smith. If those picks miss, the cost is lower, and team won’t feel the immediate need to thrust them into the lineup like they would with Smith.

Looking at the teams drafting in the top ten, and I don’t see any landing spot that is particularly likely for Smith. Consider:
[continue reading…]

{ 7 comments }

Five years ago, Doug wrote an interesting post about game-winning touchdowns. Let’s be clear: tracking things like game-winning touchdowns is only interesting in a trivial sort way, but hey, it’s April.

Football doesn’t have a statistic like “game-winning RBIs” the way baseball does, although my friend Scott Kacsmar has been doing a great job tracking 4th quarter comebacks and game-winning drives for quarterbacks. I was wondering which players have scored the most game-winning touchdowns in the 4th quarter or overtime, and fortunately I have the data to answer that pretty easily. I looked at all games, regular and postseason, in all leagues, from 1940 to 2012, and counted all touchdowns scored that put the player’s team ahead for good (with one exception: I did not count touchdowns scored when down by 7 and the team successfully went for two afterwards).

The table below lists all players with at least five such touchdowns and the teams for which they scored those touchdowns.

[continue reading…]

{ 7 comments }

There have been 35 quarterbacks in NFL history to throw for at least 30,000 yards. Given enough time, you could probably guess that Drew Bledsoe, Jim Kelly, and Steve McNair are three of them. All three have something else in common: they were all born on February 14th.

If we drop the cut-off to 16,000 yards, we jump to 125 quarterbacks but get to include David Garrard, another Valentine’s Day baby. With 366 possible birthdays, it’s pretty incredible that four out of a random group of 125 people would have the same birthday. Consider that no one born on any the following seven days — January 30th, March 4th and 30th, April 9th and 13th, and June 12th and 21st — has ever gained a single passing yard in NFL history. [1]Even February 29th has a couple of representatives, led by Dick Wood and his 7,153 passing yards.

But wait, there’s more: If we drop the threshold to 3,500 passing yards, we get to include Patrick Ramsey and Anthony Wright. Those guys may not impress you, but consider that only 310 players have thrown for 3,500 yards. That means dozens of days have zero quarterbacks with 3,500 yards, so slotting in Ramsey and Wright as QB5 and QB6 on your birthday dream team is pretty damn good. February 13th, for example, has Jim Youel as its top passer, and he only collected 849 yards. Yesterday’s number two slot goes to the greatest receiver of all-time to ever play with Aaron Brooks (106 yards), outpacing Drew Henson and his 98 career yards. Clearly, passing yardage is for lovers. [2]Long-time readers will recognize that this post is a blatant ripoff of Doug’s classic Passing Yardage is for Lovers, published five years ago to the day.
[continue reading…]

References

References
1 Even February 29th has a couple of representatives, led by Dick Wood and his 7,153 passing yards.
2 Long-time readers will recognize that this post is a blatant ripoff of Doug’s classic Passing Yardage is for Lovers, published five years ago to the day.
{ 17 comments }

ravIn 2009, Doug produced a Super Bowl Squares post, itself a revival of his old Sabernomics post eight years ago. In those posts, Doug derived the probability of winning a squares pool for each given square (or set of numbers). Unsurprisingly, he found that those lucky souls holding the ‘7/0’ squares were in good shape, while those left holding the ‘2/2’ ticket were screwed. You can download the Sports-Reference Super Bowl Squares app here, which is free, and should help you taunt your guests at your Super Bowl party.

Let’s say that this year, your Super Bowl squares pool allows you to either pick or trade squares: if that’s the case, this post is for you. I looked at every regular season and postseason game from the last ten years. The table below shows the likelihood of each score after each quarter, along with three final columns that show the expected value of a $100 prize pool under three different payout systems. The “10/” column shows the payout in a pool where 10% of the prize money is given out after each of the first three quarters and 70% after the end of the game; the next column is for pools that give out 12.5% of the pool after the first and third quarters, 25% at halftime, and 50% for the score at the end of the game. The final column is for pools that give out 25% of the pot after each quarter — since I think that is the most common pool structure, I’ve sorted the table by that column, but you can sort by any column you like.
[continue reading…]

{ 7 comments }

I’ve been on a major QB kick lately, and there’s no reason to stop now. Today, I want to look at a method that might tease out a quarterback’s “true talent” better than if we simply use his raw stats from the season.

Three years ago, our colleague Jason Lisk had a post on the old PFR Blog about which rate stats stay consistent when a QB changes teams. Basically, he grabbed QBs who were still in their primes and changed teams, looking at how their key rate stats correlated from one year to the next. Here’s what Jason found:

[…]I looked at the correlation coefficient for our group of 48 passers, for the year N advanced passing score compared to the year N+1 advanced passing score in each category. This should tell us whether the passers who were good in a performance area (or bad) tended to be the ones who remained good in that performance area the following season, even with the uncertainty of team changes (some positive, some negative for the quarterback).

Sack Percentage:  0.31
Completion Percentage: 0.25
Yards Per Attempt:  0.20
Touchdown Percentage: 0.12
Interception Percentage: 0.10

What do those correlations mean, exactly? Well, take sack percentage as an example. In general, a correlation of 0.31 means you can expect 31% of a QB’s difference from the mean to be repeated next year when he changes teams. In other words, you have to regress the QB’s sack rate 69% towards the mean to get the true rate that “belongs” to him. If the average sack rate is 6.1%, and a QB has a rate of 4.0% (like, say, Drew Brees this year), his “true” sack rate is probably something like 5.4% — 31% of the distance between .061 and .040.

The same concept applies to the other stats listed above. Tony Romo’s observed 66.7% completion percentage is really more like 62.5% after regressing to the mean, and so forth. Do that for every QB who had a reasonable number of attempts this year, and you get these rate stats:

PlayerTmGGSAttA-Sk%A-Cmp%A-YPAA-TD%A-INT%R-Sk%R-Cmp%R-YPAR-TD%R-INT%
Matthew StaffordDET14146294.359.56.82.72.45.560.77.04.02.6
Drew BreesNOR14145744.062.07.66.33.15.461.47.24.52.7
Tony RomoDAL14145685.366.77.53.92.85.962.57.24.22.7
Andrew LuckIND14135646.254.67.13.53.26.159.57.14.12.7
Carson PalmerOAK14145624.460.97.13.92.55.661.17.14.22.6
Tom BradyNWE14145603.963.47.65.41.15.461.77.24.42.5
Matt RyanATL14145394.468.57.85.02.65.663.07.24.32.7
Peyton ManningDEN14145113.967.97.96.12.05.462.87.24.42.6
Brandon WeedenCLE14144985.057.26.62.83.45.760.27.04.02.7
Philip RiversSDG14144888.164.36.74.53.16.762.07.04.22.7
Joe FlaccoBAL14144876.559.17.14.12.16.260.77.14.22.6
Eli ManningNYG14144873.060.47.44.13.15.161.07.14.22.7
Sam BradfordSTL14144826.860.26.83.72.36.360.97.04.22.6
Matt SchaubHOU14134764.064.77.54.62.15.562.07.24.32.6
Aaron RodgersGNB14144748.766.77.66.81.76.962.57.24.52.6
Andy DaltonCIN14144727.562.57.05.53.06.561.57.14.42.7
Josh FreemanTAM14144694.354.87.45.32.65.559.67.14.32.7
Ryan FitzpatrickBUF14134445.961.76.65.03.46.061.37.04.32.7
Christian PonderMIN14144256.663.15.93.32.86.261.66.94.12.7
Ryan TannehillMIA14144245.858.76.92.42.86.060.57.04.02.7
Cam NewtonCAR14144237.258.28.24.32.46.460.47.34.22.6
Mark SanchezNYJ14144187.354.86.43.14.16.559.66.94.12.8
Ben RoethlisbergerPIT11113985.764.17.35.51.56.061.97.14.42.6
Jay CutlerCHI13133778.559.77.04.53.76.860.87.14.22.8
Russell WilsonSEA14143536.962.97.65.92.56.361.67.24.42.7
Robert Griffin IIIWAS13133517.466.48.35.11.16.562.57.34.32.5
Michael VickPHI993167.958.56.93.52.86.660.57.04.12.7
Blaine GabbertJAX10102787.358.36.03.22.26.560.46.94.12.6
Matt CasselKAN982776.458.16.52.24.36.260.47.04.02.8
Jake LockerTEN992695.657.67.03.33.35.960.37.14.12.7
Matt HasselbeckTEN852216.062.46.23.22.36.161.56.94.12.6
Nick FolesPHI652176.559.46.22.31.86.260.76.94.02.6
Alex SmithSFO9921710.070.08.06.02.37.363.47.34.42.6
Chad HenneJAX842168.551.96.73.72.36.858.87.04.22.6
John SkeltonARI762016.954.25.61.04.56.459.46.83.82.8
Kevin KolbARI6518312.959.66.44.41.68.260.86.94.22.6
Brady QuinnKAN861599.159.75.81.33.87.060.86.83.92.8
Colin KaepernickSFO1151548.365.68.44.51.36.862.37.34.32.5
Ryan LindleyARI631416.651.14.30.04.36.358.66.53.72.8

(“A-” before a stat means the actual observed rate; “R-” means the regressed rate.)

Now we just need to reconstruct the player’s raw passing line as though he posted those rate stats instead of his actual rates. Cmp%, YPA, TD%, and INT% are easy (just multiply by attempts), and Sack% can be derived via simple algebra:

Sacks_new = (-reg_sk% * Attempts) / (reg_sk% – 1)

(Sack yards can be assumed by multiplying raw sack yards per sack by the new sack total.)

Finally, we plug the new totals into the Adjusted Net Yards Per Attempt formula, and we have a QB stat that is sort of like baseball’s Fielding Independent Pitching (FIP), which also seeks to reduce the noise and teammate interactions in a pitcher’s ERA by reducing his performance to only those elements he has control over — strikeouts, walks, and home runs.

Here are the 2012 leaders in QB-FIP (along with their regressed totals):

RkPlayerAgeTmGGSCmpAttYdsTDIntSkSkYdsQB-FIP
1Peyton Manning36DEN141432151136972313291916.22
2Tom Brady35NWE141434656040272414322146.20
3Robert Griffin III22WAS13132193512568159241666.15
4Colin Kaepernick25SFO1159615411307411766.11
5Ben Roethlisberger30PIT111124639828361710251416.11
6Matt Ryan27ATL141433953938932314322256.11
7Eli Manning31NYG141429748734762013261656.09
8Drew Brees33NOR141435257441182616332376.08
9Josh Freeman24TAM141427946933502012271816.08
10Aaron Rodgers29GNB141429647434022112351976.06
11Cam Newton23CAR141425642330861811292036.05
12Russell Wilson24SEA14142173532539169241486.05
13Alex Smith28SFO99138217157510617976.04
14Matt Schaub31HOU141329547634072012272286.01
15Tony Romo32DAL141435556840712415352555.97
16Andy Dalton25CIN141429047233362113331765.94
17Joe Flacco27BAL141429548734532013322095.93
18Carson Palmer33OAK141434356239802315332545.92
19Ryan Fitzpatrick30BUF141327244431011912291515.89
20Andrew Luck23IND141333656439902315372305.89
21Matthew Stafford24DET141438262944132517372565.88
22Jake Locker24TEN991622691900117171085.88
23Michael Vick32PHI991913162223138221245.84
24Sam Bradford25STL141429448233802013322165.82
25Brandon Weeden29CLE141430049834772014301985.80
26Ryan Tannehill24MIA141425742429871711272055.78
27Chad Henne27JAX8412721615119616945.78
28Philip Rivers31SDG141430248834222113352215.77
29Matt Cassel30KAN98167277192811818975.75
30Jay Cutler29CHI131322937726611610281875.74
31Christian Ponder24MIN141426242529121711281645.70
32Nick Foles23PHI65132217150096141025.70
33Matt Hasselbeck37TEN85136221152596141055.70
34Mark Sanchez26NYJ141424941829031712291785.68
35Blaine Gabbert23JAX10101682781907117191385.61
36Kevin Kolb28ARI6511118312708516965.61
37Brady Quinn28KAN869715910866412705.50
38John Skelton24ARI7611920113658614895.46
39Ryan Lindley23ARI6383141921549725.15
Lg Average5.92
{ 3 comments }

These guys are pretty good.

These guys are pretty good.

After posting about SRS-style quarterback ratings on Monday, I was thinking about other things we can do with game-by-game data like that. In his QBGOAT series, Chase likes to compare QBs to the league average, which makes a lot of sense for all-time ratings — you want to reward guys who are at least above-average in a ranking like that. However, if we want seasonal value, perhaps average is too high a baseline.

Over at Football Outsiders, Aaron Schatz has always compared to “replacement level”, borrowing a concept from baseball. I like that approach, but replacement level can be hard to empirically determine. So for the purposes of this post, I wanted to come up with a quick-and-dirty baseline to which we can compare QBs.

To that end, I looked at all players who were not their team’s primary passer in each game since 2010. Weighted by recency and the number of dropbacks by each passer, they performed at roughly a 4.4 Adjusted Net Yards Per Attempt level. This is not necessarily the replacement level, but it does seem to be the “bench level” — i.e., the ANYPA you could expect from a backup-caliber QB across the league.

Using 4.4 ANYPA as the baseline, we get the following values for 2012:

QuarterbackQBYAB
Tom Brady1888.1
Peyton Manning1708.2
Matt Ryan1453.4
Drew Brees1441.8
Aaron Rodgers1337.4
Robert Griffin III1226.6
Matt Schaub1205.1
Josh Freeman1140.1
Cam Newton1128.2
Tony Romo1120.2
Ben Roethlisberger1082.8
Carson Palmer1011.9
Eli Manning1002.9
Joe Flacco914.8
Russell Wilson890.5
Matthew Stafford834.1
Andy Dalton756.9
Andrew Luck691.6
Sam Bradford616.3
Alex Smith558.5
Colin Kaepernick506.5
Ryan Fitzpatrick481.1
Philip Rivers447.7
Ryan Tannehill409.6
Brandon Weeden320.4
Michael Vick317.5
Jake Locker316.9
Jay Cutler293.8
Chad Henne217.4
Kirk Cousins156.8
Nick Foles152.5
Shaun Hill151.9
Matt Hasselbeck134.0
Kevin Kolb121.4
Blaine Gabbert92.2
Christian Ponder91.0
Mohamed Sanu87.7
Kyle Orton62.8
Matt Moore52.5
Derek Anderson30.1
Matt Flynn23.7
Dan Orlovsky17.6
Greg McElroy11.4
Tyrod Taylor9.2
Rusty Smith9.1
Chase Daniel5.6
Tyler Thigpen2.7
Graham Harrell-1.6
Terrelle Pryor-4.4
Matt Leinart-5.1
David Carr-5.9
Tim Tebow-6.3
Mark Sanchez-13.3
Charlie Batch-17.8
Kellen Clemens-22.4
Ryan Mallett-45.9
Byron Leftwich-46.6
Matt Cassel-47.7
Brad Smith-50.0
T.J. Yates-55.1
Jason Campbell-88.4
Brady Quinn-146.4
John Skelton-309.2
Ryan Lindley-382.0

If we weigh each game by how recent the results took place, we get this list:

QuarterbackWgtd QBYAB
Tom Brady1527.6
Drew Brees1205.4
Peyton Manning1202.0
Matt Ryan1129.8
Aaron Rodgers1109.4
Tony Romo961.1
Cam Newton936.6
Matt Schaub900.3
Robert Griffin III869.5
Eli Manning795.5
Ben Roethlisberger793.9
Josh Freeman790.3
Carson Palmer760.4
Russell Wilson722.9
Matthew Stafford687.5
Joe Flacco666.3
Andy Dalton520.4
Andrew Luck479.9
Sam Bradford459.9
Colin Kaepernick443.0
Alex Smith399.3
Philip Rivers384.9
Ryan Fitzpatrick324.0
Ryan Tannehill313.1
Brandon Weeden266.5
Michael Vick249.9
Jay Cutler236.8
Jake Locker192.4
Chad Henne178.7
Kirk Cousins158.7
Nick Foles150.5
Matt Hasselbeck133.1
Shaun Hill84.4
Kevin Kolb70.6
Matt Moore64.8
Kyle Orton59.8
Mohamed Sanu47.4
Matt Flynn47.4
Blaine Gabbert39.9
Dan Orlovsky26.3
Tim Tebow16.3
Derek Anderson16.3
Greg McElroy10.3
Chase Daniel5.1
Rusty Smith4.8
Tyrod Taylor4.0
Tyler Thigpen-0.8
Graham Harrell-1.4
Matt Leinart-2.8
David Carr-3.3
Terrelle Pryor-4.4
Charlie Batch-7.6
Kellen Clemens-14.0
Matt Cassel-24.2
T.J. Yates-29.7
Brad Smith-33.2
Byron Leftwich-38.3
Christian Ponder-39.4
Ryan Mallett-44.6
Jason Campbell-51.1
Mark Sanchez-91.0
Brady Quinn-113.4
John Skelton-263.6
Ryan Lindley-340.5

This kind of thing isn’t exactly the most advanced stat in the world, but it’s pretty good if you want to sort QBs into general groups based on how good they are (the assumption being that a player who never plays is implicitly a bench-level player by definition).

{ 2 comments }

My college football playoff system

We need a playoff system to see more games between great teams like Alabama and LSU.

If Friday (or sometimes Thursday) is rant day at Football Perspective, then perhaps the first Tuesday in December can be fantasy day. Since everyone else does it, allow me to describe to you my preferred college playoff system.

  • A modified 8-team playoff that’s actually a 10-team playoff with a four-team “play-in” round. A playoff system should not undermine the regular season, and my system places significant emphasis on success in the regular season: the most-accomplished teams get to clear the lowest hurdles due to byes, home-field, and weaker opponents.
  • Notre Dame and the conference champions from the SEC, B12, P12, B10, and ACC earn automatic berths to the playoffs but only if they finish in the top 14.
  • A selection committee (or a BCS-style ranking system) is used to select the remaining teams. There is a limit of 4 teams per conference. The “play-in” round and the first round of the playoffs are held at the higher seed’s location the week after the conference championship games (i.e., next weekend).

Therefore, Alabama (#2 in the BCS), Kansas State (#5), Stanford (#6), and Florida State (#12) would be guaranteed spots by virtue of being conference champions. Notre Dame (#1) is also guaranteed a slot.

That leaves five at-large selections:

— Florida (#3)
— Oregon (#4)
— two of Georgia (#7), LSU (#8), Texas A&M (#9), and South Carolina (#10)
— Oklahoma (#11)

Basically the only teams that could complain about this system are the leftover SEC teams, but I’m okay with that since they would be considered the 5th and 6th best teams from their conference. I suppose 12-1 MAC Champion Northern Illinois might be bothered, but they lost to Iowa and had a cupcake schedule. Had Nebraska defeated Wisconsin, or had Ohio State been eligible, Oklahoma or a 4th SEC team would have been left out.

For purposes of this post, I will say Georgia and A&M would be the committee’s picks.

Here’s how the playoff system would work. The three highest-ranked conference champions (Alabama, K-State, Stanford) get byes along with the next three highest-ranked teams — Notre Dame, Florida, and Oregon. The other four teams play at the site of the higher ranked team [1]I would have the committee involved in this step of the process as well and instruct them to avoid rematches if possible. This year it is not an issue. this Saturday (December 8th). So we would have:

Play-in round

#13 Florida State @ #7 Georgia
#11 Oklahoma @ #9 Texas A&M

— Had UGA beaten Alabama, the Bulldogs would have earned a bye followed by a home playoff game. By losing, they have to play a play-in game and then win a road playoff game. So the SEC Championship was a critical game — and there’s a good chance the committee would have simply selected LSU instead because of the loss.
— Had Florida State beaten Florida, they would have had likely received a bye and possibly a home playoff game. Now they have to win two road games. Of course, the ACC Championship Game, which no one cared about on Saturday night, would have been significantly more relevant.
— Ditto the Big 10 Championship Game, well, at least for the first half. Meanwhile, Oklahoma would have known they would have needed to run the table to get in after losing to Notre Dame. Instead of the season essentially being meaningless, think how much more exciting the Sooners last-second wins over West Virginia and Oklahoma State would have been?
— And of course, think how much more exciting the rest of the season for A&M and Johnny Manziel would have been if they had a chance to make the playoffs?

First round of the playoffs:

The three conference winners and the top-seeded at large receive home playoff games, which would be played on Saturday, December 15th:

#1 Notre Dame hosts the worst remaining seed (either FSU or the A&M/Oklahoma winner)
#2 Alabama hosts the 2nd worst seed remaining (Georgia or the A&M/Oklahoma winner).
#5 Kansas State hosts the 3rd worst seed remaining (Florida)
#6 Stanford hosts the 4th worst seed remaining (Oregon)

[Note: If you want to have the committee switch the bottom two games so that Stanford does not “have to beat Oregon again” I am fine with that. KSU-Oregon and Stanford-Florida are just as acceptable to me, and I am willing to do the same to avoid a UGA or A&M rematch with Alabama if events unfolded that way.]

Notre Dame and Alabama had the best two regular seasons, and look at their rewards: they get a bye, they get a home game, and they play a team coming off a play-in game.

KSU and Stanford both won their conferences, so they are rewarded with byes and home playoff games. Florida State won their conference but their lackluster regular season did not merit the same reward. Wisconsin won the Big 10 and got nothing. So the regular season remains vitally important. Oregon and Florida had great regular seasons, and thanks to a second bite at the apple (which is instead only reserved for Alabama this year), their seasons weren’t meaningless after one loss. And the lowest two seeds played their win into the playoff.

This playoff format makes the regular season much more meaningful for many more teams, while only slightly taking away from the value of certain games (admittedly, the Kansas State and Oregon upsets on November 17th would have been less meaningful in this format; I’m okay with that — the perfect should not be the enemy of the good.)

The Final Four

We now break until the first weekend of January. At this point, we have four very deserving teams. They would play in a four-team playoff, rotated among the bowl sites, as currently envisioned. We might see Notre Dame and Oregon in the Rose Bowl and Alabama and Kansas State in the Sugar Bowl. Or perhaps A&M and Oregon in the Cotton Bowl and Florida and Notre Dame in the Orange Bowl. Who knows. The good news is that unless there are 11 deserving teams, everyone gets a shot (and even if all 5 autobids finish in the top 14, 4 non-conference champs are still eligible; no worthy undefeated team should get left out in this system).

References

References
1 I would have the committee involved in this step of the process as well and instruct them to avoid rematches if possible. This year it is not an issue.
{ 14 comments }

Splits Happen

[Five years ago, my friend and Pro-Football-Reference.com founder Doug Drinen wrote the predecessor to todaay’s article, but refused to go with this title. The principles remain fundamental to advanced analysis of any sport, so today I’ll be revisiting them with current examples.]

Our brains are really good at making connections and finding patterns. In The Believing Brain, Michael Shermer argued that we’ve made it to where we are today precisely because of our ability to do just that:

A human ancestor hears a rustle in the grass. Is it the wind or a lion? If he assumes it’s the wind and the rustling turns out to be a lion, then he’s not an ancestor anymore. Since early man had only a split second to make such decisions, Mr. Shermer says, we are descendants of ancestors whose “default position is to assume that all patterns are real; that is, assume that all rustles in the grass are dangerous predators and not the wind.”

Reggie Wayne dominates when seeing blue.


Of course, not all patterns are real, and sometimes that rustle is just the sound of the wind. Just because you see a surprising split — maybe a player dominated the second half of the season after a slow start — doesn’t mean that the “trend” is real. For example, here are some splits from the 2011 season:

Reggie Wayne was much better against teams that wear the color blue than when facing teams that have no blue in their uniforms. Here is his weekly production (the last column represents his fantasy points) when playing against teams that do not have blue as a color in their uniform:

WeekOppRecYdTDFP
17jax873015.3
5kan477011.7
6cin558010.8
2cle466010.6
4tam45909.9
14rav44108.1
9atl43007.0
7nor33606.6
3pit32405.4
10jax31304.3
Avg4.247.709.0

[continue reading…]

{ 28 comments }