≡ Menu

Brad Oremland is a longtime commenter and a fellow football historian. Brad is also a senior NFL writer at Sports Central. There are few who have given as much thought to the history of quarterbacks and quarterback ranking systems as Brad has over the years. What follows is Brad’s latest work on the greatest quarterbacks of all time.

Part I: Pre-Modern Era
Part II: 49-101
Part III: 40-48
Part IV: 31-39
Part V: 21-30
Part VI: 11-20
Part VII: 6-10
Part VIII: 1-5


This week, I’m profiling the players who rank 6-10 on my list, counting down toward number one. Please note: at this point, we’re talking about the best of the best QBs. When I mention a player’s weaknesses, I’m not trying to insult him, just explaining why he doesn’t rate even higher.

10. Roger Staubach
Dallas Cowboys, 1969-79
22,700 yards, 153 TD, 109 INT, 83.4 rating

Roger Staubach was the best quarterback of the 1970s. He led all passers in rating and in TD/INT differential (+45), the latter nearly doubling a second-place tie between Fran Tarkenton and Kenny Anderson (+24). Despite playing only eight full seasons, Staubach also ranked among the top three QBs of the ’70s in both passing yards and rushing yards. He was the first-team QB on the NFL’s All-1970s Team.

Staubach’s statistics are exceptional. He led the league in passer rating four times, and retired with the highest rating in NFL history. Staubach was distinguished by his combination of short-range and downfield accuracy. Throwing underneath, he hit the receiver in stride, but he was also a great downfield passer. A dangerous dual-threat, Staubach was also known for his running, an ability that earned him the nickname “Roger the Dodger.” Staubach rushed for 2,204 yards and 19 TDs, ranking among the top 10 rushing QBs every full season of his career. [continue reading…]

{ 186 comments }

On February 3rd, 2013, the Baltimore Ravens defeated the San Francisco 49ers in Super Bowl XLVII. The next day, I compared Jim Harbaugh’s 49ers to Vince Lombardi’s Packers, who also lost their first appearance in the NFL title game. San Francisco, which made it to the NFC Championship Game the year prior and would again the following season, seemed set up to emerge as one of the dominant teams of the ’10s.

But the amount of roster turnover experienced by the 49ers since February 3rd, 2013, is incredible. Just 2.5 years later, only seven of the 22 starters from that day are still on the San Francisco roster. And even that probably overstates things, as Colin Kaepernick’s career has taken a downward spiral, Vernon Davis may be on his last legs, NaVorro Bowman is a question mark after a brutal knee injury, and Aldon Smith makes more headlines these days off the football field than on it. Oh, and Ahmad Brooks may lose his starting job to Aaron Lynch. [continue reading…]

{ 3 comments }

As regular readers know, PFR’s Approximate Value statistic uses Offensive Points Per Estimated Drive (OPPED) as its base statistic. Given the discussion yesterday regarding estimates drives and scoring, I thought it would be useful to provide a list of the single-season leaders since 1950 in this metric.

Let’s use the 2007 Patriots as an example. For modern teams, we have the data available on how many drives each team had, but for historical teams, it’s not so easy. There are two ways we can measure drives for all teams. One is to measure the end of drives. For example, the ’07 Patriots had:

  • 50 passing touchdowns;
  • 9 interceptions;
  • 17 rushing touchdowns;
  • 24 field goal attempts;
  • 45 punts;
  • 6 fumbles lost; and
  • 0 safeties (i.e., the offense was never sacked in the end zone)

That gives us a total of 151 estimated drives. What we’re missing here are drives that end when the clock runs out and turnovers on downs. Unfortunately, that data is simply not out there historically, although it’s probably not all that important (and, at least with respect to the former, those drives arguably should be excluded, anyway).

We can also measure the start of drives.  The ’07 Patriots:

  • Played 16 games, which means 16 times where the team received the ball at the start of each half;
  • Recorded 0 safeties recorded on defense (which would lead to a possession);
  • Allowed 23 passing touchdowns;
  • Forced 19 interceptions;
  • Allowed 7 rushing touchdowns;
  • Faced 14 opponent field goal attempts;
  • Forced 76 punts;
  • Forced and recovered 12 fumbles.
  • In addition, New England also had 3 pick sixes and returned 3 fumbles for touchdowns.  as a result, we need to subtract 6 from our total, since those turnovers did not lead to drives for the offense.

This method of estimating drives isn’t perfect, either, but if we average the two results, hopefully we get something pretty close.  New England’s offense had 161 estimated drives by this metric, giving them an averaged of 156 estimated offensive drives. [1]Note that the Patriots went 15/21 on 4th down attempts that year. FWIW, Football Outsiders has New England with 158 offensive drives.

What about estimated points? That one is relatively simple:

  • Award 7 points for each rushing touchdown or passing touchdown;
  • Award 3 points for each made field goal

There are flaws here, well, but this is probably the best we can do.  By this method, New England had 532 estimated offensive points, and 3.41 OPPED.  That is the most of any team since 1950.  The full list:

RkTeamYrLgEst Drive (End)Est Drive (St)Est OptsOPPED
1New England Patriots2007NFL1511615323.41
2New Orleans Saints2011NFL1621675183.15
3Green Bay Packers2011NFL1621735133.06
4Minnesota Vikings1998NFL1681685113.04
5Indianapolis Colts2004NFL1581704872.97
6Denver Broncos2013NFL1901995722.94
7New England Patriots2010NFL1491684582.89
8St. Louis Rams2000NFL1701875132.87
9San Diego Chargers1982NFL991022862.85
10New England Patriots2012NFL1721815002.83
11Green Bay Packers2014NFL1521634452.83
12New England Patriots2011NFL1661764832.82
13Miami Dolphins1984NFL1651874962.82
14Indianapolis Colts2007NFL1511554262.78
15San Francisco 49ers1994NFL1601754652.78
16Indianapolis Colts2006NFL1441594142.73
17Kansas City Chiefs2004NFL1631764572.7
18San Francisco 49ers1993NFL1551684332.68
19St. Louis Rams2001NFL1731774682.67
20Indianapolis Colts2005NFL1461634122.67
21Dallas Cowboys2014NFL1661694462.66
22San Diego Chargers2009NFL1501644182.66
23Denver Broncos1998NFL1741874752.63
24San Francisco 49ers1992NFL1491644112.63
25San Diego Chargers2006NFL1711874702.63
26Dallas Cowboys1995NFL1541594102.62
27New Orleans Saints2008NFL1611794442.61
28New England Patriots2014NFL1641714342.59
29Green Bay Packers1962NFL1501563952.58
30San Diego Chargers2008NFL1531654102.58
31Kansas City Chiefs2002NFL1601844402.56
32Washington Redskins1983NFL1962055122.55
33Washington Redskins1991NFL1721814502.55
34Houston Oilers1961AFL1871974892.55
35San Diego Chargers2004NFL1651744312.54
36New Orleans Saints2009NFL1701854512.54
37Houston Oilers1990NFL1491613922.53
38San Francisco 49ers1984NFL1731814462.52
39St. Louis Rams1999NFL1741804452.51
40San Diego Chargers2010NFL1661664172.51
41Minnesota Vikings2009NFL1721864492.51
42Indianapolis Colts2003NFL1661754262.5
43Denver Broncos2014NFL1731934572.5
44New England Patriots2008NFL1531694022.5
45New England Patriots2004NFL1601624012.49
46Jacksonville Jaguars2007NFL1461643852.48
47New England Patriots2009NFL1571714072.48
48Dallas Cowboys2007NFL1681774282.48
49Cincinnati Bengals2005NFL1601744132.47
50San Francisco 49ers1989NFL1671814302.47
51New York Giants2012NFL1621684072.47
52Green Bay Packers2009NFL1721784312.46
53San Diego Chargers2011NFL1531603852.46
54Oakland Raiders2002NFL1581734072.46
55New Orleans Saints2013NFL1611774152.46
56Cincinnati Bengals1988NFL1671764212.45
57San Francisco 49ers1987NFL1721814332.45
58San Diego Chargers1981NFL1892014772.45
59Buffalo Bills1990NFL1561683962.44
60San Diego Chargers2013NFL1551643892.44
61Kansas City Chiefs2003NFL1761854402.44
62Atlanta Falcons2012NFL1631714072.44
63San Francisco 49ers1998NFL1872024742.44
64New York Giants2008NFL1581724022.44
65Buffalo Bills1991NFL1731884392.43
66Minnesota Vikings2004NFL1481673832.43
67Indianapolis Colts2009NFL1581703982.43
68San Francisco 49ers1953NFL1461563662.42
69Green Bay Packers1961NFL1471533632.42
70Miami Dolphins1986NFL1701834272.42
71Seattle Seahawks2005NFL1761824322.41
72Detroit Lions1995NFL1681864272.41
73Baltimore Colts1976NFL1641764102.41
74Los Angeles Rams1950NFL1801804342.41
75New Orleans Saints2014NFL1591734002.41
76Minnesota Vikings2000NFL1601683952.41
77San Francisco 49ers1995NFL1611683962.41
78Baltimore Colts1964NFL1641764082.4
79Indianapolis Colts2014NFL1831904472.4
80Kansas City Chiefs1966AFL1711774162.39
81New Orleans Saints2012NFL1741834252.38
82Oakland Raiders2000NFL1721874262.37
83Buffalo Bills1975NFL1651774052.37
84Miami Dolphins1972NFL1521633732.37
85Indianapolis Colts2008NFL1361523402.36
86Los Angeles Rams1951NFL1611573752.36
87Dallas Cowboys1966NFL1711754082.36
88Carolina Panthers2011NFL1641713952.36
89Cleveland Browns1966NFL1561703842.36
90Pittsburgh Steelers2014NFL1581723882.35
91Indianapolis Colts2010NFL1681734002.35
92Denver Broncos2000NFL1701894212.35
92Denver Broncos2012NFL1741854212.35
94Houston Texans2010NFL1551773892.34
95Green Bay Packers2012NFL1691784062.34
96Baltimore Colts1958NFL1481643652.34
97New York Giants1963NFL1731794112.34
98San Diego Chargers2005NFL1731754062.33
99Washington Redskins2012NFL1601783942.33
100San Francisco 49ers2001NFL1621733902.33
101Green Bay Packers1995NFL1641773962.32
102Detroit Lions1972NFL1361523332.31
103Chicago Bears2013NFL1671733932.31
104Cincinnati Bengals1982NFL91972172.31
105Baltimore Ravens2014NFL1571803882.3
106Seattle Seahawks2012NFL1541703732.3
106New York Giants1967NFL1561683732.3
108New York Jets1982NFL1001052362.3
109Indianapolis Colts2000NFL1691824042.3
110Cincinnati Bengals1985NFL1771964292.3
111New England Patriots2013NFL1821854222.3
112Cleveland Browns1960NFL1321433162.3
113Philadelphia Eagles2013NFL1811904262.3
114Carolina Panthers1999NFL1751834112.3
115Seattle Seahawks2014NFL1541713732.3
116Miami Dolphins1995NFL1681713892.29
117Denver Broncos1997NFL1651833992.29
118Cleveland Browns1964NFL1501643602.29
119Dallas Texans1962AFL1621803922.29
120Green Bay Packers2007NFL1681763942.29
121Dallas Cowboys2006NFL1631773892.29
122Denver Broncos2008NFL1511603552.28
123Denver Broncos1995NFL1631703802.28
124Baltimore Colts1959NFL1401583402.28
125Chicago Bears1995NFL1591723772.28
126Green Bay Packers2003NFL1791894192.28
127Baltimore Colts1968NFL1551633622.28
128Arizona Cardinals2008NFL1631803902.27
129Carolina Panthers2008NFL1711803992.27
129Dallas Cowboys2013NFL1721793992.27
131San Francisco 49ers1965NFL1691723872.27
132Minnesota Vikings2003NFL1601783832.27
132Cleveland Browns1968NFL1641743832.27
134Baltimore Colts1967NFL1541653612.26
135Miami Dolphins1975NFL1531603542.26
136Miami Dolphins1994NFL1671703802.26
137Miami Dolphins1985NFL1771924162.25
138San Diego Chargers1963AFL1721723872.25
138New Orleans Saints2010NFL1611673692.25
140Pittsburgh Steelers2007NFL1581713702.25
141Kansas City Chiefs2005NFL1641763822.25
142Green Bay Packers2013NFL1691813932.25
143Green Bay Packers2004NFL1681773872.24
144Atlanta Falcons2010NFL1651723782.24
145Green Bay Packers1996NFL1681883992.24
146Detroit Lions2011NFL1851924222.24
147Chicago Bears1965NFL1621743762.24
148San Francisco 49ers1991NFL1631753782.24
149Dallas Cowboys1968NFL1681723802.24
150New York Jets1998NFL1691813902.23
151San Francisco 49ers2000NFL1581783742.23
152Philadelphia Eagles2010NFL1821944182.22
153Indianapolis Colts1999NFL1691813892.22
154Cincinnati Bengals1981NFL1791894092.22
155Dallas Cowboys1980NFL1832004252.22
156Washington Redskins1999NFL1771924092.22
157St. Louis Rams2003NFL1831884112.22
158Atlanta Falcons2011NFL1651803822.21
159Los Angeles Rams1973NFL1581773702.21
160Atlanta Falcons2008NFL1561703602.21
161New York Jets2008NFL1611713662.2
162San Diego Chargers1985NFL2022094532.2
163Dallas Cowboys1993NFL1541693562.2
164New York Giants1962NFL1651793792.2
165New Orleans Saints1987NFL1771874002.2
166New Orleans Saints2006NFL1721843912.2
167Dallas Cowboys1971NFL1711783832.19
168Jacksonville Jaguars1997NFL1621783732.19
168Dallas Cowboys1992NFL1631773732.19
170Cincinnati Bengals1989NFL1671843852.19
170Denver Broncos1996NFL1711803852.19
172Oakland Raiders1972NFL1561653522.19
173Atlanta Falcons1998NFL1731843912.19
174Seattle Seahawks2013NFL1711823862.19
175San Francisco 49ers2012NFL1661703672.18
176Dallas Cowboys1994NFL1691803812.18
177Denver Broncos2002NFL1601813722.18
178New York Jets1972NFL1581673542.18
179Kansas City Chiefs1967AFL1691723712.18
180Denver Broncos2005NFL1641793732.17
181Tennessee Titans2003NFL1711833832.16
182Buffalo Bills1998NFL1711873862.16
183Miami Dolphins2014NFL1581763602.16
184Cleveland Browns1987NFL1631753642.15
185Chicago Bears1956NFL1421583232.15
186Cincinnati Bengals1986NFL1771903942.15
187San Francisco 49ers1983NFL1711863832.15
188Minnesota Vikings2002NFL1781803842.15
189Los Angeles Rams1989NFL1821964052.14
189New England Patriots2006NFL1681823752.14
189Green Bay Packers2010NFL1631733602.14
192Dallas Cowboys1973NFL1601753582.14
193New York Giants2009NFL1691823752.14
194Atlanta Falcons2002NFL1751843832.13
195Cleveland Browns1980NFL1661753632.13
196Pittsburgh Steelers2005NFL1631813662.13
197Philadelphia Eagles2004NFL1691843752.12
198Seattle Seahawks1987NFL1631753592.12
198Baltimore Colts1965NFL1641743592.12
200Atlanta Falcons2014NFL1621773602.12

References

References
1 Note that the Patriots went 15/21 on 4th down attempts that year. FWIW, Football Outsiders has New England with 158 offensive drives.
{ 13 comments }

The 1972 Detroit Lions Offense

There are lots of ways to measure a team’s offensive production.  But if a drive does not end in a punt or a turnover, it’s probably a pretty good drive.  Last year, the Packers had just 64 possessions end in a punt (51) or turnover (6 interceptions, 7 fumbles lost).  The Raiders led the way with 138 Bad Drives — defined as possessions that ended in a punt or turnover — so this metric passes the sniff test.

Here’s some more positive evidence for this statistic: Since 1970, the team with the fewest Bad Drives was the 2007 Patriots at 60. [1]And excluding 1982.  That New England team was followed by the ’14 Packers, the ’11 Saints (66), the ’06 Colts (67), the ’10 Patriots (68), the ’72 Lions (68), the ’11 Packers (69), and the ’09 Chargers (69. The Colts from ’04 to ’08 were extremely consistent and extremely strong in this metric, with 71 Bad Drives in ’04, 71 in ’05, ’67 in ’06, 71 in ’07, and 70 in ’08. [continue reading…]

References

References
1 And excluding 1982.
{ 15 comments }

On Monday, I looked at the Defensive Player of the Year voting in every year from 2000 to 2006. Today, the last eight years.

2007: Bob Sanders, Indianapolis Colts

AP voting: Sanders (31), Patrick Kerney (4) (Seattle), Albert Haynesworth (4) (Titans), Antonio Cromartie (3) (Chargers), DeMarcus Ware (3) (Cowboys), Mike Vrabel (2) (Patriots), James Harrison (1) (Steelers), Ronde Barber (1) (Buccaneers), Patrick Willis (1) (49ers), Mario Williams (1) (Texans)

Sanders picked up 62% of the vote, yet nine other names split the remaining ballots.  It is weird to think of a player like Kerney as being the runner up for DPOY. But in his first year in Seattle, Kerney had 14.5 sacks, forced five fumbles, and recorded an interception, good enough to get him the KC101 NFC Defensive Player of the Year award.

But Sanders was the clear choice for DPOY. Only a couple of random places (like the Kansas City Star, which went for Ware, the New York Daily News (Cromartie), or the Miami Herald, which went for Vrabel because LBWINZ) didn’t select Sanders as the top defender that season.

Verdict: A worthy DPOY season for Sanders. And the first of back-to-back DPOY-caliber seasons that would land Haynesworth a $100M contract.

2008: James Harrison, Pittsburgh Steelers

AP voting: Harrison (22), DeMarcus Ware (13) (Cowboys), Ed Reed (8) (Ravens), Albert Haynesworth (5) (Titans), Troy Polamalu (2) (Steelers)

This was another close vote: Harrison didn’t quite get half of the AP voting, but did win by a healthy margin. This was far from a unanimous seletion: Peter King at Sports Illustrated, John Clayton at ESPN, and Mark Gaughan at the Buffalo News all chose Ware, Rick Gosselin at the Dallas Morning News and Leonard Shapiro at the Miami Herald selected Reed, while the Sporting News poll of players, coaches, and general managers landed on Haynesworth. The KC101 awards went to Harrison and Ware as the top defenders in each conference.

The Steelers defense was outstanding in 2008.  It finishes two standard deviations above average in points allowed, and ranked as the 10th best pass defense ever.  And Pittsburgh ranked 1st or 2nd in yards per carry allowed, rushing yards allowed, and rushing touchdowns allowed. Harrison, of course, cemented his play in ’08 with one of the greatest plays in NFL history, a 100-yard interception return for a touchdown in Super Bowl XLIII.

Verdict: Harrison’s 16 sacks finished 4th in the NFL, and he was second on the team in tackles.  A very deserving choice for the award. As for Ware, this was the closest he ever got to winning the DPOY award.  In fact, he received just 3 other votes over the remainder of his career from AP writers, all in 2007 (although he did have a DPOY-caliber year in ’11, too).

2009: Charles Woodson, Green Bay Packers

AP voting: Woodson (28), Darrelle Revis (14) (Jets), Darren Sharper (3) (Saints), Elvis Dumervil (3) (Broncos), Jared Allen (2) (Vikings)

One of the more interesting DPOY races, as the top two players played the same position — but in very different ways. Revis was a dominant shutdown corner, having one of the greatest individual coverage seasons in recent history. Woodson was a great coverage corner who also played in the slot, or at safety, and was a pretty effective blitzer, too. The AP voters preferred Woodson’s all-around game at a 2:1 ratio, but there were dissenters.

Sports Illustrated’s Peter King selected Revis, as did the New York Daily News. USA Today had Revis winning by the narrowest of margins over Woodson and Dumervil. But Woodson did take home the majority of the hardware, including from Pro Football Weekly / Pro Football Writers of America and the Sporting News and the majority of sources out there. There were a couple of straggler votes — Tony Grossi of the Cleveland Plain Dealer chose Dumervil, Leonard Shapiro of the Miami Herald selected Sharper — but this was largely a two-man race.

Verdict: The ’09 Jets led the league in net yards per attempt allowed, points allowed, yards allowed, first downs allowed, passing yards allowed, and passing touchdowns allowed. Revis was the main reason for the defense’s success, and I’m not sure he had a finer year. Both he and Woodson appear to be future Hall of Famers. Of note: Woodson was named the Defensive Back of the Year by the NFL Alumni voting, and each player took home the Defensive Player of the Conference award from he KC101 organization.

2010: Troy Polamalu, Pittsburgh Steelers

AP voting: Polamalu (17), Clay Matthews (15) (Packers), James Harrison (8) (Steelers), Julius Peppers (6) (Bears), Brian Urlacher (2) (Bears), Haloti Ngata (1) (Ravens), Ed Reed (1) (Ravens)

The Steelers safety received just 34% of the vote, narrowly edging Matthews for the AP honor.  Was Polamalu the best defender in 2010? Well, in the Sporting News poll, Matthews took home the award with the voting going 188-148; the Packers outside linebacker was also the Pro Football Weekly/Pro Football Writers choice. As you would suspect, Peter King was again an outlier, going with Peppers as his top choice. Polamalu received the AP nod by a tiny margin, but

Verdict: Matthews deserves at least as much credit as Polamalu for what he did in 2010. The fact that the AP Trophy is considered “official” is kind of silly, but that goes double when the voting was this close. The Packers outside linebacker may be building a Hall of Fame career, and it would be ridiculous to think that two out of 50 votes from certain AP writers in one season would make a difference in that outcome. Then again, while Polamalu seems like a HOF lock, if he came in second place in ’10, would his case be any different?

2011: Terrell Suggs, Baltimore Ravens

AP voting: Suggs (21), Jared Allen (14) (Vikings), Justin Smith (6) (49ers), Jason Pierre-Paul (5) (Giants), Patrick Willis (2) (49ers), NaVorro Bowman (1) (49ers), Charles Woodson (1) (Packers)

Suggs was also the Pro Football Weekly / Pro Football Writers of America DPOY and the choice of a panel of 8 writers at Sports Illustrated.  The Sporting News chose Allen as its top player, with DeMarcus Ware as the runner up there.  The KC 101 chose Suggs and Allen as the top player of each conference. This wasn’t unanimous, and it wasn’t a runaway win, either, but Suggs was a legitimate winner. The Ravens defense ranked in the top 3 in points, yards, net yards per pass attempt, yards per carry, and rushing yards, while Suggs had 14 sacks.

Verdict: Allen had 22 sacks, making it the second most impressive sack season since ’82. Suggs was a worthy choice, but Allen — who is a borderline HOF candidate — deserves a ton of credit for his monster season while playing for a 3-13 team.

2012: J.J. Watt, Houston Texans

AP voting: Watt (49), Von Miller (1) (Broncos)

This was one of the most dominant defensive seasons in NFL history, and that is reflected in the voting. Consider this: over the course of their careers, Reed (29) and Polamalu (22) combined for 51 DPOY votes from the AP. Meanwhile, Watt had 49 just this year.  Aldon Smith was named the KC 101 NFC DPOY and the runner up according to The Sporting News, but Watt was basically a unanimous choice here.

Verdict: J.J. Watt is the man.

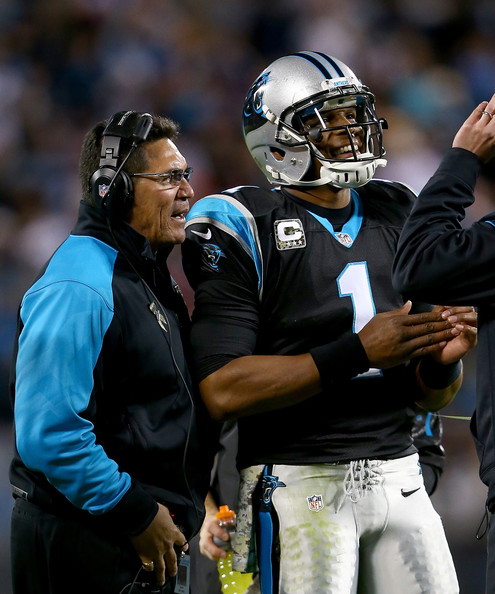
2013: Luke Kuechly, Carolina Panthers

AP voting: Kuechly (13), Robert Mathis (11.5) (Colts), Earl Thomas (7.5) (Seahawks), Robert Quinn (6) (Rams), Richard Sherman (4) (Seahawks), J.J. Watt (2) (Texans)

Sandwiched in between Watt’s two scorched-earth campaigns was one of the closest DPOY races in NFL history.  Mathis actually received more All-Pro votes than Kuechly, although the Colts star wasn’t the only one with a good case for the award.

The Pro Football Writers of America and Sports Illustrated chose Quinn, although the Sporting News also went with Kuechly. Pro Football Focus chose Watt, while the KC101 went with Kuechly in the NFC and Mathis in the AFC.  Oh, and the Seahawks had a historically dominant pass defense and two very deserving candidates, too.

Verdict: There were a number of great candidates during the ’13 season. Kuechly may be building a HOF career: he was the Defensive Rookie of the Year in 2012, the DPOY in 2013, and has been a first-team All-Pro by the AP in 2014.   Last year may have been his best season, and he was Pro Football Focus’ top inside linebacker. But I’ll still always remember him as this guy.

2014: J.J. Watt, Houston Texans

A unanimous winner, the first of its kind since the AP began giving out this award.  Watt also received 13 votes in the MVP voting, so it was that sort of season.  Everyone chose Watt as the league’s best player, although it’s worth noting that Richard Sherman did get chosen by the KC101 as the top defender in the NFC.

Verdict: J.J. Watt is the man.

{ 18 comments }

Guest Post: Questioning ANY/A

Adam Steele is back for another guest post. And, as always, we thank him for that. You can view all of Adam’s posts here.


Within the analytics community, we seem to have reached a consensus that ANY/A is the best box score metric for measuring passing efficiency. Over at the Intentional Rounding blog, Danny Tuccitto tested the validity of ANY/A using a technique called Confirmatory Factor Analysis. You can read his three part analysis here, here, and here. Essentially, he discovers that Y/A and TD % are valid statistics for measuring QB quality, while sack % and INT % are not. At first I was skeptical, but after some pondering I came up with a half-baked theory of why this might be true:

As we evaluate the potential for an athlete to succeed in professional sports, there are two kinds of statistics: Qualifying and Disqualifying. In the case of quarterbacks, I define a qualifying statistic as a minimum threshold the player must meet to even be considered NFL worthy. If we deconstruct ANY/A into its four components, Y/A and TD % emerge as qualifying statistics. In today’s NFL, I estimate that a QB must possess a true talent level of at least 6.0 Y/A and 2.5 TD % to deserve a roster spot. There are very few people in the world who can reach those thresholds against NFL caliber defenses (my best guess is around 100). With these two simple statistics, we’ve already weeded out the vast majority of quarterbacks from ever playing in the NFL.

Next, we turn to sack % and INT %, which are disqualifying statistics. By themselves, neither of these skills qualify a QB to play in the NFL. Anybody can avoid sacks or interceptions if they’re not worried about gaining yards. However, the inability to avoid sacks or interceptions will disqualify a QB from the NFL, regardless of how high his Y/A and TD % might be. I estimate these limits as roughly a true talent 12% sack rate and 4.5% INT rate. The population of quarterbacks who can stay under these limits AND perform above the minimum Y/A and TD % is very small. In most years, there aren’t enough of these QB’s to fill the 32 NFL starting spots. Among quarterbacks who receive significant NFL playing time, there is a strong survivorship bias for the disqualifying statistics of sack % and INT %, as the quarterbacks who make too many negative plays have already been weeded out of the sample. Given that Y/A and TD % are far rarer skills with no upper limits, these two statistics are the true measuring stick at the NFL level.

To test this theory, I created a very simple metric called Positive Yards Per Attempt (PY/A). It’s just passing yards plus a 20 yard bonus for touchdowns, divided by pass attempts (which does not sacks). I then converted PY/A into a value metric by measuring it relative to league average (RPY/A) [1]Note that in calculating league average, I excluded the player in question from the league average totals. So each player is compared to a slightly different definition of league average. and VALUE above average by multiplying RPY/A by attempts. We already have these variations of ANY/A (that is, RANY/A and VALUE), so comparing the two metrics is very straightforward. Since the merger, there have been 1,423 QB seasons of with least 200 dropbacks. This table lists the top 100 seasons of PY/A VALUE, as well as the ANY/A VALUE and rankings for these players. The “Diff” column signifies the gap in ranking between the the two metrics, with a positive number indicating a QB who is favored by PY/A and negative number favoring ANY/A.

RankQuarterbackTeamYearDpbkRPY/AVALUERANY/AVALUERankDiff
1Peyton ManningIND20045103.2916374.27217621
2Dan MarinoMIA19845772.8315984.0923591-1
3Aaron RodgersGNB20115383.0815443.6193652
4Kurt WarnerSTL20015842.714722.2913392521
5Kurt WarnerSTL19995282.914483.22170161
6Tom BradyNWE20075992.4314023.4820834-2
7Peyton ManningDEN20136772.0513483.1121043-4
8Kurt WarnerSTL20003673.6512652.8210357668
9Lynn DickeyGNB19835242.5512321.71898112103
10Steve YoungSFO19944922.6712302.961454155
11Steve YoungSFO19934932.6412182.5212413524
12Ken StablerOAK19763103.912123.4811504533
13Daunte CulpepperMIN20045942.1611812.471468130
14Boomer EsiasonCIN19884183.0411782.8511924026
15Chris ChandlerATL19983723.5511612.35876119104
16Drew BreesNOR20116811.7511472.4216507-9
17Randall CunninghamMIN19984452.6911433.32147912-5
18Tom BradyNWE20116431.8611332.4315628-10
19Bert JonesBAL19763723.0811283.8415259-10
20Philip RiversSDG2010579210842.112173818
21Drew BreesNOR20095342.1110842.74146514-7
22Daunte CulpepperMIN20005082.2410612.1310836240
23Philip RiversSDG20095112.1510462.73139519-4
24Philip RiversSDG20085032.1510252.412093915
25Joe MontanaSFO19894192.589963.161322272
26Tony RomoDAL20075441.849551.79279973
27Aaron RodgersGNB20145481.839512.59142118-9
28Mark RypienWAS19914282.249443.25139120-8
29Steve YoungSFO19985651.829412.0511564314
30Steve YoungSFO19924312.39253.33143617-13
31Jim KellyBUF19915051.959231.8392510069
32Ben RoethlisbergerPIT20095561.829211.5284513098
33Nick FolesPHI20133452.869083.371162429
34Peyton ManningIND20054701.999042.76130029-5
35Brett FavreGNB19956031.568911.911474611
36Tony RomoDAL20144652.028781.9891910670
37Drew BreesNOR20086481.388761.92124234-3
38Steve BeuerleinCAR19996211.538741.6410197941
39Dan FoutsSDG19823422.038573.07134223-16
40Roger StaubachDAL19733292.778462.09735169129
41Aaron RodgersGNB20095911.548321.8811115918
42Ken AndersonCIN19754092.058253.04132526-16
43Matt SchaubHOU20096081.418221.861130529
44Dan FoutsSDG19854481.918192.229938440
45Ken StablerOAK19743282.458093.231128549
46Jeff GeorgeMIN19993572.458081.88672193147
47Boomer EsiasonCIN19864951.728072.1410606922
48Peyton ManningIND20005911.418052.08123236-12
49Dan MarinoMIA19866401.298022.12135522-27
50Peyton ManningDEN20126041.378012.02122237-13
51Jim EverettRAM19895471.547971.9810826312
52Eli ManningNYG20116171.357961.69868735
53Warren MoonHOU19906201.367952.08128732-21
54Donovan McNabbPHI20045011.687902.3115444-10
55Peyton ManningIND20065711.417872.63150310-45
56Philip RiversSDG20135741.447841.98113651-5
57Joe NamathNYJ19723352.237712.2179114689
58Tom BradyNWE20105171.567682.59133924-34
59Vinny TestaverdeBAL19965831.397651.27743163104
60Steve YoungSFO19973912.157642.3692210444
61Drew BreesNOR20136871.177631.7116541-20
62Aaron RodgersGNB20105061.617631.8291910745
63Joe MontanaSFO19844541.767593.02137021-42
64Brett FavreGNB19975381.477551.7292310238
65Drew BreesNOR20126961.127511.2989511449
66Steve YoungSFO19912922.677463.1692210337
67Steve McNairTEN20034191.857412.67111958-9
68Trent GreenKAN20045881.337371.4585612658
69Brett FavreMIN20095651.387352.03114447-22
70Terry BradshawPIT19783891.997322.0881114171
71Drew BreesNOR20065721.327292.28130428-43
72Tony RomoDAL20095841.327281.95114049-23
73Brett FavreGNB20015321.437281.881003818
74Neil LomaxSTL19846091.297251.76107166-8
75Tony RomoDAL20063582.147231.85662200125
76Peyton ManningIND20095811.267221.93112057-19
77Aaron RodgersGNB20126031.37191.4487112144
78Peyton ManningIND20075361.397151.839798911
79Ben RoethlisbergerPIT20052912.647082.22647208129
80Ken AndersonCIN19743642.027072.459519414
81Dan FoutsSDG19816281.157022.37148611-70
82Dan FoutsSDG19806211.197011.69104871-11
83Jeff GarciaSFO20005851.257012.21129031-52
84Ben RoethlisbergerPIT20074511.736991.06476299215
85Trent GreenKAN20024961.476931.7285412742
86Peyton ManningDEN20146141.156881.59979882
87Ben RoethlisbergerPIT20146411.126841.75112156-31
88Craig MortonDEN19814301.86751.06455318230
89Peyton ManningIND20035841.176642.22129430-59
90Trent GreenKAN20035431.256541.95105670-20
91Peyton ManningIND19995471.226511.94106267-24
92Brett FavreGNB19965831.196481.5288911624
93Dan FoutsSDG19833541.96452.3884313239
94Greg LandryDET19712902.316442.13660201107
95Carson PalmerCIN20055281.266441.97104174-21
96Roger StaubachDAL19712342.866433.9799185-11
97Carson PalmerCIN20065561.236421.4681214043
98Joe MontanaSFO19874201.41640295893-5
99Tom BradyNWE20055561.216391.5686912223
100Dan FoutsSDG19784031.676362.1285212828

This list makes a strong case for the validity of PY/A. It’s populated by the greatest QB seasons of all time at the top, and filled out by a number of other notably great and very good seasons. There are a few head scratchers (most notably Lynn Dickey at #9), but for the most part it’s a very credible list that closely mirrors the ANY/A rankings. That’s the point, really. When we remove sacks and interceptions from ANY/A, it doesn’t lose much accuracy, if any. At first glance, I was concerned that PY/A systematically overrates certain quarterbacks and underrates others. That’s probably true to a certain degree. However, I would argue that ANY/A has the same issue, except it’s a different set of quarterbacks who are over- and underrated by it. The true balance almost certainly lies somewhere in between the two metrics. FWIW, the correlation between RPY/A and RANY/A is a robust 0.877, with an r-squared of 0.769.

Now lets look at the other end of the spectrum – the 100 worst PY/A VALUE seasons since 1970.

Rank TeamYearDpbkRPY/AVALUERANY/AVALUERankDiff
1423Derek CarrOAK2014623-2.02-1209-1.36-8481395-28
1422Drew BledsoeNWE1995659-1.71-1086-1.09-7161366-56
1421Jon KitnaCIN2001606-1.67-972-1.48-8981408-13
1420Chris WeinkeCAR2001566-1.79-964-1.5-8481396-24
1419Joey HarringtonDET2003563-1.67-928-1.38-7791380-39
1418Kyle BollerBAL2004499-1.93-894-1.51-7551374-44
1417Blaine GabbertJAX2011453-2.16-894-2.28-103214192
1416Jack TrudeauIND1986446-2.14-893-1.96-8741405-11
1415Vince EvansCHI1981459-2.02-883-1.78-8181391-24
1414Ryan FitzpatrickCIN2008410-2.23-828-2.18-8921407-7
1413Archie ManningNOR1975387-2.23-803-2.76-113914229
1412Sam BradfordSTL2010624-1.36-801-1.04-6461349-63
1411Mark RypienWAS1993335-2.47-788-2-6711354-57
1410Bobby HoyingPHI1998259-3.46-775-3.94-102014188
1409Kordell StewartPIT1998491-1.68-769-1.78-8731404-5
1408Kyle OrtonCHI2005398-2.05-753-2.19-8721403-5
1407Jimmy ClausenCAR2010332-2.51-749-2.8-93014136
1406Blake BortlesJAX2014530-1.57-745-2.39-1268142317
1405Colt McCoyCLE2011495-1.59-736-1.19-5911329-76
1404Mark MalonePIT1987354-1.91-734-2.24-90714106
1403A.J. FeeleyMIA2004379-2.06-732-2.25-8511399-4
1402Joey HarringtonDET2002437-1.66-711-1.4-6131337-65
1401Akili SmithCIN2000303-2.65-708-2.44-7381371-30
1400Bruce GradkowskiTAM2006353-2.07-679-1.76-6211342-58
1399Jake PlummerARI2002566-1.27-676-1.54-87014023
1398Rusty HilgerDET1988337-2.19-672-2.38-8021386-12
1397Gary MarangiBUF1976254-2.62-649-3.14-85214014
1396Joe FlaccoBAL2013662-1.05-648-1.42-942141620
1395Matt CasselKAN2009535-1.27-627-1.43-7631378-17
1394Dan PastoriniHOU1973320-2.02-626-2.39-8161390-4
1393Steve SpurrierTAM1976343-1.84-610-1.3-4771265-128
1392Joe FergusonBUF1983535-1.2-609-1.06-5701321-71
1391Jeff GeorgeIND1991541-1.25-608-1.37-7431372-19
1390Sam BradfordSTL2011393-1.69-604-1.44-5651318-72
1389Jake PlummerARI1999408-1.57-600-2.65-1079142031
1388Joe NamathNYJ1976246-2.44-598-2.91-7631377-11
1387John FrieszSDG1991519-1.22-596-0.89-4601254-133
1386Mark MalonePIT1986438-1.38-588-0.78-3441159-227
1385Mike PhippsCLE1975341-1.76-587-2.01-7311368-17
1384JaMarcus RussellOAK2009279-2.37-584-3.39-945141733
1383David CarrHOU2002520-1.31-583-2.17-1127142138
1382Brad JohnsonTAM2001603-1.04-580-0.4-2381041-341
1381Bernie KosarCLE1990460-1.37-580-1.27-5851327-54
1380Ryan LeafSDG1998267-2.31-566-3.44-918141131
1379Phil SimmsNYG1980438-1.41-565-1.41-6161338-41
1378Mark BrunellWAS2004252-2.35-558-1.85-4671261-117
1377Steve DeBergSFO1978319-1.84-554-2.25-7191367-10
1376Christian PonderMIN2012515-1.14-551-0.97-4991285-91
1375Browning NagleNYJ1992414-1.42-549-1.45-5981332-43
1374Rick MirerSEA1993533-1.13-547-1.27-6761356-18
1373Joe KappBOS1970246-2.34-546-3.55-933141441
1372Josh FreemanTAM2011580-0.99-543-1.18-6851359-13
1371Chad HenneJAX2013541-1.08-543-1.04-5651319-52
1370Steve DilsMIN1983481-1.22-542-0.68-3281142-228
1369Alex SmithSFO2007210-2.79-539-2.43-5111290-79
1368Chuck LongDET1987433-1.13-535-0.93-4611257-111
1367Todd BlackledgeKAN1984308-1.82-535-1.14-3521169-198
1366Joe FergusonBUF1984379-1.55-532-2.13-807138721
1365Donovan McNabbPHI1999244-2.45-530-2.8-6841358-7
1364Stan GelbaughSEA1992289-2.08-529-2.63-759137511
1363Jack ConcannonCHI1970409-1.29-528-0.68-2951104-259
1362Jim HartSTL1979403-1.4-528-1.39-5591315-47
1361Josh McCownARI2004439-1.29-525-1.06-4671260-101
1360Tommy KramerMIN1979602-0.93-524-0.43-2581062-298
1359Jim ZornSEA1976464-1.11-521-1.09-5411305-54
1358Mike LivingstonKAN1978308-1.79-520-1.08-3321144-214
1357Kerry CollinsCAR1997408-1.36-518-2.28-930141255
1356Rick MirerSEA1994408-1.35-515-0.71-2911100-256
1355Trent DilferTAM1996510-1.07-515-1.18-6011333-22
1354Donovan McNabbPHI2000614-0.9-514-0.44-2681071-283
1353Craig WhelihanSDG1998335-1.6-511-2.38-798138532
1352Brady QuinnCLE2009275-1.99-509-1.75-4811268-84
1351Boomer EsiasonCIN1992297-1.82-505-2.23-66213521
1350Dan PastoriniHOU1972336-1.57-502-1.35-4831270-80
1349Joey HarringtonMIA2006403-1.29-501-1.23-4941279-70
1348Kordell StewartPIT1999297-1.82-501-1.83-5451308-40
1347Doug PedersonCLE2000227-2.38-500-2.55-5781325-22
1346David KlinglerCIN1993383-1.45-499-1.37-5241297-49
1345Kelly StoufferSEA1992216-2.62-497-3.39-732136924
1344John HadlGNB1975388-1.32-496-1.55-64213484
1343Cleo LemonMIA2007334-1.6-496-1.17-3921212-131
1342Vince FerragamoBUF1985306-1.71-491-2.04-62313431
1341Danny KanellNYG1998321-1.63-488-1.6-5131291-50
1340Steve FullerKAN1979307-1.8-485-2.28-701136323
1339Steve DeBergSFO1979595-0.83-4800.32193537-802
1338Tony BanksSTL1998449-1.17-479-1.32-5921330-8
1337Bobby DouglassCHI1971255-1.98-474-2.6-708136427
1336Joey HarringtonDET2004525-0.97-474-0.52-2741075-261
1335Marc BulgerSTL2008478-1.07-472-1.36-652135015
1334Steve BonoKAN1996460-1.07-470-0.66-3051120-214
1333Mark SanchezNYJ2012487-1.02-462-1.61-786138350
1332David WoodleyMIA1980344-1.4-459-1.3-4461244-88
1331Matt HasselbeckSEA2009520-0.94-458-1.07-5581314-17
1330Mike PagelBAL1982237-1.62-458-0.83-2511055-275
1329Brett FavreGNB2006634-0.74-456-0.18-114901-428
1328Roman GabrielPHI1974373-1.26-456-0.59-2341036-292
1327Neil LomaxSTL1986473-1.08-454-0.92-4361241-86
1326Ken DorseySFO2004239-2-451-2.1-5011286-40
1325Brandon WeedenCLE2012545-0.87-449-0.98-5361301-24
1324Mike BorylaPHI1976275-1.71-448-2.07-608133511

I actually find the Worst list even more validating of PY/A than the Best list. When we think of bad quarterbacks, most us reflexively focus on quarterbacks who make a lot of mistakes and sink their teams in obvious and memorable ways. And this list is filled with conventionally terrible quarterbacks. But remember, nearly all of their negative plays have been removed, so it’s not their mistakes putting them on the list. It’s their impotence. These guys couldn’t make plays or move the ball down the field, killing their teams slowly and agonizingly. At the very top (err, bottom), we find Derek Carr’s rookie year. A lot of fans and pundits classify Carr as a budding franchise QB who showed “flashes of potential”. Actually no, he showed the exact opposite. While the younger Carr avoided sacks and interceptions at a reasonable rate, his Y/A was absolutely pathetic. Even accounting for his lousy supporting cast, that is a major red flag. It’s much easier for a young QB to reign in his mistakes than it is for him to suddenly learn how to make positive plays down the field. Blake Bortles fits precisely the same troubling profile, so I don’t have much hope for the class of 2014.

Does this change your feelings about ANY/A? Do you think Danny and I are wasting our time? If anyone else has created their own passing metric using basic stats, I’d love to hear about it.

References

References
1 Note that in calculating league average, I excluded the player in question from the league average totals. So each player is compared to a slightly different definition of league average.
{ 35 comments }

In 2008, Jamaal Charles had 67 carries and averaged 5.33 yards per carry. Those 67 carries represent 5% of Charles’ career attempts to date (excluding playoffs). That season, the NFL league average was 4.20 yards per carry, which means Charles was 1.12 (after rounding) YPC above average in 2008, or 1.12 YPC above average on 5% of his career carries.

In ’09, Charles had 190 carries, representing 15% of his career YPC. He averaged 5.89 YPC, and the league average was 4.24, which means Charles was 1.65 YPC above average for 15% of his career carries.

In 2010, those numbers were 230, 18%, 6.38, and 4.21, so Charles was 2.17 YPC above league average on 18% of his career carries.

I performed that analysis for every season of Charles’ career — and every other player in NFL history — to determine each player’s career YPC average relative to league average. The table below shows the 200 running backs (by default, only the top 10 are shown) in pro football history with the most carries. The table is sorted by YPC over league average. Here’s how to read it. Jamaal Charles ranks 1st in YPC over league average. His first year was 2008 and his last year (so far) was 2014. For his career, Charles has 1,249 career rush attempts, which ranks 118th in pro football history. He has 6,856 yards, giving him a 5.49 career YPC average. His “expected” career yards per carry average — based on the league average YPC in each season of his career, weighted by his number of carries — is 4.21. Therefore, Charles has averaged 1.28 YPC above league average for his career, the highest rate in football history. [continue reading…]

{ 30 comments }

Brad Oremland is a longtime commenter and a fellow football historian. Brad is also a senior NFL writer at Sports Central. There are few who have given as much thought to the history of quarterbacks and quarterback ranking systems as Brad has over the years. What follows is Brad’s latest work on the greatest quarterbacks of all time.

Part I: Pre-Modern Era
Part II: 49-101
Part III: 40-48
Part IV: 31-39
Part V: 21-30
Part VI: 11-20
Part VII: 6-10
Part VIII: 1-5


This week, I’m profiling the players who rank 11-20 on my list, counting down toward number one. Please note: at this point, we’re talking about the best of the best QBs. When I mention a player’s weaknesses, I’m not trying to insult him, just explaining why he doesn’t rate even higher.

20. Y.A. Tittle
Baltimore Colts, 1948-50; San Francisco 49ers, 1951-60; New York Giants, 1961-64
33,070 yards, 242 TD, 248 INT, 74.3 rating

Y.A. Tittle retired as the all-time leader in passing yards and passing TDs. Those are holy marks, passed from Tittle to Johnny Unitas, then to Fran Tarkenton and Dan Marino, on to Brett Favre and now on their way to Peyton Manning. Tittle led the NFL in passing touchdowns three times — including 36 in 1963, a record that lasted more than 20 years. [continue reading…]

{ 76 comments }

Defensive Player of the Year Award: 2000-2006

Every year, the Associated Press names a Defensive Player of the Year.  But not all winners are chosen by the same margin (the ’14 winner received 100% of the vote, while the ’13 winner had just 26%), and the AP is hardly the only authority.  I thought it would be fun and informative to take a closer look at the selections in some prior years.  Let’s begin with the 7-year period from 2000 to 2006.

2000: Ray Lewis, Baltimore Ravens

The AP voting: Lewis (30), La’Roi Glover (11) (Saints), Warren Sapp (4) (Buccaneers), Keith Hamilton (2) (Giants), Derrick Brooks (2) (Buccaneers), Jason Taylor (1) (Dolphins) [continue reading…]

{ 5 comments }

Three years ago on Father’s Day, I posted a trivia question about the first quarterback to get to 100 losses. I won’t spoil that for new readers, and older readers have bad memories so you can try your hand at that trivia question again.

Today, a different trivia question: Who was the first quarterback to get to 100 wins?

Trivia hint 1 Show


Trivia hint 2 Show


Trivia hint 3 Show


Click 'Show' for the Answer Show

Unitas was the career record holder for about nine years. Then, on October 1st, 1978, Fran Tarkenton and the Vikings beat the Buccaneers in Tampa Bay. That marked the 119th victory of Tarkenton’s career, breaking the tie with Unitas set one week earlier. Tarkenton would win five more games in ’78, his final season in the NFL.

Tarkenton was the NFL’s winningest quarterback for 18 years. On December 1st, 1996, John Elway and the Broncos crushed the Seahawks, 34-7. In the process, Elway picked up his 125th career victory. When he set the record, Elway held only a narrow lead in the wins department over Dan Marino. But the ’97 and ’98 seasons were good to him, and Elway retired with 148 career wins. Marino played for one more year, but retired one shy, with 147 career wins.

Elway held the record for just over ten years. That was until Brett Favre, in a 35-13 win over the Giants, won his 149th career game.

Favre retired with 186 wins. And right now, Peyton Manning enters the 2015 season with 178 wins. It would be a surprise if Manning doesn’t edge out Favre this season, which would make Favre — at 8 years — the man who held the title of ‘winningest quarterback’ for the shortest amount of time. How long will Manning hold the record? That will depend on Tom Brady, who has 160 wins. Will Brady play long enough to eclipse Manning? Whichever of the two winds up on top will hold the record for the foreseeable future, especially if they extend it out to 200 wins.

{ 3 comments }

The 2014 Cowboys had a lot of continuity on offense. Each of the team’s 11 main starters on offense started at least 11 games. Quarterback Tony Romo started 15 games, while running back DeMarco Murray, wide receivers Dez Bryant and Terrance Williams, and tight end Jason Witten each started 16 games. The sixth non-lineman starter was usually James Hanna who started 12 games, but even that sells the team short. Hanna played in all 16 games, but started only 12; in four other games, Dallas instead started off with either slot receiver Cole Beasley, third-string tight end Gavin Escobar, or fullback Tyler Clutts on the field over a healthy Hanna.

On the offensive line, Tyron Smith, Travis Frederick, and Zack Martin each started 16 games and made the Pro Bowl; left guard Ronald Leary started 15 games, with the most major injury hitting right tackle Doug Free, who missed three games in the middle of the year with a foot injury, and the final two games (and both playoff games) with an ankle injury.

Things were only slightly hairier on defense. In the secondary, safeties Barry Church and J.J. Wilcox started every game, while cornerback Brandon Carr also played the full slate. Orlando Scandrick started the final 14 games of the year at corner after being suspended for the first two games of the year.

On the defensive line, Jeremy Mincey and Nick Hayden started 16 games, Tyrone Crawford started 15, and George Selvie started 13 games (but played in all 16). The most serious injuries came at linebacker: Rolando McClain started 12 games, Anthony Hitchens started 11, and Bruce Carter started 8 games. Of course, Sean Lee also missed the entire season after tearing his ACL in May.

If you sort the Cowboys roster by number of starts, the top 22 players started 318 games, or 14.5 games per play. That, as you might have guessed, was the most of any team last season:

RkTmAvg of Top 22
1DAL14.5
2GNB14.4
3MIA14.3
4CIN14
5DEN13.9
6BAL13.8
8PHI13.7
8HOU13.7
8DET13.7
10KAN13.6
11IND13.6
12ATL13.5
13SEA13.5
14.5NYJ13.4
14.5BUF13.4
17SFO13.3
17STL13.3
17PIT13.3
19SDG13.3
20OAK13.2
21WAS13.1
22CHI13
23.5MIN12.9
23.5ARI12.9
25NOR12.8
26NYG12.7
27.5NWE12.6
27.5CAR12.6
29CLE12.6
30TAM12.5
31JAX12.4
32TEN12.3

While Dallas looks pretty good in this analysis, it’s far from exceptional historically. [1]This, at least in part, is due to more specialization in today’s games, and teams being more likely to change the starting lineup (going with three receivers or a fullback instead of two tight … Continue reading Since 1978, 185 teams have had their top 22 starters average at least 14.5 starts.

The table below lists the top 56 teams (a 9-way tie at 48 enlarged a top-50 list) by this metric since 1978. I’ve also displayed each team’s winning percentage in Year N and in Year N+1, with Year N being the initial year in question.

RkTmAvg of Top 22YearWin %N+1 Win %
1GNB15.819780.5310.313
2CIN15.519880.750.5
3TAM15.520000.6250.563
4PHI15.519800.750.625
5.5KAN15.420030.8130.438
5.5MIN15.419940.6250.5
7NYJ15.420020.5630.375
8DEN15.319960.8130.75
10DAL15.319940.750.75
10RAI15.319830.750.688
10BUF15.319800.6880.625
13SFO15.220010.750.625
13RAI15.219900.750.563
13HOU15.219900.5630.688
15.5SDG15.219940.6880.563
15.5RAI15.219930.6250.563
19NYJ15.120010.6250.563
19HOU15.119910.6880.625
19HOU15.119880.6250.563
19CLE15.119860.750.667
19HOU15.119790.6880.688
24.5PHO15.119900.3130.25
24.5HOU15.119850.3130.313
24.5DAL15.119830.750.563
24.5DAL15.119800.750.75
24.5CLE15.119800.6880.313
24.5ATL15.119780.5630.375
28.5DEN1519980.8750.375
28.5PHO1519880.4380.313
33TAM1520010.5630.75
33WAS1519990.6250.5
33STL1519990.8130.625
33ATL1519810.4380.556
33BUF1519790.4380.688
33ATL1519790.3750.75
33DAL1519780.750.688
41.5ATL1519980.8750.313
41.5TEN1519970.50.5
41.5DET1519950.6250.313
41.5RAI1519910.5630.438
41.5MIA1519900.750.5
41.5CIN1519850.4380.625
41.5WAS1519830.8750.688
41.5SFO1519810.8130.333
41.5CHI1519800.4380.375
41.5NWE1519780.6880.563
51CAR14.920050.6880.5
51IND14.920000.6250.375
51GNB14.919890.6250.375
51NYG14.919860.8750.4
51PHI14.919850.4380.344
51NOR14.919830.50.438
51DET14.919810.50.444
51RAM14.919780.750.563
51MIN14.919780.5310.438

As you might suspect, these teams tended to fare better in Year N than they did the following year. While some regression to the mean is expected, these 56 teams had an average winning percentage of 0.640 in Year N, and then 0.519 in Year N+1. This is too general a study from which to conclude much, if anything, about the 2015 Cowboys. It should go without saying that “starts” are not a perfect proxy for “team health” and even if it were, “team health” is not a good proxy for “amount by which a team was helped/harmed by injuries.” But I did find today’s results interesting enough to share.

References

References
1 This, at least in part, is due to more specialization in today’s games, and teams being more likely to change the starting lineup (going with three receivers or a fullback instead of two tight ends, starting in nickel rather than a traditional base defense, etc.
{ 8 comments }

Was Walter Payton the biggest workhorse in NFL history? In 1977, he gained 43.5% of Chicago’s total offensive yards. The next year, it was 39.5%, and the year after that, it was 39.1%. Payton also was responsible for 37.8% of the Bears output in ’76, 36.2% of the team’s yards in ’84, and 35.8% of Chicago’s offense in 1980.

But wait, there’s more! In ’82 and ’85, Payton was responsible for 33.1% and 33.5% of his team’s offense, and in ’81 and ’83, it was 32.7% and 32.8%. For ten seasons, Payton was responsible for at least thirty-three percent of his team’s offense! And in 1986, he gained 30.6% of all Chicago yards.

Yesterday, we looked at the single-season leaders in percentage of team yards. Today, the career list, using a 100-95-90 weighting method. What’s that? To avoid giving too much credit to compilers, I did not assign full credit to each season, and instead used the following methodology:

1) Calculate the total yards from scrimmage by each player in each season since 1932.

2) Calculate the total team yards (excluding sacks) by that player’s team. Players who played for multiple teams in a season were therefore prejudiced by this methodology.

3) Calculated the percentage of team yards gained by each player in each season since 1932. This was the basis of yesterday’s post.

4) Order each player’s career from best season (per step 3) to worst.

5) Give each player 100% credit during his best season, 95% credit during his second best season, 90% during his third best, and so on. So for Payton, we give him 100% of 43.5%, 95% of 39.5%, 90% of 39.1%, 85% of 37.8%, and so on.

6) Sum the values in step 5 for each player for each season to get a career grade.

That career grade doesn’t mean much in the abstract — Payton’s grade is 318% — but when we order the list, it does provide some limited insight as to which players have been the biggest workhorses in NFL history. This is far from a perfect formula, but I do think it’s interesting. Note that I also performed the same analysis using a 100-90-80 method — to give even less value to compilers — and not a single player moved up or down in the top 15. The table below shows the top 150 players by this metric: [continue reading…]

{ 25 comments }
A key cog, but not the only one, in the GSOT

A key reason, but not the only one, for the GSOT’s success

In 1999, Marshall Faulk set the NFL record for yards from scrimmage in a season with 2,429. That mark still stands as the 2nd best in NFL history, and Faulk was truly dominant that season.

But while Faulk may have been the key cog in the St. Louis machine, he wasn’t the whole machine. St. Louis led the NFL in total yards, and had the most talented offense in the NFL. Faulk accounted for 36.6% of the Rams total offensive output that year, [1]Receiving Yards + Rushing Yards, or Net Passing Yards + Sack Yards Lost + Rushing Yards. a huge number — but not a historically incredible one.

Consider what Maurice Jones-Drew did in 2011. The Jaguars were 5-11, and finished last by a mile in terms of total yards. Yet, somehow, Jones-Drew led the league in rushing with 1,606 yards, and ranked 2nd with 1,980 yards from scrimmage. No other Jaguar came within 1500 yards of Jones-Drew that year! The Jacksonville star was responsible for an incredible 44.2% of the team’s offensive output that season, the 2nd most in NFL history.

Now, what’s more impressive: being responsible for 44.2% of a bad offense, or 36.6% of a dominant one? That’s up to each reader to decide, but today, I wanted to look at workhorse yardage producers. The table below, which is fully sortable and searchable, shows the top 400 players in the statistic “percentage of team’s total yards from scrimmage”: [continue reading…]

References

References
1 Receiving Yards + Rushing Yards, or Net Passing Yards + Sack Yards Lost + Rushing Yards.
{ 16 comments }

Brad Oremland is a longtime commenter and a fellow football historian. Brad is also a senior NFL writer at Sports Central. He’s contributed today’s guest post, and we thank him for that. This one is certainly thought-provoking.


I recently ranked Doug Flutie 31st among the greatest quarterbacks of all time, ahead of accomplished players like Kurt Warner, Boomer Esiason, and Ben Roethlisberger. Perhaps predictably, the unconventional ranking for Flutie generated questions, comments, and plain disagreement. I hope this follow-up will clear some of the confusion and help readers understand my reasoning.

I was attempting to rank the greatest quarterbacks ever — not just the best NFL quarterbacks — and this was not a stat-based evaluation. Statistics play a large role in the assessment of players, but they do not form an exclusive basis for it. When I rated Flutie ahead of Warner and company, I wasn’t suggesting that he had a better NFL career than those players, just that he was a better quarterback.

Here’s a breakdown of Flutie’s career:

* New Jersey Generals, 1985 (USFL)
* Chicago Bears, 1986-87
* New England Patriots, 1987-89
* BC Lions, 1990-91 (CFL)
* Calgary Stampeders, 1992-95 (CFL)
* Toronto Argonauts, 1996-97 (CFL)
* Buffalo Bills, 1998-2000
* San Diego Chargers, 2001-04
* New England Patriots, 2005 [continue reading…]

{ 38 comments }

Brad Oremland is a longtime commenter and a fellow football historian. Brad is also a senior NFL writer at Sports Central. There are few who have given as much thought to the history of quarterbacks and quarterback ranking systems as Brad has over the years. What follows is Brad’s latest work on the greatest quarterbacks of all time.

Part I: Pre-Modern Era
Part II: 49-101
Part III: 40-48
Part IV: 31-39
Part V: 21-30
Part VI: 11-20
Part VII: 6-10
Part VIII: 1-5


This week, I’m profiling the players who rank 21-30 on my list. The players are ranked in order, but please don’t read too much into that: I consider this a group of quarterbacks, all roughly the same level. If you’re outraged that #26 is higher than #29, you have my blessing to flip them.

30. John Brodie
San Francisco 49ers, 1957-73
31,548 yards, 214 TD, 224 INT, 72.3 rating
[continue reading…]

{ 110 comments }

On June 15, 2012, I launched Football Perspective. Since that day, Football Perspective has posted at least one new article every single day. This is the site’s 1,249th post, so I won’t blame you if you’ve missed an article here or there. At the top of every page is a link to the Historical Archive, a page that is updated after each post is published.

In what is becoming an annual tradition, I use this space every June 15th to thank the people who have helped make this site successful.  And, as it turns out, every year I feel indebted to even more people.   And this year, that starts with you.

“Never read the comments” is a meme that has near-universal support on the internet.  But that’s not true here, and that’s because Football Perspective’s regular commenters are not just some of the smartest football minds on the planet, but some of the nicest.  And that means the world to me.

Consider, for a minute, what Brad Oremland is doing.  Brad’s a senior writer at Sports-Central, and he planned on writing a series on the greatest quarterbacks of all time this off-season.  And while he’s running that series there, he’s co-running it here, too.  Why? Because of you. Because when smart people put out great work, they want to hear what other smart people have to say.  The fact that a great football mind like Brad is eager to post stuff here just to get feedback from this site’s commenters is a remarkable advertisement for this community.  I remain indebted to the many great folks who comment on this site, and your love, intelligence, and civility motivates me to keep this thing going. [continue reading…]

{ 9 comments }

Weekend Trivia: Yards per Reception Leaders

Do you know who led the NFL in yards per reception last year?  Or in any season?  Unlike certain rate stats, YPR tends to fly under the radar, at least with respect to questions like who led the league in a given season.

One reason for that is the leader is often a part-time player.  Last year, DeSean Jackson had the top YPR average in the league at 20.9, and he also ranked a respectable 13th in receiving yards. But in 2013, that honor went to New Orleans rookie Kenny Stills, who averaged 20 yards per catch but ranked just 61st with 641 receiving yards.

That leads us to today’s trivia question: Can you name the last player to lead the league in both yards per reception and in receiving yards? [continue reading…]

{ 5 comments }

Prompted by Le’Veon Bell’s remarkable stretch towards the end of last season, I took a look at the greatest four-game stretches by a fantasy running back over at Footballguys.com:

In the Steelers 11th game of the year, LeVeon Bell rushed for 204 yards and a touchdown.  In his next game, he totaled 254 yards from scrimmage against the Saints and ran for another score.  In Pittsburgh’s 13th game of the season, Bell scored three times against the Bengals while gaining 235 yards from scrimmage.  Finally, against the Falcons, Bell totaled 119 yards and ran for two touchdowns.

Over that four-game stretch, Bell scored seven touchdowns, gained 830 yards from scrimmage, and caught 21 passes.  If we use a scoring system that provides 0.5 points per reception and the standard 1 point for 10 yards rushing/receiving and 6 points for touchdowns. That translates to 135.5 fantasy points over such period, which is obviously an insane amount of points.  But how insane?  Only six other running backs since 1960 have had greater four-game stretches.  Let’s go to the list.

You can read the full article here. Suffice it to say, Bell is in some pretty rare company.

{ 0 comments }

In 2014, Julio Jones led the NFL with 31 catches of at least 20+ yards. He also was tied for 3rd with 25 receptions on either 3rd or 4th down that picked up a first down for his team. Those are two pretty different skill sets, but Jones fared well in both areas.

I thought it would be fun to try to see which wide receivers were big outliers in one of those two metrics relative to the other. [1]The original inspiration for this post came from this Mike Tanier article. There were 56 players with at least 10 receptions of at least 20+ yards last season. I ran a simple linear regression using “20+ Yard Receptions” as my input and “1st down receptions on 3rd/4th down” as my output. The best-fit formula was:

1st down receptions on 3rd/4th down = 6.77 + 0.63 * 20+ Yard receptions

Let’s use Jones as an example. With 31 big play catches, he’d be “expected” to pull in 26.3 first downs on either 3rd or 4th down; as noted above, he came pretty close to hitting that exact number.

Then there are players like Washington’s DeSean Jackson. He had 16 “big play catches” last year, which means we’d “project” him to have about 16.8 first down grabs on 3rd/4th down. In reality, he had just five, falling 11.8 catches short of expectation. As it turns out, that’s the most extreme player in that direction from the 2014 season. The narrative meets the numbers: Jackson is a great deep threat, but not a move-the-chains receiver (or, at least, he’s not being used like one).

In the other corner, we have Anquan Boldin. The crafty veteran had 14 receptions of at least 20+ yards, which means we’d expect him to have recorded about 15.6 first down catches on 3rd or 4th down. In reality, he had 27, giving him 11.4 more than expected. That makes him the most extreme “possession receiver” by this methodology.

The full list, below: [continue reading…]

References

References
1 The original inspiration for this post came from this Mike Tanier article.
{ 8 comments }

Some quick data dumps today.

The first graph shows the percentage of 1-yard touchdowns that were rushing touchdowns or passing touchdowns in each year since 1950. As you can see, while the majority of all 1-yard scores are still rushing touchdowns, the ratio has changed considerably over the last 40 years.

1yd pass run [continue reading…]

{ 8 comments }

There were 220 touchdown passes thrown during the 1950 season. Let’s break down who threw those scores into three categories:

  • 22 were thrown by players who were not playing professional football in 1949, including rookies like Tobin Rote and Adrian Burk.

Now, for some perspective, note that in 1949, there were 10 NFL teams and 7 AAFC teams. [1]Historians might recall that the AAFC was an 8-team league. That’s generally true, but the Brooklyn Dodgers merged with the New York Yankees prior to the ’49 season. And yes, both of … Continue reading All else being equal, with just one merged league in 1950, you might expect the splits to be along the lines of 59% NFL, 41% AAFC. The above data looks as though this would support the widely-held notion that the NFL was the superior league. [2]Although, frankly, I’m not even sure if this would support the case nearly as much as many would suggest, since discarding the AAFC entirely is acceptable to some observers. But if you dive a little bit deeper into the analysis, you get a slightly different picture: [continue reading…]

References

References
1 Historians might recall that the AAFC was an 8-team league. That’s generally true, but the Brooklyn Dodgers merged with the New York Yankees prior to the ’49 season. And yes, both of those teams were AAFC teams, not MLB teams.
2 Although, frankly, I’m not even sure if this would support the case nearly as much as many would suggest, since discarding the AAFC entirely is acceptable to some observers.
{ 7 comments }

Brad Oremland is a longtime commenter and a fellow football historian. Brad is also a senior NFL writer at Sports Central. There are few who have given as much thought to the history of quarterbacks and quarterback ranking systems as Brad has over the years. What follows is Brad’s latest work on the greatest quarterbacks of all time.

Part I: Pre-Modern Era
Part II: 49-101
Part III: 40-48
Part IV: 31-39
Part V: 21-30
Part VI: 11-20
Part VII: 6-10
Part VIII: 1-5


This week, I’m profiling the players who rank about 30-40 on my list. The players are ranked in order, but please don’t read too much into that: I consider this a group of quarterbacks, all roughly the same level. If you’re furious that #34 is higher than #37, you have my blessing to flip them.

39. Steve McNair
Houston/Tennessee Oilers/Titans, 1995-2005; Baltimore Ravens, 2006-07
31,304 yards, 174 TD, 119 INT, 82.8 rating

Mark Brunell, Rich Gannon, Jeff Garcia, and Steve McNair all played in the late ’90s and early ’00s, with low INT rates and excellent running. They’re easy to compare. The stats below include sacks:

QuarterbackAttYdsTDINTRatingNY/ARushYdsTD
Brunell503029,67718410884.05.90513242115
Gannon450827,05418010484.76.00521244921
Garcia385724,5901618387.56.38468214026
McNair479829,73717411982.86.20669359037

McNair has the lowest passer rating, but the most net yards (33,327) and the most total touchdowns (211). He and Brunell had the most good seasons, he and Gannon were named NFL MVP, and McNair stands alone as a playmaking scrambler. Only five players in NFL history have 30,000 passing yards and 3,000 rushing yards: John Elway, Donovan McNabb, Fran Tarkenton, Steve Young, and Steve McNair. As a dual-threat QB, McNair was one of the finest ever to play. His 64 rushing yards in Super Bowl XXXIV is the record for quarterbacks. [continue reading…]

{ 98 comments }

NVB loved to go deep

NVB loved to go deep

During the 2013 season, I crunched the numbers to determine that Chris Johnson was the career leader in average length of rushing touchdown (since then, his average has dropped to 25.8, allowing Robert Smith to regain the top spot). Last year, I did the same analaysis to show that Homer Jones is the career leader in average length of receiving touchdown. Today, we look at the average length of passing touchdowns for over a hundred quarterbacks.

The table below shows the average and median length of touchdown passes for each quarterback with at least 125 career passing touchdowns. Playoff touchdowns are included in this data set. Norm Van Brocklin is your career leader, although it is Otto Graham who is the leader in median touchdown length; as such, the Van Brocklin/Graham debate must rage on. [continue reading…]

{ 17 comments }

1-Yard TD Passes

The 2nd touchdown of Ken Stabler’s career came in mop up duty at the end of a blowout in 1972 against the Oilers. With the Raiders up 27-0 on Monday Night Football, Stabler threw a one-yard touchdown off of play-action late in the fourth quarter. [1]That was probably not the most memorable part of that broadcast.

A month later, Mike Ditka caught a 1-yard touchdown pass from Craig Morton to put the Cowboys up 24-0 against the Chargers in the first half. [2]Dallas would go up 31-0 before John Hadl (!) led a spirited second-half comeback that fell just short. In December, Denver’s Charley Johnson found Haven Moses for a 1-yard touchdown in the first half against the Chiefs.

Why am I reviewing some random 1-yard touchdown throws from 1972? Well, I’m not reviewing some random 1-yard touchdown passes from 1972; I just finished reviewing all of them. That’s right: there were just three touchdown passes of one yard in the entire 1972 season. [continue reading…]

References

References
1 That was probably not the most memorable part of that broadcast.
2 Dallas would go up 31-0 before John Hadl (!) led a spirited second-half comeback that fell just short.
{ 13 comments }

Quarterback Committees Trivia

This week, WorstQBCommiteesEver became a trending topic on twitter. There are lots of ways go about answering that question — using Relative ANY/A would be a good start — but that’s also kind of boring.

You know what was a really bad committee? The 2011 Colts. Curtis Painter started 8 games, Dan Orlovsky started 5, and Kerry Collins even chipped in with 3. You know all the numbers, but how’s this for a drive-it-home bullet: none of those three ever started another game again in the NFL.

Some really bad quarterback committees would fail this test, with the ’05 49ers being one of the more egregious examples. That team saw Cody Pickett started two games (0 future starts), Ken Dorsey started 3 (3 future starts), Tim Rattay start 4 (2 future starts), and Alex Smith start 7 (98-and-counting). The fact that Smith continued to get work and eventually turned into a competent starter shows the drawback of this method, but it doesn’t make it any less fun.

Less extreme would be the 1974 Falcons, with Bob Lee (8 starts, 5 future), Pat Sullivan (4, 1), and Kim McQuilken (2, and somehow 5). That team had an ANY/A of -0.02, yet McQuilken and Sullivan were back with Atlanta in ’75 (Lee’s future starts came during his general time as a backup with the Vikings). Or even the ’92 Seahawks, where Stan Gelbaugh (8 starts, 1 future), Kelly Stouffer (7, 0), and Dan McGwire (1 start, 3) split the duties for one of the worst offenses ever. But both Gelbaugh and McGwire would start for the Seahawks in future seasons.

I looked at all NFL teams from 1970 to 2012 [1]For example, the 2013 Rams would technically qualify as of today, but that doesn’t mean they meet the spirit of this post. Some cushion here is needed. where the main quarterback started less than 11 games. And, believe it or not, just four teams had a quarterback committee situation where none of those players ever started another game.

One, of course, is the 2011 Colts. The other 3? [continue reading…]

References

References
1 For example, the 2013 Rams would technically qualify as of today, but that doesn’t mean they meet the spirit of this post. Some cushion here is needed.
{ 12 comments }

Cam disingenuously listening to his head coach

Cam disingenuously listening to his head coach

Four years ago, I noted with some annoyance that the Carolina Panthers signed Olindo Mare to a 4-year, $12M deal, while at the same time signing Cam Newton to a 4-year, $22M contract. I was not a fan of the way rookies were treated under the new Collective Bargaining Agreement, and the Mare/Newton situation was a perfect example of the problem. With the new rookie wage scale, the NFL had taken money that was going to go into Newton’s pocket and placed it into the wallets of players like Mare.

Much of the outrage over what rookies made under the old Collective Bargaining Agreement was due to the fact that “unproven” players were making so much money. Even look at the comments to my old article: there are several who expressed the idea that proven players should get rewarded at the expense of unproven players, and Newton would benefit from that scenario once he became a proven player.

Well, that’s sort of true. I assume that most everyone would agree that Newton is now a “proven player” or else that is a term without any meaning. This week, Newton signed a five-year contract extension worth an additional $103.8 million. According to Over The Cap, Newton received a $22.5 million signing bonus and $7.5 million roster bonus upon signing the contract, and you can read Jason’s full article on Newton’s new contract here.

The contract extension Newton signed is pretty close to a “market value” contract for Newton, although I do think he’d make more on the open market than what he just received.  Newton’s leverage was slightly limited by the fact that Carolina had him under contract for $14.66M in 2015, and could use the franchise tag on him in ’16 (which would probably cost Carolina around $20M).

But the real issue is the lack of any “catch up” payment.  Newton lost real dollars on his rookie contract due to the new structure, and he’s never going to get to make those up. The rookie wage scale has always been B.S., and I’ve said so much from the moment it was instituted.  But the new system was, by some, argued as an improvement because only the “proven players” would be rewarded. Sure, a rookie might make less now, but he’d get to make more in the future. After all, if teams weren’t forced to pay so much to rookies, there would be more money to go around for the “proven” veterans, right?

But that logic doesn’t work once we look at Newton, who has been the Panthers most valuable player over the last four years, and will probably be the team’s most valuable player over the next six, too.  As a rookie, Newton was grossly underpaid, with a salary cap value of $4M while the salary cap was $120M.  As a result, Carolina was able to lock up Newton for just 3.3% of the cap, which enabled the team to overpay players like Mare.

In 2012, Newton’s cap hit only rose to $5M, or 4.2% of the cap.  In 2013, his cap hit became $6M, or 4.9% of the $123M cap.  And then last season, Newton’s contract reached $7M, which was 5.3% of the $133M cap. It goes without saying that the Panthers received quite a deal over the last four years.  On average, Carolina devoted 4.4% of its cap from ’11 to ’14 to Newton.  This season, he will cost the Panthers $13M salary cap dollars, or 9.1% of the cap.

Let’s assume that the salary cap will increase by $7.5M per year over each of the next five years. And let’s assume, naively, that Newton will play out his entire contract. [1]In reality, he will be cut if he under-performs and see less money, or likely restructure the deal with an extension towards years four or five if he is successful.  In that case, he will take up about 12-13% of the Panthers salary cap from ’16 to ’20.  But that still means that over his first ten seasons in the NFL, Newton will, on average, only take up about 9% of his team’s salary cap.

In the table below, I’ve shown Newton’s salary cap hit, the NFL salary cap, Newton’s percentage of the cap in that season, and Newton’s career average (in terms of percentage of cap hit) through that season. In each case, I’ve assumed a $7.5M yearly cap increase beginning in 2016. Here’s how to read the ’16 line: That year, Newton will have a cap hit of $19.5M, while the salary cap will be $150.8M. That means Newton will take up 12.9% of the Panthers cap, but will have only taken up, on average from 2011 to 2016, 6.6% of the Panthers cap dollars over the course of his career to date. As you can see from the last entry in the table, Newton — if he reaches the end of his contract — will only take up about 9% of the Panthers salary cap over the first decade of his career.

YearNewton CapNFL CapSingle Yr %Career Avg %
2011$4,004,636 $120,375,0003.3%3.3%
2012$5,005,795 $120,600,0004.2%3.7%
2013$6,006,954 $123,000,0004.9%4.1%
2014$7,008,113 $133,000,0005.3%4.4%
2015$13,000,000 $143,280,0009.1%5.3%
2016$19,500,000 $150,780,00012.9%6.6%
2017$20,166,000 $158,280,00012.7%7.5%
2018$21,500,000 $165,780,00013.0%8.2%
2019$23,200,000 $173,280,00013.4%8.7%
2020$21,100,000 $180,780,00011.7%9.0%

The $7.5M increase is just an estimate, but it works well enough for our purposes. If the salary cap continues to increase by about $10M per year, then that percentage will drop, but only to 8.8%. If instead the cap increases by an average of just $5M/year, Newton’s percentage will only rise to 9.3%. In other words, the Panthers will be able to lock up the first overall pick for a decade and pay him an average of just about 9% of the team’s salary cap.

Is that right? Well, that’s not the correct question to ask.  The correct question, I think, is “is that market?” And the answer there seems pretty clearly “no” to me.   If the number one pick is a quarterback who turns out to be a success and even he is only getting 9% of his team’s cap space over the first ten years of his career, that seems very out of whack with actual market value.

Perhaps nobody cares or will care, because why should people care whether Newton makes $140 million or $180 million? But I do think it’s worth recognizing that the NFL gas screwed over rookies with the new CBA, and part of the narrative was that it came with the promise that if those players weren’t busts, they could make up that money in their second contract.  Looking at Newton now, that doesn’t seem to be the case.  If a top draft pick is merely okay (but not a bust), a team will likely avoid having to pay serious dollars to that player, as it could always just replace him with a rookie at a fraction of the cost.  That’s the obvious downside to the rookie wage scale for veterans: cheaper replacement labor is now available. But there’s another downside to the rookie wage scale for veterans: even if that player turns out to be a success, he’ll only receive market value for about half of his first decade with the team, and he’ll always be chasing the dollars he lost.

Of course, everything above applies even more strongly to Russell Wilson. That will be another contract worth watching, but don’t expect the Seahawks to give Wilson a bump just because the team got to ride his low-salary contract for years.

References

References
1 In reality, he will be cut if he under-performs and see less money, or likely restructure the deal with an extension towards years four or five if he is successful.
{ 22 comments }

Yesterday, we looked at the career leaders in yards from scrimmage over “worst starter.” Today, let’s look at the single-season list.

Chris Johnson set the single-season record for yards from scrimmage in 2009, when he totaled an incredible 2,509 yards. But that’s not the record for YFS in a season on a per-game basis. That ranks only third in NFL history, behind O.J. Simpson in 1975 (not his more famous ’73 season) and Priest Holmes in 2002.

Holmes missed two games due to injury that season, while Simpson set his during a 14-game schedule. As it turns out, Simpson — who set the record for rushing yards over “worst starter” in 1973 — is your single-season yards from scrimmage over “worst starter” king based on his work in 1975.

In ’75, the 26th-ranked player in YFS gained 890 yards, while Simpson rushed for 1,817 yards and gained another 426 yards through the air. With a total of 2,243 yards from scrimmage, Simpson therefore gained 1,353 more yards than the “worst starter” or 1,546 more yards once we pro-rate to a 16-game season.

RkPlayerYearTmLgRush YdRec YdYFSTmsBaselineDiffLgGmPro-Rated
1O.J. Simpson1975BUFNFL18174262243268901353141546
2Walter Payton1977CHINFL18522692121288541267141448
3Chris Johnson2009TENNFL200650325093211571352161352
4Jim Brown1963CLENFL18632682131149671164141330
5O.J. Simpson1973BUFNFL2003702073269471126141287
6Marshall Faulk1999STLNFL1381104824293111471282161282
7LaDainian Tomlinson2003SDGNFL164572523703211081262161262
8Tiki Barber2005NYGNFL186053023903211461244161244
9Barry Sanders1997DETNFL205330523583011211237161237
10DeMarco Murray2014DALNFL184541622613210771184161184
11Otis Armstrong1974DENNFL14074051812267841028141175
12Eric Dickerson1984RAMNFL210513922442810701174161174
13Jamal Lewis2003BALNFL206620522713211081163161163
14Adrian Peterson2012MINNFL209721723143211541160161160
15James Wilder1984TAMNFL154468522292810701159161159
16Thurman Thomas1992BUFNFL14876262113289661147161147
17Marcus Allen1985RAINFL175955523142811691145161145
18Ahman Green2003GNBNFL188336722503211081142161142
19Le'Veon Bell2014PITNFL136185422153210771138161138
20Jim Brown1958CLENFL1527138166512817848121131
21Steven Jackson2006STLNFL152880623343212091125161125
22Harry Clarke1943CHINFL55653510911052956281124
23LaDainian Tomlinson2006SDGNFL181550823233212091114161114
24Arian Foster2010HOUNFL161660422203211091111161111
25Jim Brown1965CLENFL1544328187214909963141101
26Marshall Faulk1998INDNFL131990822273011301097161097
27Terrell Davis1998DENNFL200821722253011301095161095
28Emmitt Smith1992DALNFL17133352048289661082161082
29Barry Foster1992PITNFL16903442034289661068161068
30Lydell Mitchell1977BALNFL1159620177928854925141057
31Deuce McAllister2003NORNFL164151621573211081049161049
32Barry Sanders1994DETNFL188328321662811271039161039
33Jamal Anderson1998ATLNFL184631921653011301035161035
34Eric Dickerson1983RAMNFL180840422122811921020161020
35Beattie Feathers1934CHINFL100417411781148369510.91019
36Don Hutson1942GNBNFL41211121510515700111018
37Thurman Thomas1991BUFNFL140763120382810201018161018
38Priest Holmes2001KANNFL155561421693111601009161009
39Priest Holmes2003KANNFL142069021103211081002161002
40Chuck Foreman1975MINNFL107069117612689087114995
41Edgerrin James1999INDNFL1553586213931114799216992
42Priest Holmes2002KANNFL1615672228732129699116991
43Larry Johnson2006KANNFL1789410219932120999016990
44Marshall Faulk2001STLNFL1382765214731116098716987
45Jim Brown1964CLENFL144634017861492386314986
46Edgerrin James2000INDNFL1709594230331131798616986
47William Andrews1983ATLNFL1567609217628119298416984
48Walter Payton1984CHINFL1684368205228107098216982
49Charley Hennigan1961HOUAFL017461746888885814981
50Garrison Hearst1998SFONFL1570535210530113097516975
51Frank Gore2006SFONFL1695485218032120997116971
52Lydell Mitchell1975BALNFL119354417372689084714968
53Earl Campbell1980HOUNFL193447198128101896316963
54Elroy Hirsch1951RAMNFL3149514981277772112961
55Lenny Moore1958BALNFL59893815361281771912959
56O.J. Simpson1976BUFNFL150325917622893183114950
57LeSean McCoy2013PHINFL1607539214632119794916949
58Larry Johnson2005KANNFL1750343209332114694716947
59Lydell Mitchell1976BALNFL120055517552893182414942
60Wilbert Montgomery1979PHINFL1512494200628106993716937
61Eric Dickerson1988INDNFL1659377203628110293416934
62Roger Craig1988SFONFL1502534203628110293416934
63Brian Westbrook2007PHINFL1333771210432117293216932
64Jim Brown1961CLENFL1408459186714105381414930
65Eric Dickerson1986RAMNFL1821205202628110092616926
66Emmitt Smith1995DALNFL1773375214830122492416924
67Ricky Williams2002MIANFL1853363221632129692016920
68Tiki Barber2006NYGNFL1662465212732120991816918
69Herschel Walker1988DALNFL1514505201928110291716917
70Terrell Davis1997DENNFL1750287203730112191616916
71Chet Mutryn1948BUFAAFC8237941617882379414907
72Billy Sims1980DETNFL1303621192428101890616906
73Chuck Foreman1976MINNFL115556717222893179114904
74Lorenzo White1992HOUNFL122664118672896690116901
75Ray Rice2011BALNFL1364704206832117189716897
76Roger Craig1985SFONFL10501016206628116989716897
77Emmitt Smith1993DALNFL1486414190028100689416894
78Tiki Barber2004NYGNFL1518578209632120689016890
79William Andrews1981ATLNFL1301735203628114788916889
80Ray Rice2009BALNFL1339702204132115788416884
81Larry Brown1972WASNFL121647316892691877114881
82Walter Payton1978CHINFL139548018752899887716877
83LaDainian Tomlinson2002SDGNFL1683489217232129687616876
84Marshall Faulk2000STLNFL1359830218931131787216872
85John David Crow1960STLNFL107146215331388365012867
86Gene Roberts1949NYGNFL63471113451069664912865
87Walter Payton1985CHINFL1551483203428116986516865
88Marcus Allen1984RAINFL1168758192628107085616856
89Frank Gifford1956NYGNFL81960314221278064212856
90Walter Payton1979CHINFL1610313192328106985416854
91Ottis Anderson1979STLNFL1605308191328106984416844
92Jim Benton1945RAMNFL0106710671054352410838
93Lawrence McCutcheon1974RAMNFL110940815172678473314838
94Walter Payton1983CHINFL1421607202828119283616836
95Barry Sanders1991DETNFL1548307185528102083516835
96Fred Taylor2003JAXNFL1572370194232110883416834
97Don Woods1974SDGNFL116234915112678472714831
98Jamaal Charles2010KANNFL1467468193532110982616826
99Edgerrin James2004INDNFL1548483203132120682516825
100Tony Dorsett1981DALNFL1646325197128114782416824
101Ahman Green2001GNBNFL1387594198131116082116821
102Ron Johnson1972NYGNFL118245116332691871514817
103Gerald Riggs1985ATLNFL1719267198628116981716817
104Marcus Allen1982RAINFL6974011098286394599816
105Shaun Alexander2005SEANFL188078195832114681216812
106Calvin Johnson2012DETNFL01964196432115481016810
107Maurice Jones-Drew2011JAXNFL1606374198032117180916809
108Walter Payton1980CHINFL1460367182728101880916809
109Thurman Thomas1990BUFNFL1297532182928102180816808
110Greg Pruitt1977CLENFL108647115572885470314803
111Emmitt Smith1991DALNFL1563258182128102080116801
112Clinton Portis2003DENNFL1591314190532110879716797
113Gale Sayers1966CHINFL123144716781598469414793
114Thurman Thomas1989BUFNFL1244669191328112478916789
115Don Hutson1944GNBNFL87866953115054489.1788
116Jamaal Charles2013KANNFL1287693198032119778316783
117Clem Daniels1963OAKAFL109968517848110168314781
118LaDainian Tomlinson2007SDGNFL1474475194932117277716777
119William Andrews1982ATLNFL5735031076286394379777
120Wilbert Montgomery1981PHINFL1402521192328114777616776
121Herschel Walker1987DALNFL89171516062888172515773
122Doug Martin2012TAMNFL1454472192632115477216772
123Jim Brown1960CLENFL125720414611388357812771
124Jim Brown1959CLENFL132919015191294257712769
125Matt Forte2014CHINFL1038808184632107776916769
126Barry Sanders1990DETNFL1304480178428102176316763
127Adrian Peterson2008MINNFL1760125188532112576016760
128Wes Chandler1982SDGNFL3210321064286394259756
129Ricky Watters1996PHINFL1411444185530110075516755
130Lawrence McCutcheon1977RAMNFL123827415122885465814752
131Billy Hillenbrand1948BCLAAFC5109701480882365714751
132Terrell Davis1996DENNFL1538310184830110074816748
133William Andrews1980ATLNFL1308456176428101874616746
134Chris Warren1994SEANFL1545323186828112774116741
135Billy Sims1981DETNFL1437451188828114774116741
136Bill Brown1964MINNFL86670315691492364614738
137Charley Taylor1964WASNFL75581415691492364614738
138Billy Cannon1961HOUAFL9485861534888864614738
139Matt Forte2013CHINFL1339594193332119773616736
140Curtis Martin2004NYJNFL1697245194232120673616736
141Rick Casares1956CHINFL112620313291278054912732
142Timmy Brown1965PHINFL86168215431490963414725
143Curt Warner1986SEANFL1481342182328110072316723
144Earl Campbell1979HOUNFL169794179128106972216722
145Ron Johnson1970NYGNFL102748715142688363114721
146Steve Van Buren1949PHINFL11468812341069653812717
147Ottis Anderson1984STLNFL1174611178528107071516715
148Terry Allen1992MINNFL120147816792896671316713
149Andy Farkas1939WASNFL5474379841049648811710
150Brian Westbrook2006PHINFL1217699191632120970716707
151Tony Dorsett1978DALNFL132537817032899870516705
152Abner Haynes1962DTXAFL104957316228100961314701
153Jim Benton1946RAMNFL09819811050148011698
154Emmitt Smith1994DALNFL1484341182528112769816698
155Edgerrin James2005INDNFL1506337184332114669716697
156Thurman Thomas1993BUFNFL1315387170228100669616696
157Walter Payton1976CHINFL139014915392893160814695
158Gerald Riggs1984ATLNFL1486277176328107069316693
159Tiki Barber2002NYGNFL1387597198432129668816688
160LaDainian Tomlinson2005SDGNFL1462370183232114668616686
161Jim Taylor1964GNBNFL116935415231492360014686
162Dorsey Levens1997GNBNFL1435370180530112168416684
163Cliff Battles1933BOSNFL7371859221043548711.4684
164Marshall Faulk1994INDNFL1282522180428112767716677
165Barry Sanders1995DETNFL1500398189830122467416674
166Curtis Martin2001NYJNFL1513320183331116067316673
167James Brooks1986CINNFL1087686177328110067316673
168Arian Foster2011HOUNFL1224617184132117167016670
169Leroy Kelly1968CLENFL123929715361695258414667
170Ray Rice2010BALNFL1220556177632110966716667
171Jerome Bettis1993RAMNFL1429244167328100666716667
172Larry Brown1970WASNFL112534114662688358314666
173Adrian Peterson2009MINNFL1383436181932115766216662
174Chuck Foreman1974MINNFL77758613632678457914662
175Cliff Battles1937WASNFL874819551050145411660
176Shaun Alexander2004SEANFL1696170186632120666016660
177Jerry Rice1995SFONFL361848188430122466016660
178Johnny Strzykalski1948SFOAAFC9154851400882357714659
179Steve Van Buren1945PHINFL8321239551054341210659
180Charles White1987RAMNFL137412114952888161415655
181Jerome Bettis1997PITNFL1665110177530112165416654
182George Rogers1981NORNFL1674126180028114765316653
183Jim Nance1966BOSAFL14581031561999057114653
184Dalton Hilliard1989NORNFL1262514177628112465216652
185Franco Harris1975PITNFL124621414602689057014651
186Barry Sanders1998DETNFL1491289178030113065016650
187Joe Morris1986NYGNFL1516233174928110064916649
188Chuck Foreman1977MINNFL111230814202885456614647
189Eddie George2000TENNFL1509453196231131764516645
190Ottis Anderson1980STLNFL1352308166028101864216642
191Jim Musick1933BOSNFL809788871043545211.4634
192Delvin Williams1976SFONFL120328314862893155514634
193Antonio Brown2014PITNFL131698171132107763416634
194Mark van Eeghen1977OAKNFL127313514082885455414633
195Marshawn Lynch2012SEANFL1590196178632115463216632
196Barry Sanders1989DETNFL1470282175228112462816628
197Shaun Alexander2003SEANFL1435295173032110862216622
198Lawrence McCutcheon1976RAMNFL116830514732893154214619
199Charlie Garner1999SFONFL1229535176431114761716617
200Eric Dickerson19872TMNFL128817114592888157815617
201Ottis Anderson1981STLNFL1376387176328114761616616
202Spec Sanders1947NYYAAFC1432131445890653914616
203Michael Turner2008ATLNFL169941174032112561516615
204Ricky Williams2003MIANFL1372351172332110861516615
205Eddie George1999TENNFL1304458176231114761516615
206Walter Payton1986CHINFL1333382171528110061516615
207Barry Sanders1992DETNFL135222515772896661116611
208Otis Armstrong1976DENNFL100845714652893153414610
209Ted Brown1981MINNFL1063694175728114761016610
210Maurice Jones-Drew2009JAXNFL1391374176532115760816608
211Billy Sims1982DETNFL639342981286393429608
212Charlie Garner2002OAKNFL962941190332129660716607
213Sam Cunningham1977NWENFL101537013852885453114607
214O.J. Simpson1972BUFNFL125119814492691853114607
215Jim Taylor1962GNBNFL1474106158014104953114607
216O.J. Simpson1974BUFNFL112518913142678453014606
217Barry Sanders1996DETNFL1553147170030110060016600
218Leroy Kelly1966CLENFL114136615071598452314598
219Mike Pruitt1979CLENFL1294372166628106959716597
220Marshawn Lynch2014SEANFL1306367167332107759616596
221Ricky Williams2001NORNFL1245511175631116059616596
222Billy Howton1952GNBNFL0123112311278444712596
223Freeman McNeil1982NYJNFL786187973286393349594
224Torry Holt2003STLNFL51696170132110859316593
225Jamaal Charles2012KANNFL1509236174532115459116591
226Lydell Mitchell1974BALNFL75754413012678451714591
227Matt Forte2008CHINFL1238477171532112559016590
228Freeman McNeil1985NYJNFL1331427175828116958916589
229Joe Perry1954SFONFL104920312521281144112588
230Mack Herron1974NWENFL82447412982678451414587
231Tony Dorsett1985DALNFL1307449175628116958716587
232Clinton Portis2005WASNFL1516216173232114658616586
233Mike Thomas1975WASNFL91948314022689051214585
234Neal Anderson1989CHINFL1275434170928112458516585
235Abner Haynes1961DTXAFL8415581399888851114584
236Curt Warner1983SEANFL1449325177428119258216582
237Joe Cribbs1980BUFNFL1185415160028101858216582
238Steven Jackson2009STLNFL1416322173832115758116581
239Clinton Portis2008WASNFL1487218170532112558016580
240Hoyle Granger1967HOUAFL11943001494998750714579
241Tony Dorsett1984DALNFL1189459164828107057816578
242Clinton Portis2002DENNFL1508364187232129657616576
243Curtis Martin1999NYJNFL1464259172331114757616576
244Napoleon Kaufman1997OAKNFL1294403169730112157616576
245Tom Tracy1958PITNFL71453512491281743212576
246Don Hutson1943GNBNFL41776817105292888576
247Isaac Bruce1995STLNFL171781179830122457416574
248Floyd Little1971DENNFL113325513882688650214574
249Steve Owens1971DETNFL103535013852688649914570
250LaDainian Tomlinson2004SDGNFL1335441177632120657016570
251Domanick Williams2004HOUNFL1188588177632120657016570
252Lenny Moore1960BALNFL37493613101388342712569
253Tiki Barber2003NYGNFL1216461167732110856916569
254Jerry Rice1993SFONFL691503157228100656616566
255Joe Washington1979BALNFL884750163428106956516565
256Bobby Mitchell1963WASNFL24143614601496749314563
257LeSean McCoy2010PHINFL1080592167232110956316563
258Don Hutson1945GNBNFL608348941054335110562
259Leroy Kelly1967CLENFL120528214871699649114561
260Lenny Moore1957BALNFL48868711751275741812557
261Bob Margarita1945CHINFL4973948911054334810557
262Darren McFadden2010OAKNFL1157507166432110955516555
263Calvin Hill1973DALNFL114229014322694748514554
264Raymond Berry1960BALNFL0129812981388341512553
265Joe Cribbs1981BUFNFL1097603170028114755316553
266Robert Smith2000MINNFL1521348186931131755216552
267Calvin Hill1972DALNFL103636414002691848214551
268Lance Alworth1965SDGAFL-12160215908110848214551
269C.J. Spiller2012BUFNFL1244459170332115454916549
270Don Hutson1939GNBNFL268468721049637611547
271Steve Van Buren1947PHINFL10087910871067741012547
272John Riggins1975NYJNFL100536313682689047814546
273Peyton Hillis2010CLENFL1177477165432110954516545
274Greg Pruitt1975CLENFL106729913662689047614544
275Billy Howton1956GNBNFL0118811881278040812544
276Demaryius Thomas2014DENNFL01619161932107754216542
277Randy Moss2003MINNFL181632165032110854216542
278Jerry Rice1986SFONFL721570164228110054216542
279Neal Anderson1990CHINFL1078484156228102154116541
280Ricky Watters2000SEANFL1242613185531131753816538
281Tony Reed1978KANNFL105348315362899853816538
282Tom Matte1969BALNFL90951314221695247014537
283Josh Gordon2013CLENFL881646173432119753716537
284Ottis Anderson1983STLNFL1270459172928119253716537
285Alfred Morris2012WASNFL161377169032115453616536
286Bob Boyd1954RAMNFL0121212121281140112535
287Steve Slaton2008HOUNFL1282377165932112553416534
288Wendell Tyler1982RAMNFL564375939286393009533
289Maurice Jones-Drew2010JAXNFL1324317164132110953216532
290Corey Dillon2004NWENFL1635103173832120653216532
291Art Malone1972ATLNFL79858513832691846514531
292Gale Sayers1965CHINFL86750713741490946514531
293Don Maynard1967NYJAFL1814341452998746514531
294Jim Brown1962CLENFL996517151314104946414530
295Adrian Peterson2010MINNFL1298341163932110953016530
296Clem Daniels1966OAKAFL8016521453999046314529
297Mike Thomas1976WASNFL110129013912893146014526
298MacArthur Lane1970STLNFL97736513422688345914525
299Curtis Martin1995NWENFL1487261174830122452416524
300Curtis Martin1998NYJNFL1287365165230113052216522
  • Walter Payton and Barry Sanders lead the way with 9 seasons apiece in the top 300, although as you learned yesterday, Payton still has a big edge over Sanders. That’s because of the top 10 seasons by the duo (all in the top 125), 7 came from Payton.
  • O.J. Simpson has two top-5 seasons; no one else has two in the top 15. Jim Brown has three top-25 seasons; no one else has three in the top 40, and Priest Holmes and Marshall Faulk are the only others with three top-50 seasons. Brown is the only player with 4 top-50 seasons; and Eric Dickerson is the only other player with four top-75 seasons. Brown has five top-65 seasons; Payton is the only other player with five top-100 seasons (next is Emmitt Smith, whose fifth best season is all the way down at 154). But that’s when Brown passes the baton to Payton: the Bears legend has six top-100 seasons, which nobody else can match (Brown’s 6th best year was #123).
  • The Texans have four seasons in the top 300, which puts the following in some perspective. The Bengals have just one season — James Brooks, 1986 — in the top 300. Brooks ranked 3rd in yards from scrimmage that season, the only time any Bengal has ever ranked in the top 3 in that category. The Dolphins have just two top-300 seasons: Ricky Williams in ’02 and ’03. In fact, the single-season YFS leaders for Miami is just a really weird-looking list. Tampa Bay also has just two top-300 seasons, and only two times when a player gained 1,650 or more yards from scrimmage.
{ 13 comments }

Last week, we looked at the career leaders in rushing yards over worst starter; today, we use the same methodology but with yards from scrimmage. Let’s use Walter Payton’s 1977 season as an example.

That season, the NFL had 28 teams, and the 28th-ranked player in yards from scrimmage gained 854 yards.  But Payton, in his best season as a pro, rushed for 1,852 yards and picked up another 269 yards through the air, for a total of 2,121 yards from scrimmage.  That gave him 1,267 yards above the baseline of “worst starter.”  But remember, in ’77, the NFL had a 14-game schedule; pro-rate that to 16 games, and Peyton is credited with 1,448 yards over the baseline.  That’s the 2nd best season ever by this formula.

While 1977 was by far Payton’s best year, he dominated in this metric for most of his career, posting the 48th, 82nd, 87th, 90th, 94th, 108th, and 157th best seasons. And while Emmitt Smith finally edged past Payton on the career yards from scrimmage last in the final games of his career, Payton has a big edge in this metric because we are removing “junk” seasons. In fact, Payton has a big edge over just about everyone. Nobody forgets about Walter Payton, of course, but I wonder if sometimes his dominance in this metric is overlooked: he led the NFL in YFS in ’77 and ’78, then finished 2nd in the category in ’79. He ranked 3rd in YFS in ’80 and in ’83, ’84, and ’85. Add in a 4th-place finish in ’76 and a 5th-place in ’86, and that gives Payton a whopping 9 finishes in the top 5 in yards from scrimmage.

If we use the methodology described above for every season of a player’s career, we get what I think is a better version of the career yards from scrimmage leaders (at least for running backs) because we are removing junk seasons. Below are the career grades for the top 200 players (note that by default, the table only displays the top 25). I have also listed for each back his career yards from scrimmage and his rank in that category. [continue reading…]

{ 35 comments }

Brad Oremland is a longtime commenter and a fellow football historian. Brad is also a senior NFL writer at Sports Central. There are few who have given as much thought to the history of quarterbacks and quarterback ranking systems as Brad has over the years. What follows is Brad’s latest work on the greatest quarterbacks of all time.

Part I: Pre-Modern Era
Part II: 49-101
Part III: 40-48
Part IV: 31-39
Part V: 21-30
Part VI: 11-20
Part VII: 6-10
Part VIII: 1-5


This week, I’m profiling the players who rank about 40-48 on my list, in alphabetical order:

Charlie Conerly
New York Giants, 1948-61
19,488 yards, 173 TD, 167 INT, 68.2 rating

The hype was always there for Chuck Conerly. He was a star at Ole Miss, and he was the Giants’ quarterback when they were the only team in New York. Playing for a coaching staff that included Tom Landry and Vince Lombardi, alongside Hall of Fame players like Rosey Brown, Frank Gifford, Sam Huff, Andy Robustelli, and Emlen Tunnell, Conerly was set up for success. The Giants were competitive every season, and they won an NFL championship in 1956. [continue reading…]

{ 11 comments }

On Friday, I looked at the career rushing leaders in “yards over worst starter.” Today, let’s look at the single-season list.

In 1963, Jim Brown rushed for 1,863 yards in a 14-team NFL. The baseline that year was 541 yards, which represents the 14th highest individual rushing total that year. So Brown exceeded that number by a whopping 1,322 rushing yards. Given that 1963 was a 14-game NFL season, that translates to a pro-rated value of 1,511 yards, the third best ever. The table below shows the top 300 single seasons. [continue reading…]

{ 2 comments }