≡ Menu

Previously:

Buffalo and Jacksonville played a remarkably run-heavy game in week 12. The two teams combined for 393 rushing yards and just 267 passing yards. That means 59.5% of the total yards in this game came on the ground, making it the first time in a non-December game since 2012 that such a high percentage of yards came on the ground. Josh Allen had 101 yards on the ground prior to kneels, and Blake Bortles added 39 yards rushing.  These are two of the best running quarterbacks in the league, although the Bortles experiment may be ending in Jacksonville.

If this is the end for Bortles, he won’t be remembered as one of the best running quarterbacks ever, but perhaps he should be. He’s one of just six players in NFL history to average over 6 yards per carry and 20 rushing yards per game in his career (minimum 200 carries): [continue reading…]

{ 0 comments }

Checkdowns: Appearance on The Bill Barnwell Show Podcast

You can hear me on the Bill Barnwell podcast today discussing this article on why possession in the NFL matters more now than ever before, but first, you have to hear me talk about the 2018 Jets.

Listen here

Or on iTunes

My segment begins at 29:25.

{ 0 comments }

In 2008, Philip Rivers average 8.04 ANY/A, the best rate in the NFL.  This season, Rivers is averaging 8.96 ANY/A, and yet he ranks just fourth in that metric in 2018. That’s a sign of how far the passing environment has changed in the last decade.

Drew Brees led the NFL in ANY/A in 2009 with an 8.31 average; he’s currently having his best statistic season (without adjusting for era), with a 9.69 ANY/A average that would rank as the second best of the modern era.  He is the frontrunner in the MVP race, and for good reason: his team has the best record in football and he leads all QBs in ANY/A, a double feature that would surely lock up the MVP crown if it is still true by the end of the year.

Below are the season to date passing stats. [continue reading…]

{ 0 comments }

Marcus Mariota went 22/23 against the Texas and he averaged 13.2 yards per attempt. That sounds like it should be one of the great games in NFL history. So how come the Titans scored just 17 points and lost despite such a high completion percentage and no turnovers until the team’s final offensive play? Tennessee even set a new record for completion percentage in a loss! One reason is that the team punted six times, and you might be wondering how is that even possible to have 6 times as many punts as incompletions.

For starters, Mariota took a whopping 6 sacks, a 21% sack rate. And 7 of Mariota’s 22 completions were negative plays according to EPA. That includes three obvious ones: a 4-yard completion on 3rd-and-19, a 7-yard completion on 3rd-and-9, and a 7-yard completion on 3rd-and-8. (Tennessee went for it on 4th-and-1 after that, but failed; the other four failed third down plays that yielded to punts were two Mariota sacks, a Mariota scramble for 8 yards on 3rd-and-16 after another Mariota sack, and a rushing play on 3rd-and-29 following a 15-yard facemask penalty and yet another sack.) But there was also a 2-yard pass on 1st-and-10, a -1 yard completion on 2nd down, a 2-yard completion on 2nd-and-10, and even a 3-yard completion on 2nd-and-5 is considered a negative play (you’d rather re-do the down than take a 3-yard gain on 2nd-and-5). All of the sudden, Mariota’s 22/23 game turns into 15 positive completions on 29 dropbacks, which is a far different story. That’s still a good game, but not a great one, much less an all-time great one.

Mariota finished with the 5th-best performance of the week; below are your week 12 passing stats. [continue reading…]

{ 1 comment }

The college football regular season is over, with the exception of Army/Navy in two weeks. Below are the final ratings prior to the conference championship games: [continue reading…]

{ 0 comments }

Why Field Goals Are Less Valuable Than They Used To Be

Nearly two decades ago, David Romer analyzed data from games during the 1999, 2000, and 2001 seasons. Doug Drinen wrote a series of articles about his paper, and one of Doug’s key takeaways was that the value of possession following a kickoff was worth +0.6 points to the receiving team. The natural extension of this is that it means a touchdown is worth 6.4 points and a field goal worth 2.4 points. That also means that a touchdown isn’t just 2.33 times (7 divided by 3) as valuable as a field goal, but 2.67 times as valuable.

Now how did Romer derive that value of +0.6 points? Or, as Doug wrote, what does it mean to say that it is worth +0.5 points to the team with the ball to have 1st-and-10 at your own 20?

The half-a-point value of a first at the 20 includes not only the points that you might score on that drive, but also the points your opponent might score with the field position you’re likely to give them if you don’t score, and the points you’re likely to score with the field position they give you after they do or don’t score, and so on.

But we don’t need to go into the fine details of the system to get to what I want to talk about today. And that is possession has never been more valuable in the NFL. [1]One other reason: teams are better at making field goals, including from very far away, which means getting into likely field goal range requires less yardage than it used to for the offense.

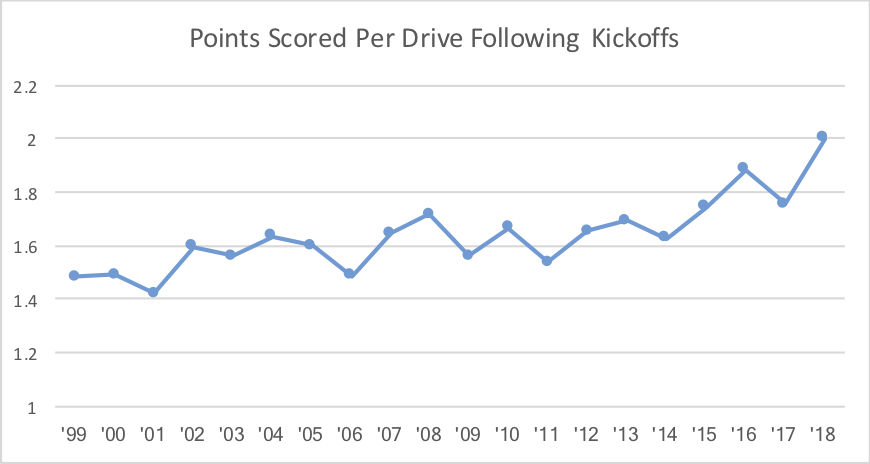
The graph below shows the average points scored by the receiving team following a kickoff in each season since 1999. Note that this includes all quarters (Romer’s study was mostly limited to the first quarter) and all teams, and only includes points scored by the receiving team (Romer’s study focuses on net points (meaning points scored by the kicking team on the ensuing possession), so the numbers are of course lower). But the key is that teams are scoring more points after kickoffs than they did in the early ’00s.


[continue reading…]

References

References
1 One other reason: teams are better at making field goals, including from very far away, which means getting into likely field goal range requires less yardage than it used to for the offense.
{ 1 comment }

How to Calculate Drive Success Rate

Every 1st down represents a new set of downs that gives a team a chance another small battle against the defense.

Take the Saints, for example. How many 1st-and-10s (or 1st-and-goals or 1st-and-longer than 10s) have they had this year? By my count, 339. How did I get there? New Orleans has had 105 drives this year (more on that in a moment) and 282 first downs this year. Now remember that in the NFL, a touchdown is also a first down, and the Saints offense has scored 48 touchdowns this year. Therefore, New Orleans has recorded 234 non-scoring first downs. Add in the 105 1st downs that began every drive, and this means the Saints must have had 339 sets of downs this season.

Let’s look at the Jets for another example. New York has had 126 drives, 153 first downs, and 18 offensive touchdowns. Therefore, the Jets must have had 261 new sets of downs with which to operate.  This methodology should be a pretty accurate way of capturing the number of new sets of downs a team has, although it may be off by 1 or 2 for some teams. (For example, the Jets are probably at 260, not 261; one drive began with an interception but Trumaine Johnson fumbled the return.) You can’t use the actual number of first down plays, because teams often have multiple first down plays due to penalties on the same set of downs (think of a 1st-and-10 where a rusher gains 4 yards and a holding is called, and a team then has a 1st-and-16).

So to calculate the number of sets of downs a team has, you use this formula:

Drives + First Downs Made – Touchdowns

Now how do we calculate the number of drives? That’s pretty simple using the PFR Play Index.

Remember from our work on estimated drives, every drive ends in one of seven ways: [continue reading…]

{ 1 comment }

In 2017, Indianapolis ranked 30th in points and 31st in yards. The Colts also ranked 29th in Net Yards per Attempt and 31st in touchdown passes.

This year, with Andrew Luck back, the Colts rank 5th in points and 9th in yards, while ranking 13th in NY/A and 2nd in touchdown passes. No offense has improved more from 2017 to 2018 than the Colts, and Luck is a big reason why.

Early on this season, it looked like there was something wrong with Luck; through 3 games, he was averaging just 5.34 yards per attempt! Since then, he’s upped his average to 7.63 yards per attempt; that’s actually below the median over that time frame, but coupled with his stellar sack rate and remarkable TD/INT numbers, and he’s been a very valuable quarterback over the last two months.

There are three remarkable Luck numbers this season, but chances are you have only heard of two of them. The Colts star has now gone five straight games without a sack, making him just the 5th player since 1981 to go five straight games with 20+ pass attempts and zero sacks. And Luck has thrown at least 3 touchdown passes in seven straight games, a feat that puts him in even rarer company.

But perhaps the biggest reason for the Colts success right now is how excellent Luck has been on third downs. On average, teams have picked up a first down on 36.9% of all third down pass plays this year. Luck has done it at a rate of 51.9%, making him the most valuable third down passer this season. [continue reading…]

{ 0 comments }

Previously:

In week 11, the Ravens turned to Lamar Jackson, and responded with one of the most run-heavy games in recent memory. Baltimore rushed a whopping 54 times, the most in a non-overtime game since 2014. Jackson himself was responsible for half of those carries, 5 more than any player with at least five pass attempts in a game since 1950.

Not surprisingly, the Ravens dominated time of possession in this game, holding the ball for over 38 minutes. Jackson was an effective enough passer: he picked up a first down on 7 of 21 dropbacks, which is league average. We’ll see if this strategy can work for Baltimore once again — a quarterback running 15 times a week feels unsustainable, let alone 27 — but it certainly makes the Ravens more interesting.

Arizona and Jacksonville were your most run-heavy teams of the week. Leonard Fournette had 28 carries for the Jaguars, and the team rushed on 35.8% of all plays.  For the Cardinals, David Johnson had 25 carries, and Arizona had just 21 dropbacks, despite trailing for much of the second half.

The full week 11 Game Scripts below: [continue reading…]

{ 0 comments }

The Least-Conforming Game of 2018 Might Surprise You

There have been two really remarkable upsets this season: one at the time, and one particularly in retrospect.

In week 3, the Bills went on the road and hammered the Minnesota Vikings, 27-6. Buffalo was a 16.5-point underdog; this season, no other team has won a game as an underdog of more than 10 points. It was an anomaly of historic proportions, marking the first time a team was ever a 15-point underdog and won by 15 or more points.

The other remarkable game was in week 1, when the Saints lost at home to Tampa Bay. The Bucs are 2-7 since that game, while New Orleans is 9-0. So while it was a huge upset at the time — it is tied with Titans/Jaguars as the second biggest upset of the season (10-point spread) — it’s even more remarkable in retrospect. [continue reading…]

{ 0 comments }

Week 11 Passing Stats: The Stars Shine

The top 5 passers of week 11 consist of the three best QBs this season — Drew Brees, Patrick Mahomes, and Jared Goff — and the two quarterbacks who, at various times, have been considered the most valuable quarterback assets in the league: Andrew Luck and Aaron Rodgers.

Brees had zero sacks and zero interceptions while averaging over 12 yards per pass attempt and throwing for 4 TDs, making him the best passer of the week. Luck also had no sacks or interceptions, averaged over 10 yards per attempt, and threw 3 TDs. Rodgers averaged 11 yards per attempt and threw a pair of touchdowns, but his 5 sacks knocked him down below Luck. Mahomes had 478 yards and 6 TDs, but also 3 INTs and 3 sacks. Still, he averaged over 10 yards per attempt and threw 6 TD. It’s kind of a quirky stat, but Mahomes had by far the best passer rating in NFL history among players with at least 3 INTs in a game. Jared Goff took 5 sacks, but threw no interceptions and threw for 413 yards and 4 TDs.

The average ANY/A in week 11 was 6.24, making it a below-average week by 2018 standards. Below are the week 11 passing stats: [continue reading…]

{ 0 comments }

Reid looks up at the scoreboard and sees more points

Tonight is one of the games of the year: the 9-1 Chiefs against the 9-1 Rams. This is perhaps the best regular season game, by record, since another primetime game featuring Andy Reid’s Chiefs back in 2013, when the 9-0 Chiefs traveled to Denver to face the 8-1 Broncos.

Back then, I wrote about the best regular season matchups ever. And I’ve also written about the worst regular season matchups ever. And to be clear, there’s no right or wrong way to identify the best or worst matchup ever, even if you just base things on record.

You can’t use just winning percentage, because it’s hard to compare teams who have played a different number of games (is a matchup of two 3-0 teams better than a matchup of two 9-1 teams? I don’t think so, but winning percentage says otherwise). One solution is to add 11 games of .500 football to each team; in other words, add 5.5 wins and 5.5 losses to each team. For the Chiefs and Rams, that would make both teams 14.5-6.5, which translates to an adjusted winning percentage for both Kansas City and Los Angeles of 0.690. A game between two 3-0 teams would have an average adjusted winning percentage of only 0.607, which is one reason why I like this formula.

So where does Rams/Chiefs rank? With all due respect to the classic 49ers/Browns games from 1948, I’m limiting today’s post to games since 1950. And tonight’s matchup is the 20th best game during that period. The table below shows the best matchups in the NFL since 1950. Each game is listed from the perspective of the winner, and displays each team’s each team’s adjusted winning percentage and the average of the two adjusted records. Finally, I’ve included a linkable boxscore to each game. [continue reading…]

{ 0 comments }

Ohio State has beaten Michigan 13 times in the last 14 years. And the only time since 2003 that Michigan beat Ohio State was in 2011, when the Buckeyes were 6-6 and in the bridge year between Jim Tressel and Urban Meyer. And Ohio State nearly pulled off the upset!

For a rivalry known as The Game, it’s been remarkably one-sided for a long time: the last time Michigan beat an Ohio State team of any note, Santonio Holmes and Braylon Edwards were the stars of the game. It’s been awhile.

And yet, this year, both teams are likely in control of their own destiny. The winner of Saturday’s matchup will win the Big 10 East, and head to Indianapolis to face Northwestern in the Big 10 title game. A win there all but guarantees a playoff spot for a 12-1 Michigan team, and a 12-1 Ohio State team would be a favorite to make the college football playoff, too.

Here’s how I’d rank each team’s chances of being one of the four to make the College Football Playoff. Read it as such: keep going down the list until you find four teams that actually exist.

1. SEC Champion Alabama
2. ACC Champion Clemson
3. SEC Champion Georgia
4. 12-0 Notre Dame
5. B10 Champion Michigan

—– Those 5 teams are all “win out and they’re in”, although I note that if Georgia narrowly beats Alabama in an epic SEC Championship Game, there will be some murmurs to take an 12-1 Alabama over a 12-1 Michigan. Both teams will have lost to two playoff teams (Georgia, Notre Dame), and Alabama had been more dominant throughout the season. But the committee seems to value conference championships pretty highly, so I think they would go with Michigan.

6. 12-1 Bama (losing in the SEC Championship Game)
7. 12-1 Big 10 Champion Ohio State
8. 12-1 Big 12 Champion Oklahoma

—– This is the real pressure point for the committee: do you take a 12-1 Ohio State over a 12-1 Oklahoma? The Buckeyes have a much, much worse loss and arguably a tougher schedule. Oklahoma is, subjectively, a better team, too. But the Big 10 has been the better conference this season, and my gut is the committee would take Ohio State at 12-1 over Oklahoma at 12-1. I’d go the other way.

9. 12-1 Pac-12 Champion Washington State

—– Last year, the Pac-12’s best team was USC, and the Trojans playoff hopes were dashed with a Friday night loss on the road against Washington. This year, the Pac-12’s best team is Washington State, and the conference’s best chance to send a team to the playoff was crushed by a Friday night road loss to … USC. Washington State has had a great year, but there are zero notable non-conference games and the Pac-12 as a whole is a down conference. As such, even going 12-1 isn’t enough if there’s a 12-1 conference champion (or a 12-0 Notre Dame or a 12-1 Alabama) still out there.

10. 12-1 Clemson (L-ACCCG)
11. 11-1 Notre Dame

—– Chaos needs to ensue for us to get here.

12. 13-0 UCF
13. B12 Champion West Virginia

Below are the college football SRS ratings through 12 weeks. [continue reading…]

{ 0 comments }

Aaron Rodgers On Pace To Set Interception Record

Aaron Rodgers has thrown just one interception in 10 games this year. That’s 1 interception on a league-high 385 pass attempts. And this was it:

Damon Huard (2006) holds the current record for interception rate in a season at 0.4%; he threw 1 interception on 244 passes, so to beat him, a quarterback would need to either throw no interceptions and 224 passes (to qualify), 1 interception on more than 244 passes, 2 interceptions on more than 488 passes, or 3 interceptions on more than 672 passes. Rodgers has 1 interception so far this year on 385 pass attempts (0.26%!); he has room to throw one more interception this year and still win the crown, but he probably doesn’t have wiggle room to throw two more.

Josh McCown (2013) had 1 interception on 224 pass attempts (0.4%), putting him second all-time on the single-season list. Tom Brady (2016), Nick Foles (2013), Tom Brady (2010), Dak Prescott (2016), Steve DeBerg (1990), Sam Bradford (2016), and David Garrard (2007) are the only other players to throw fewer than 1 interception for every 100 passes in a season, min 14 pass attempts per team game. (Oh, and Drew Brees has a 0.3% interception rate this year, too: he has 1 interception on 304 passes).

Interceptions rates have plummeted, of course, so it’s hard to truly compare this season by Rodgers to some of the low interceptions of years past. Here’s the league average interception rate in every season since 1970:

Another thing that makes Rodgers’ 2018 interception rate so interesting, particularly compared to Brees, is that Rodgers has thrown a lot of incomplete passes. In fact, he’s thrown more than twice as many incomplete passes as Brees — 147 to 69. The graph below shows every player this season with an interception (no regular quarterback has zero interceptions). The X-Axis shows interceptions; the Y-Axis shows incomplete passes. Rodgers really stands out here, and while you didn’t need the help finding him, I colored his dot in Packers colors:

Rodgers is tied with Joe Flacco for the league lead in incomplete passes at 147, and yet he is also tied with Brees for the fewest interceptions among qualifying passers. That’s how extreme Rodgers has been this year. Consider that Rodgers has thrown an interception on just 0.7% of his incomplete passes; Brees ranks second with an interception on 1.4% of his passes, and nobody else has thrown an interception on fewer than 2.8% of interceptions. Huard in 2006 (1.0%) currently has the record for interception rate on incomplete passes, and that’s another mark Rodgers has in his sights.

It’s been an up-and-down year for Rodgers. For example:

  • His winning percentage is below .500, the worst of his career since his first year as a starter in 2008.
  • His touchdown rate is below 5.0% for the first time in his career.
  • His completion percentage is 62%, the second lowest of his career.

On the other hand, his sack rate is slightly better than his (not very good) career average, his yards/attempt is slightly better than (his remarkably good) career average, he’s averaging more passing yards/game than any season other than 2011, and he’s posting by far the best interception rate of his career, which has been littered with remarkable interception rates.

Rodgers entered the season with a remarkable TD/INT ratio, and it’s only gotten better.  He’s now at 4.20/1, easily the best in history (only Brady and Russell Wilson — both are at 3.02 to 1 — have more than 3 touchdown passes for every interception).  And while it’s been a rough year for Rodgers, he’s in position to set a new record in 2018.

{ 1 comment }

Punting on 4th-and-2, Trailing, Late in the Game

Last night, Mike McCarthy decided to punt on 4th-and-2, from the Green Bay 33-yard line, with 4:20 remaining and the Packers trailing the Seahawks 27-24. Aaron Rodgers never again took the field, as Seattle picked up two first downs and ran out the clock.

Since 2008, there have been 17 examples where a team trailed by 1-7 points, in the final 5 minutes of the game, and punted on 4th and short (1, 2, or 3 yards).

Three times, those teams won: JaMarcus Russell and the Raiders pulled it off against the Broncos in 2009, Russell Wilson and the Seahawks famously defeated the Patriots in 2012 in this situation, and Derek Carr and the Raiders pulled it off against the Chiefs in 2017.

In his career, Rodgers has had 99 cases where the Packers had a 3rd-and-2 or 4th-and-2 from at least 30 yards away from the end zone. Green Bay picked up a first down 55% of the time.

What do you think?

{ 0 comments }

Week 10 (2018) Game Scripts

Previously:

No time for commentary from me today, but here are the Week 10 Game Scripts.

TeamH/ROppBoxscorePFPAMarginGame ScriptPassRunP/R RatioOp_POp_ROpp_P/R Ratio
BUF@NYJBoxscore41103120.4274637%371867.3%
NOR@CINBoxscore51143720.3274736.5%271662.8%
PITCARBoxscore52213119.4283048.3%342260.7%
CHIDETBoxscore34221215.3312258.5%482466.7%
TENNWEBoxscore34102412.3273642.9%461970.8%
GNBMIABoxscore3112199.5302554.5%432365.2%
CLEATLBoxscore2816128.5212942%541974%
KANARIBoxscore2614128332358.9%442563.8%
INDJAXBoxscore292637292355.8%383452.8%
LAC@OAKBoxscore206145.8272650.9%412166.1%
WAS@TAMBoxscore163134.4292652.7%432464.2%
DAL@PHIBoxscore272073.7402858.8%461674.2%
LARSEABoxscore363150.5412364.1%303446.9%
NYG@SFOBoxscore27234-1.5322358.2%392957.4%
{ 0 comments }

For purposes of grading each team’s passing attack in each season since 2002, let’s look at where each team ranked in Adjusted Net Yards per Attempt. Next, let’s group teams into 5 buckets of four teams each based on the following ranks:

— Best passing offenses — i.e., the teams that rank 1, 2, 3, and 4 in ANY/A
— Good passing offenses — those teams that rank 8, 9, 10, and 11
— Average passing offenses — teams that rank 15, 16, 17, and 18
— Bad passing offenses — teams that rank 22, 23, 24, and 25
— Worst passing offenses — teams that rank 29, 30, 31, and 32

I went ahead and calculated the ANY/A of those teams for each season since 2002. In the graph below, I’ve plotted the results, taking the average ANY/A of those teams.

The most remarkable part of this: in 2018, the teams that rank 22nd, 23rd, 24th, and 25th in pass efficiency have an average ANY/A of 5.86. In 2002 and 2003, the teams that ranked 8th, 9th, 10th, and 11th in ANY/A had average ANY/A of 5.82 (’02) and 5.84 (’03). Those same teams are at 7.17 this year.

What stands out to you?

{ 0 comments }

In March, the Jets inexplicably signed Josh McCown to a 1-year, $10M contract.

A few days later, the Jets sent three 2nd round picks along with the 6th pick in the 2018 Draft to Indianapolis to move up to the 3rd spot. That made the McCown signing even more odd in retrospect:

The Jets have mucked up the quarterback position for as long as anyone can remember, and you can add giving McCown $10M to Mike Maccagnan’s tab next to “trading up for Bryce Petty,” “using a second round pick on Christian Hackenberg”, and “sending a fortune to get a top-3 quarterback prospect”, and “getting into a stalemate with a journeyman quarterback and then giving him $12M.”

On Sunday, McCown was the worst quarterback in football. Paying $10M to a quarterback coach is not justifiable, and paying $10M to a quarterback mentor — whose mentees include Hackenberg, Petty, Johnny Manziel, and Mike Glennon — only works if he can be a great backup quarterback on a team in need of a great backup quarterback.

The full week 10 passing stats below:

RkQuarterbackTmOppResultAttYdsTDIntSkYdsANY/AVALUE
1Ben RoethlisbergerPITCARW 52-2125328501616.23243
2Mitchell TrubiskyCHIDETW 34-2230355301713.16195
3Drew BreesNORCINW 51-1425265300013153
4Baker MayfieldCLEATLW 28-1620216300013.8139
5Andrew LuckINDJAXW 29-2629285310010.34101
6Blake BortlesJAXINDL 26-293832020009.4799
7Matt BarkleyBUFNYJW 41-1025232201810.1585
8Marcus MariotaTENNWEW 34-1024228202149.7775
9Jared GoffLARSEAW 36-3139318202118.4665
10Philip RiversLACOAKW 20-62622321118.0432
11Carson WentzPHIDALL 20-2744360212107.529
12Patrick MahomesKANARIW 26-1428249205377.6425
13Jeff DriskelCINNORL 14-5134500001524
14Eli ManningNYGSFOW 27-233118830187.520
15Aaron RodgersGNBMIAW 31-1228199202177.416
16Darius JenningsTENNWEW 34-1012100002114
17Ryan FitzpatrickTAMWASL 3-164140602287.1613
18Logan ThomasBUFNYJW 41-101150000158
19Brian HoyerNWETENL 10-3417000070
20Julian EdelmanNWETENL 10-341600006-1
21Logan CookeJAXINDL 26-291400004-3
22Russell WilsonSEALARL 31-3626176304356.7-5
23Teddy BridgewaterNORCINW 51-141000000-7
23Taysom HillNORCINW 51-141000000-7
25Dak PrescottDALPHIW 27-2036270104316.48-16
26Alex SmithWASTAMW 16-32717810386.33-16
27Joshua DobbsPITCARW 52-212-30000-1.5-17
28Matt RyanATLCLEL 16-2852330202196.5-20
29Dontrell HilliardCLEATLW 28-16100100-45-52
30Tom BradyNWETENL 10-3441254003235.25-71
31Derek CarrOAKLACL 6-2037243004404.95-79
32Nick MullensSFONYGL 23-273925012004.62-88
33Cam NewtonCARPITL 21-5229193215464.18-91
34Andy DaltonCINNORL 14-5120153124242.46-106
35Matthew StaffordDETCHIL 22-3442274226453.73-151
36Brock OsweilerMIAGNBL 12-3137213016502.74-177
37Josh RosenARIKANL 14-2639208125422.18-206
38Josh McCownNYJBUFL 10-4134135023190.7-228
Total92571445018695096.87

This was another remarkable week for NFL passers, who completed 630 of 925 passes (68.1%) for 7,144 yards, with 50 TDs and just 18 INTs. That translates to a 100.9 passer rating, and there were 19 quarterbacks who had a passer rating of over 100 and threw 20+ passes. This came despite there being just 28 teams active in week 10! The quarterbacks took 69 sacks for 509 yards, and finished with a 6.87 ANY/A average. It was yet another remarkable passing week in the best passing season of all time.

Finally, let’s look at the full season passing stats: you have Philip Rivers at #4, and in front of him is a rival quarterback from his own division, a rival quarterback from his own city, and his former teammate. And the bottom three are all rookies, in a narrative twist from the “why are rookies all of the sudden good” trend we had seen in recent years:

RkQuarterbackTmAgeAttYdsTDIntSkYdsANY/AValue
1Patrick MahomesKAN23345315031717959.28994
2Jared GoffLAR243323134226191149.09895
3Drew BreesNOR3930426012119719.28859
4Philip RiversLAC37272245921412759.24767
5Matt RyanATL333533015213241638.32672
6Ryan FitzpatrickTAM36225219917913698.68509
7Ben RoethlisbergerPIT36369288821712797.65423
8Aaron RodgersGNB353552741171251867.5366
9Carson WentzPHI262692148153231567.39248
10Mitchell TrubiskyCHI242902304197181147.32242
11Deshaun WatsonHOU232852389177301497.19206
12Russell WilsonSEA302471967215292047.09154
13Tom BradyNWE413712748177161116.88132
14Kirk CousinsMIN303632685175241416.87129
15Cam NewtonCAR292922086175171306.751
16Andrew LuckIND29371247226910766.5920
17Alex SmithWAS34301204510319996.28-81
19Blake BortlesJAX26328234112818896.16-130
20Andy DaltonCIN3131222551810201536.06-158
21Derek CarrOAK273202441108281696.07-163
22Matthew StaffordDET303312385168291816.01-189
23Eli ManningNYG373462565116322396.02-195
24Brock OsweilerMIA28178124764161245.48-205
25Joe FlaccoBAL33379246512616795.96-226
26Marcus MariotaTEN25203149875251495.54-226
27Baker MayfieldCLE232851984137221545.78-232
28Dak PrescottDAL252731930115321845.71-253
29Jameis WinstonTAM24148118161013604.91-261
30C.J. BeathardSFO25169125287181565.03-281
31Case KeenumDEN3033024001110241745.64-318
32Josh AllenBUF2213983225211673-566
33Josh RosenARI21208128068211553.86-612
34Sam DarnoldNYJ2128919341114211294.5-632
Lg Avg00104677879152324574849126.540

What stands out to you?

{ 0 comments }

The 2018 season is the greatest season in passing history. In week 10, prior to Monday Night Football, NFL passers have thrown 855 passes and completed 584 of them for 6,706 yards with 46 TDs and 16 INTs. That translates to an average passer rating of 101.8, which would make this in the running for the greatest single week for passing in history. A whopping 18 of the 26 starting quarterbacks this week had a passer rating of over 100!

But it’s not just the name brand quarterbacks that are doing well. Let’s exclude Carson Wentz and Jameis Winston, who began the season as backups in name only (Wentz was injured; Winston was suspended). And let’s not include Ryan Fitzpatrick, who is obviously having a very strong season for a “backup” quarterback.

And let’s ignore the first round rookie quarterbacks, who aren’t true backups in the way we think of the term. That leaves seven quarterbacks who by any definition qualify as backup quarterbacks: Brock Osweiler, C.J. Beathard, Derek Anderson, Blaine Gabbert, Josh McCown, Matt Barkley, and Nick Mullens. And so far this season, they have thrown more TDs than INTs and have completed over 60% of their passes:

In fact, backup quarterbacks now have a stat line that is roughly equal to league average from the early ’00s: a passer rating of 80.6 and an ANY/A average of 5.20. Four of these quarterbacks — in particular Barkley (on a salary of $790K for 2018), Mullens ($1.05M), Osweiler ($880K), Anderson ($1.1M) — are arguably replacement level (shockingly, the Jets are paying McCown $10M this season). And those four quarterbacks have an ANY/A average of 6.00 and a passer rating of 86.9!

2018 is truly a case of a rising tide lifting all ships.

{ 1 comment }

Alabama is the best team in college football, and maybe the best team in a generation of college football.

Clemson is fantastic, and is the second best team in college football. A Crimson Tide/Tigers clash in the playoff for a fourth straight year is not going to surprise anyone.

Notre Dame is 10-0 and will make the playoff assuming the Irish can handle Syracuse and USC, two average teams.

That leaves one final spot for the playoff. Ohio State and Michigan are both 9-1 and will play in two weeks. The Buckeyes and Wolverines face Maryland and Indiana this week, so they should be 10-1 as they enter The Big Game for the final week of the regular season. The winner will have the inside track for that 4th spot, assuming they can handle Big 10 West division winner Northwestern in Indianapolis.

The Big 12 also has a pair of 1-loss teams in 9-1 Oklahoma and 8-1 West Virginia (due to Hurricane Florence, the West Virginia game against N.C. State was canceled). Michigan’s one loss was in South Bend, a better loss than Oklahoma’s neutral site loss to Texas. Oklahoma has arguably faced a tougher schedule and it will only get tougher: the Sooners will have to face West Virginia in Morgantown, and then possibly a rematch with West Virginia (or Iowa State) in the Big 12 title game. There seems to be no momentum for the Committee to vault a 12-1 Oklahoma over a 12-1 Michigan, but I suppose it’s at least on the table.

But both the Big 10 and Big 12 will have the possibility of a 1-loss champion, which will lead to some interesting debates for the final spot. My hunch is that the Committee would rank the 1-loss teams in the following order:

1. Michigan
2. Oklahoma
3. Ohio State
4. West Virginia
5. Washington State

Below are the single game results from week 10. As always thanks to Dr. Peter R. Wolfe for providing the weekly game logs.

DateTm_ConfPFOppPAH/RW/LDiffMOVOpp_ConfSOSSRS
11-10-2018Minnesota_B1041Purdue10HomeWin3126B1054.480.4
11-10-2018Alabama_SEC24Mississippi St0HomeWin2421SEC58.879.8
11-10-2018Ohio State_B1026Michigan St6RoadWin2023B1054.477.4
11-10-2018West Virginia_B1247TCU10HomeWin3729B1247.976.9
11-10-2018Clemson_ACC27Boston College7RoadWin2023ACC51.574.5
11-10-2018Washington St_P1231Colorado7RoadWin2425.5P1245.671.1
11-10-2018Tennessee_SEC24Kentucky7HomeWin1714SEC56.270.2
11-10-2018Georgia_SEC27Auburn10HomeWin1714SEC54.168.1
11-10-2018Pittsburgh_ACC52Virginia Tech22HomeWin3025.5ACC41.166.6
11-09-2018Boise St_MWC24Fresno St17HomeWin77MWC59.566.5
11-10-2018Texas_B1241Texas Tech34RoadWin710B1256.466.4
11-10-2018Northwestern_B1014Iowa10RoadWin47B1058.665.6
11-10-2018Oklahoma St_B1247Oklahoma48RoadLoss-10B1265.265.2
11-10-2018Notre Dame_IND42Florida St13HomeWin2925ACC4065
11-07-2018Northern Illinois_MAC38Toledo15HomeWin2320MAC43.263.2
11-10-2018Arkansas St_SUN44Coastal Car.16RoadWin2827.5SUN34.562
11-10-2018Florida_SEC35South Carolina31HomeWin47SEC54.361.3
11-10-2018Penn State_B1022Wisconsin10HomeWin129B1052.261.2
11-10-2018Michigan_B1042Rutgers7RoadWin3531B1029.960.9
11-10-2018Texas A&M_SEC38Mississippi24HomeWin1411SEC49.360.3
11-10-2018Temple_Amer59Houston49RoadWin1013Amer46.559.5
11-10-2018Troy_SUN35Georgia Southern21RoadWin1417SUN42.559.5
11-08-2018Wake Forest_ACC27North Carolina St23RoadWin47ACC51.758.7
11-10-2018Utah St_MWC62San José St24HomeWin3829.5MWC29.158.6
11-10-2018Nevada_MWC49Colorado St10HomeWin3930MWC27.657.6
11-09-2018Syracuse_ACC54Louisville23HomeWin3126ACC31.357.3
11-10-2018Mississippi St_SEC0Alabama24RoadLoss-24-21SEC7857
11-10-2018Memphis_Amer47Tulsa21HomeWin2623Amer3457
11-10-2018Stanford_P1248Oregon St17HomeWin3126P1230.756.7
11-10-2018Georgia Tech_ACC27Miami FL21HomeWin67ACC49.656.6
11-10-2018Missouri_SEC33Vanderbilt28HomeWin57SEC49.356.3
11-10-2018Utah_P1232Oregon25HomeWin77P1249.356.3
11-10-2018Iowa St_B1228Baylor14HomeWin1411B1245.156.1
11-06-2018Buffalo_MAC48Kent St14HomeWin3427.5MAC27.955.4
11-10-2018Auburn_SEC10Georgia27RoadLoss-17-14SEC6955
11-10-2018Florida Int'l_CUSA45Texas-San Antonio7RoadWin3832.5CUSA21.854.3
11-10-2018California_P1215Southern Cal14RoadWin17P1247.254.2
11-10-2018Eastern Michigan_MAC27Akron7HomeWin2017MAC36.153.1
11-10-2018Virginia_ACC45Liberty24HomeWin2118IND34.652.6
11-10-2018Nebraska_B1054Illinois35HomeWin1916B1036.652.6
11-10-2018Appalachian St_SUN38Texas St-San Marcos7RoadWin3129SUN23.252.2
11-10-2018Vanderbilt_SEC28Missouri33RoadLoss-5-7SEC59.152.1
11-10-2018Oklahoma_B1248Oklahoma St47HomeWin10B1251.151.1
11-10-2018Wisconsin_B1010Penn State22RoadLoss-12-9B106051
11-10-2018Arkansas_SEC17LSU24HomeLoss-7-10SEC60.950.9
11-10-2018Louisiana-Monroe_SUN38South Alabama10RoadWin2827.5SUN22.950.4
11-10-2018Oregon_P1225Utah32RoadLoss-7-7P1257.450.4
11-10-2018Air Force_MWC42New Mexico24HomeWin1815MWC35.350.3
11-10-2018South Carolina_SEC31Florida35RoadLoss-4-7SEC56.949.9
11-10-2018UCLA_P1228Arizona St31RoadLoss-30P1249.749.7
11-10-2018Indiana_B1034Maryland32HomeWin20B1049.349.3
11-10-2018LSU_SEC24Arkansas17RoadWin710SEC3949
11-10-2018Boston College_ACC7Clemson27HomeLoss-20-23ACC71.848.8
11-10-2018Cincinnati_Amer35South Florida23HomeWin129Amer39.348.3
11-10-2018UNLV_MWC27San Diego St24RoadWin37MWC41.248.2
11-10-2018Navy_Amer24Central Florida35RoadLoss-11-8Amer56.148.1
11-10-2018Brigham Young_IND35Massachusetts16NeutWin1919IND28.447.4
11-10-2018Old Dominion_CUSA34North Texas31HomeWin30CUSA47.247.2
11-09-2018Fresno St_MWC17Boise St24RoadLoss-7-7MWC54.147.1
11-10-2018Kansas St_B1221Kansas17HomeWin47B1239.846.8
11-10-2018Baylor_B1214Iowa St28RoadLoss-14-11B1257.846.8
11-10-2018Southern Miss_CUSA23UAB26RoadLoss-30CUSA46.246.2
11-10-2018Texas Tech_B1234Texas41HomeLoss-7-10B1256.146.1
11-10-2018Mississippi_SEC24Texas A&M38RoadLoss-14-11SEC56.745.7
11-10-2018Maryland_B1032Indiana34RoadLoss-20B1045.345.3
11-07-2018Miami OH_MAC30Ohio U.28HomeWin20MAC45.245.2
11-10-2018South Florida_Amer23Cincinnati35RoadLoss-12-9Amer53.444.4
11-10-2018Iowa_B1010Northwestern14HomeLoss-4-7B1051.144.1
11-10-2018Bowling Green_MAC24Central Michigan13RoadWin1114MAC29.943.9
11-10-2018Marshall_CUSA30UNC-Charlotte13HomeWin1714CUSA29.943.9
11-10-2018Duke_ACC42North Carolina35HomeWin77ACC3643
11-10-2018North Carolina_ACC35Duke42RoadLoss-7-7ACC5043
11-10-2018Miami FL_ACC21Georgia Tech27RoadLoss-6-7ACC49.342.3
11-10-2018Arizona St_P1231UCLA28HomeWin30P1241.741.7
11-07-2018Ohio U._MAC28Miami OH30RoadLoss-20MAC41.341.3
11-10-2018Central Florida_Amer35Navy24HomeWin118Amer33.241.2
11-10-2018Florida Atlantic_CUSA34Western Kentucky15HomeWin1916CUSA24.640.6
11-10-2018Louisiana-Lafayette_SUN36Georgia St22HomeWin1411SUN29.240.2
11-10-2018Middle Tennessee St_CUSA48UTEP32RoadWin1619CUSA20.439.4
11-10-2018Michigan St_B106Ohio State26HomeLoss-20-23B1061.538.5
11-10-2018Southern Cal_P1214California15HomeLoss-1-7P1245.138.1
11-10-2018Rutgers_B107Michigan42HomeLoss-35-31B1068.537.5
11-10-2018SMU_Amer62Connecticut50RoadWin1215Amer2237
11-10-2018Florida St_ACC13Notre Dame42RoadLoss-29-25IND61.736.7
11-10-2018East Carolina_Amer18Tulane24RoadLoss-6-7Amer43.536.5
11-10-2018Kansas_B1217Kansas St21RoadLoss-4-7B1243.536.5
11-10-2018Tulane_Amer24East Carolina18HomeWin67Amer29.436.4
11-10-2018Houston_Amer49Temple59HomeLoss-10-13Amer49.236.2
11-08-2018North Carolina St_ACC23Wake Forest27HomeLoss-4-7ACC43.236.2
11-10-2018UAB_CUSA26Southern Miss23HomeWin30CUSA35.735.7
11-10-2018TCU_B1210West Virginia47RoadLoss-37-29B1264.435.4
11-10-2018Kentucky_SEC7Tennessee24RoadLoss-17-14SEC48.934.9
11-10-2018Colorado_P127Washington St31HomeLoss-24-25.5P1259.734.2
11-10-2018New Mexico_MWC24Air Force42RoadLoss-18-15MWC45.830.8
11-10-2018Liberty_IND24Virginia45RoadLoss-21-18ACC47.929.9
11-10-2018Louisiana Tech_CUSA28Rice13HomeWin1512CUSA17.829.8
11-10-2018Illinois_B1035Nebraska54RoadLoss-19-16B1045.529.5
11-10-2018Georgia St_SUN22Louisiana-Lafayette36RoadLoss-14-11SUN4029
11-10-2018Georgia Southern_SUN21Troy35HomeLoss-14-17SUN45.728.7
11-10-2018San José St_MWC24Utah St62RoadLoss-38-29.5MWC5727.5
11-10-2018Akron_MAC7Eastern Michigan27RoadLoss-20-17MAC44.227.2
11-10-2018Oregon St_P1217Stanford48RoadLoss-31-26P1253.127.1
11-10-2018North Texas_CUSA31Old Dominion34RoadLoss-30CUSA2727
11-10-2018Rice_CUSA13Louisiana Tech28RoadLoss-15-12CUSA38.626.6
11-10-2018UNC-Charlotte_CUSA13Marshall30RoadLoss-17-14CUSA40.426.4
11-09-2018Louisville_ACC23Syracuse54RoadLoss-31-26ACC52.326.3
11-10-2018Massachusetts_IND16Brigham Young35NeutLoss-19-19IND44.725.7
11-10-2018Army_IND31Lafayette13HomeWin1815fcs9.924.9
11-07-2018Toledo_MAC15Northern Illinois38RoadLoss-23-20MAC44.324.3
11-10-2018San Diego St_MWC24UNLV27HomeLoss-3-7MWC30.823.8
11-10-2018Western Kentucky_CUSA15Florida Atlantic34RoadLoss-19-16CUSA39.523.5
11-10-2018Connecticut_Amer50SMU62HomeLoss-12-15Amer38.123.1
11-10-2018Tulsa_Amer21Memphis47RoadLoss-26-23Amer45.922.9
11-10-2018Virginia Tech_ACC22Pittsburgh52RoadLoss-30-25.5ACC48.422.9
11-10-2018Texas St-San Marcos_SUN7Appalachian St38HomeLoss-31-29SUN51.822.8
11-10-2018UTEP_CUSA32Middle Tennessee St48HomeLoss-16-19CUSA40.921.9
11-06-2018Kent St_MAC14Buffalo48RoadLoss-34-27.5MAC48.120.6
11-10-2018Purdue_B1010Minnesota41RoadLoss-31-26B1046.320.3
11-10-2018Coastal Car._SUN16Arkansas St44HomeLoss-28-27.5SUN42.314.8
11-10-2018Colorado St_MWC10Nevada49RoadLoss-39-30MWC4414
11-10-2018Central Michigan_MAC13Bowling Green24HomeLoss-11-14MAC24.210.2
11-10-2018South Alabama_SUN10Louisiana-Monroe38HomeLoss-28-27.5SUN34.46.9
11-10-2018Texas-San Antonio_CUSA7Florida Int'l45HomeLoss-38-32.5CUSA38.25.7

And here are the updated season standings. Yes, Alabama is ridiculous.

RkTeamConfDivConf RkGMOVSOSSRSREC
1AlabamaSECSEC-West11029.448.67810-0
2ClemsonACCACC-Atl11027.244.771.810-0
3GeorgiaSECSEC-East21019.149.9699-1
4MichiganB10B10-East11020.54868.59-1
5OklahomaB12B1211016.34965.29-1
6West VirginiaB12B122917.546.964.48-1
7Notre DameINDInd11015.945.961.710-0
8Ohio StateB10B10-East21015.845.861.59-1
9LSUSECSEC-West3109.351.660.98-2
10Penn StateB10B10-East3109.550.5607-3
11Washington StP12P12-North11015.843.959.79-1
12Fresno StMWCMWC-West11020.738.859.58-2
13MissouriSECSEC-East4106.952.259.16-4
14Mississippi StSECSEC-West5108.949.958.86-4
15IowaB10B10-West410949.658.66-4
16Iowa StB12B12396.251.657.86-3
17UtahP12P12-South2109.647.857.47-3
18WashingtonP12P12-North31010.147.157.27-3
19Utah StMWCMWC-Mntn21023.233.957.19-1
20FloridaSECSEC-East610749.956.97-3
21Texas A&MSECSEC-West7105.351.456.76-4
22Texas TechB12B124106.350.156.45-5
23KentuckySECSEC-East8105.850.556.27-3
24TexasB12B125105.750.456.17-3
25Central FloridaAmerAmer-East1920.13656.19-0
26Michigan StB10B10-East5101.752.754.46-4
27PurdueB10B10-West6103.550.954.45-5
28South CarolinaSECSEC-East99153.354.35-4
29Boise StMWCMWC-Mntn31012.241.954.18-2
30AuburnSECSEC-West10106.347.854.16-4
31CincinnatiAmerAmer-East21016.636.953.49-1
32StanfordP12P12-North4103.849.353.16-4
33SyracuseACCACC-Atl21013.738.652.38-2
34WisconsinB10B10-West7106.745.552.26-4
35Appalachian StSUNSun1918.333.551.87-2
36North Carolina StACCACC-Atl395.346.351.76-3
37Boston CollegeACCACC-Atl4107.344.351.67-3
38NorthwesternB10B10-West810051.151.16-4
39Oklahoma StB12B126104.846.351.15-5
40ArmyINDInd21010.340.250.58-2
41DukeACCACC-Coas5107.342.7507-3
42Arizona StP12P12-South5104.74549.76-4
43Miami FLACCACC-Coas6107.142.649.75-5
44MarylandB10B10-East9102.546.949.35-5
45MississippiSECSEC-West11100.648.749.35-5
46VanderbiltSECSEC-East1210-0.950.249.34-6
47OregonP12P12-North6105.843.549.36-4
48Georgia TechACCACC-Coas710841.349.36-4
49TempleAmerAmer-East3106.442.849.26-4
50TennesseeSECSEC-East1310-1.650.548.95-5
51PittsburghACCACC-Coas8101.44748.46-4
52BuffaloMACMAC-East11012.635.548.19-1
53VirginiaACCACC-Coas9107.140.847.97-3
54TCUB12B12710-2.350.247.94-6
55North TexasCUSACUSA-West11014.632.647.27-3
56Southern CalP12P12-South710-0.147.347.25-5
57HoustonAmerAmer-West41011.934.646.57-3
58MinnesotaB10B10-West1010-1.247.446.35-5
59UABCUSACUSA-West21016.429.846.29-1
60MemphisAmerAmer-West51010.835.145.96-4
61Air ForceMWCMWC-Mntn4103.742.145.84-6
62TroySUNSun2101035.745.78-2
63ColoradoP12P12-South8102.74345.65-5
64NebraskaB10B10-West1110-2.147.645.53-7
65IndianaB10B10-East1210-2.447.745.35-5
66Ohio U.MACMAC-East2101035.345.26-4
67CaliforniaP12P12-North9101.14445.16-4
68BaylorB12B12810-2.647.745.15-5
69Brigham YoungINDInd310143.844.75-5
70ArizonaP12P12-South10102.44244.35-5
71Northern IllinoisMACMAC-West3101.34344.37-3
72Eastern MichiganMACMAC-West4114.639.644.26-5
73NevadaMWCMWC-West5103.240.8446-4
74TulaneAmerAmer-West6101.142.543.55-5
75Kansas StB12B12910-4.247.743.54-6
76Wake ForestACCACC-Atl1010-2.745.943.25-5
77ToledoMACMAC-West5104.338.943.25-5
78Georgia SouthernSUNSun3106.436.142.57-3
79Arkansas StSUNSun4102.939.542.36-4
80UCLAP12P12-South1110-1152.741.72-8
81Miami OHMACMAC-East6100.44141.34-6
82San Diego StMWCMWC-West6101.339.941.27-3
83Virginia TechACCACC-Coas119-1.642.641.14-5
84Middle Tennessee StCUSACUSA-East3105.135.9417-3
85MarshallCUSACUSA-East496.334.140.46-3
86Florida StACCACC-Atl1210-7.647.740.14-6
87Louisiana-LafayetteSUNSun5100.139.9405-5
88KansasB12B121010-6.24639.83-7
89Florida AtlanticCUSACUSA-East5100.439.139.55-5
90South FloridaAmerAmer-East7101.937.539.37-3
91ArkansasSECSEC-West1410-8.447.4392-8
92Louisiana TechCUSACUSA-West6103.135.538.67-3
93Florida Int'lCUSACUSA-East7109.22938.27-3
94SMUAmerAmer-West810-4.342.338.15-5
95Western MichiganMACMAC-West710-0.338.137.86-4
96WyomingMWCMWC-Mntn710-5.843.437.64-6
97IllinoisB10B10-West1310-7.143.636.64-6
98AkronMACMAC-East89-3.439.636.14-5
99North CarolinaACCACC-Coas139-9.945.9361-8
100Southern MissCUSACUSA-West892.433.335.74-5
101New MexicoMWCMWC-Mntn810-4.739.935.33-7
102LibertyINDInd49-2.437.134.64-5
103Coastal Car.SUNSun610-4.138.634.55-5
104Louisiana-MonroeSUNSun710-1.936.234.46-4
105TulsaAmerAmer-West910-6.940.9342-8
106Hawai`iMWCMWC-West911-3.637.6346-5
107NavyAmerAmer-West1010-10.243.433.22-8
108LouisvilleACCACC-Atl1410-17.548.731.32-8
109UNLVMWCMWC-West1010-8.23930.83-7
110Oregon StP12P12-North1210-15.546.230.72-8
111Ball StMACMAC-West910-7.438.130.73-7
112Central MichiganMACMAC-West1011-10.740.629.91-10
113RutgersB10B10-East1410-17.747.629.91-9
114UNC-CharlotteCUSACUSA-East910-534.829.94-6
115East CarolinaAmerAmer-East119-11.941.429.42-7
116Georgia StSUNSun810-10.239.429.22-8
117San José StMWCMWC-West1110-13.742.729.11-9
118MassachusettsINDInd511-7.535.928.44-7
119Kent StMACMAC-East1110-1138.927.92-8
120Colorado StMWCMWC-Mntn1210-13.741.327.63-7
121Old DominionCUSACUSA-East1010-9.636.6273-7
122Western KentuckyCUSACUSA-East1110-11.536.124.61-9
123Bowling GreenMACMAC-East1210-14.83924.22-8
124Texas St-San MarcosSUNSun910-6.829.923.23-7
125South AlabamaSUNSun1010-1537.822.92-8
126New Mexico StINDIND610-13.635.822.23-7
127ConnecticutAmerAmer-East1210-21.143221-9
128Texas-San AntonioCUSACUSA-West1210-14.135.821.83-7
129UTEPCUSACUSA-West1310-1333.320.41-9
130RiceCUSACUSA-West1411-17.134.917.81-10

Right now, on a neutral field, Alabama would be:

— 6-point favorites against Clemson
— 9-point favorites against Georgia
— 9.5 point favorites against Michigan
— 16-point favorites against Notre Dame
— 22-point favorites against UCF
— 54.5 point favorites against The Citadel, Alabama’s opponent this weekend (that’s based on The Citadel’s 23.5 SRS rating; there actually is no point spread on the game).

{ 0 comments }

The Giants, Dolphins, and Simpson’s Paradox

This year, the Giants are averaging 6.35 net yards per pass and 4.18 yards per carry. That’s below-average on both counts, as New York ranks 20th in both categories.

This year, the Dolphins are averaging 6.53 net yards per pass and 4.30 yards per carry. Miami ranks 15th in NY/A and 17th in YPC.

And yet the Giants are averaging more yards per play this year than Miami! How is that possible — after all, plays are just rushes or passes (including sacks), and the Dolphins are averaging more yards per pass and yards per rush. But New York has gained 5.70 yards per play this year, while Miami is averaging only 5.58 yards per play.

The answer, of course, is Simpson’s Paradox. We can also see an example of Simpson’s Paradox with Chicago. This year, the Bears are averaging 6.65 net yards per pass and 4.45 yards per carry. That’s above-average in both categories, as Chicago ranks 12th in both metrics. And yet the Bears rank below the Giants in yards per play, at just 5.65.

This is because the Giants pass a lot, and passes are more effective at gaining yards (even net of sacks) than rushes. The Giants have passed on a league-high 70% of plays, while Miami has passed on 58% of plays and the Bears just 54% of plays.

This happens with a few teams every year. The Jaguars are averaging 6.02 net yards per pass, 4.25 yards per rush, and 5.41 yards per play. The Redskins are averaging 6.12 net yards per pass and 4.33 yards per rush, and yet… Washington is only averaging 5.34 yards per play, a lower average than Jacksonville. That’s because the Jags have passed on 66% of plays, while the Redskins have passed on only 56% of plays. [continue reading…]

{ 0 comments }

A couple of weeks ago, I wrote that over his 4-year career, Jameis Winston had been great at picking up first downs and also at throwing interceptions. Well, now that Ryan Fitzpatrick’s interception rate has ticked back up, the same is true for the 2018 Bucs as a whole.

Jameis Winston leads all players with a 6.8% interception rate through 9 weeks. But Fitzpatrick’s 3.8% interception rate puts him as the 5th most INT-prone passer of the first half of the ’18 season. On the other hand, there are just five players this season who have picked up first downs on 40% of their dropbacks so far: Jared Goff (43.2%), Patrick Mahomes (41.0%), and Philip Rivers (40.9%) — three of the top MVP candidates — and then Fitzpatrick (42.6%) and yes, Winston (40.4%).

On the team level, the Buccaneers have picked up a first down on 41.5% of dropbacks (calculated based on a league-high 148 passing first downs, divided by the team’s 333 pass attempts and 24 sacks).  The Rams lead the league in this metric at 43.3%, followed by Tampa Bay, Kansas City, the Chargers, and the Saints. The worst five teams are the Bills (22.2%), the Cardinals, the Browns, the Jets, and the Cowboys.

When it comes to interception rate, the Bills have the worst performance in that category, too, at 5.5%. But here, Tampa Bay ranks 2nd in the NFL at 5.1%. Usually, there’s a pretty strong relationship between these two categories: teams with good interception rates have good first down rates, and teams with bad interception rates have bad first down rates. Tampa Bay is a very… very large outlier. No other team ranks in the top 9 in first down rate and bottom 9 in interception rate, while Tampa Bay ranks 2nd and 2nd-from the bottom. The Bengals (11th-best 1st down rate, 10th-worst INT rate) are the only other team in the top/bottom 12 of both metrics, and the 49ers, Texans, and Lions are the only other teams in the top/bottom 15.

On the flip side, Baltimore and Washington are the anti-Bucs. The Ravens rank 25th in first down rate, but 9th (aka 24th-from-the-bottom) in interception rate, while the Redskins are 22nd in first down rate and 5th (aka 28th from the bottom) in interception rate.  Yes, Alex Smith is still your anti-gunslinger.

On the graph below, I have plotted where each team fares in first down rate (X-Axis) and interception rate (Y-Axis).  Interception rate is plotted in reverse order, so a low (good) INT rate is high in the graph; therefore, you want to be in the upper right corner of the graph.  The worst passing teams — the Bills, Cardinals, and Jets — are in the lower left corner of the graph.  And all alone in the bottom right? That’s where you’ll find Tampa Bay, the biggest passing outlier this season. [continue reading…]

{ 0 comments }

Previously:

This was the least notable week in a long time, at least from a Game Scripts perspective. No team won with a negative Game Script. There weren’t any really large Game Scripts (Chicago had the biggest, but it was lower than the average best Game Script of the week), and no team stood out on the extreme end for being very pass-happy or very run-heavy.

The Raiders, Texans, and Titans were the most run-happy teams in week 9. Oakland gave up on the game — and the season, and football as a city — in an embarrassing performance against San Francisco. Despite a Game Script of -16.0, Oakland finished with only a 57% pass ratio. If you need more evidence of Oakland quitting, the Raiders punted with 2 minutes left at midfield on 4th-and-9, trailing by 31 points.

In more meaningful games, Houston and Tennessee, with a pair of young mobile quarterbacks, stuck to the ground game. Deshaun Watson had another efficient passing game (although he did take 4 sacks on 28 dropbacks), and also had 6 carries for 38 yards. And while he averaged 6.9 net yards per pass attempt and 6.3 YPC, the rest of the Houston offense was not so effective: Alfred Blue and Lamar Miller somehow were given 27 carries, despite only gaining 60 yards, in a game that was tight the whole way. If there was a takeaway, it’s that the Texans need to run more effectively, or rely on Watson more.

The graph below shows the amount of yards gained on each play by Houston (Y-Axis), plotted against time elapsed into the game (X-Axis). Plays with Watson (passes, sacks, and Watson rushes) are in red, while Texans running back rushing plays are in blue.

Meanwhile, Marcus Mariota had 10 carries as part of a very run-heavy attack for Tennessee. The Titans finished with a Game Script of only +2.0, but still had more rushing attempts than pass plays. There have been 45 games this season where a team had more rushing plays than pass plays: this was just the 6th where the team had a Game Script of +2.0 or worse (the Saints against the Ravens were the only team to have more rushes than passes in a game with a negative Game Script this year).

The full week 9 Game Scripts data below: [continue reading…]

{ 0 comments }

Week 9 Passing Stats: Nick Mullens Shines In Debut

Nick Mullens was an undrafted free agent signing by the 49ers last season who was waived as part of the team’s final cuts in September. He was resigned in January, and then was again waived in September as part of San Francisco’s final cutdown.

He was added to the practice squad, and then, after Jimmy Garoppolo tore his ACL, the 49ers brought Mullens up to the active roster. Then, C.J. Beathard injured his throwing wrist in a game against the Cardinals, and while he played through the injury, he was questionable to start the team’s week 9 game on short rest. In a last minute decision, San Francisco went with Mullens — who had never entered an NFL game before — as the team’s week 9 starting quarterback.

And it somehow went magically, as Mullens turned in one of the greatest debuts by a quarterback in NFL history.

Mullens averaged a league-high 14.64 ANY/A, and ranked second to Drew Brees is value added among all quarterbacks for week 9. The weekly ANY/A average in week 9 was 6.40 ANY/A, another strong passing week for the NFL, and that’s even with Nathan Peterman playing.

And yes, a word about the Bills embattled quarterback. Peterman threw a league-high 49 pass attempts this week, and yet — amazingly — finished just 22nd in passing yards! It was another miserable week for the Buffalo passer, who averaged 0.6 ANY/A. That increased his average for the year, as Peterman is still wading in negative ANY/A waters for the season.

The table below shows the week 9 passing results. [continue reading…]

{ 0 comments }

New York Blues

Over the Jets last 32 games, New York is 10-22, a 0.3125 winning percentage.

Over the Giants last 32 games, New York is also 10-22.

For the Giants, that numbers is a bit backloaded: Big Blue is 4-20 in their last 24 games, and 6-2 in the 8 games before that. By the end of the year, you could envision the Giants going 6-26 over their last 32 games (a 0.1875 winning percentage). The Jets went 5-11 last year, and another 5-11 season is a reasonable guess: that would bring them to 10-22 over their last 32 games.

If that happens, it would mean, on average, New York football would have a 25% winning percentage over the last two years. Which is really, really bad…and also pretty rare. The Jets and Giants may not always be very good, but it’s unusual for both teams to be bad for a notable stretch of time. The graph below shows the trailing 32-game winning percentage for both the Jets and the Giants since 1960. The Jets, of course, are in green; the Giants, in blue. [continue reading…]

{ 0 comments }

In week 10, Alabama produced the win of the season, blanking #3 LSU, 29-0, in Baton Rouge. It was the worst home loss for Louisiana State since 2002, and yet another example of how Alabama is operating on a different level than any other team in college football.

Alabama scored a 91.8 in the SRS for this performance, and the Crimson Tide now have the best two games of the season (Alabama also had a 91.8 in a 62-0 win over Mississippi). The worst game of the year by Alabama (according to the SRS) was a 51-14 drubbing over Louisville on opening weekend. The second-worst game this season was a 65-31 win on the road against Arkansas. A 45-23 win over Texas A&M was the only game the Crimson Tide have won by less than four touchdowns.

Nick Saban has won 5 national championships with Alabama, and his 2016 team was a dominant squad that went 14-0 and lost in the final minute of the national championship game. And yet… this feels like the best Alabama team under Saban, and by a pretty clear margin. And if it’s the best Alabama team under Saban, it’s not too hard to suggest it’s the best Alabama team ever. And if it’s the best Alabama team ever, well, it’s obviously in the discussion for best college football team ever.

That’s how good this 2018 Alabama team is. Right now, they are a touchdown better than the rest of the FBS. Even Clemson has had a couple of unimpressive games: the Tigers needed to rally and score a last minute touchdown to beat an average Syracuse team, and caught a break in a 2-point win over Texas A&M. That’s perfectly normal for an average elite team, but those two blemishes are a standard deviation below anything an apparently invincible Alabama has done this year. Below are the full week 10 SRS ratings. [continue reading…]

{ 0 comments }

Rushing Efficiency Has Soared, With A Twist

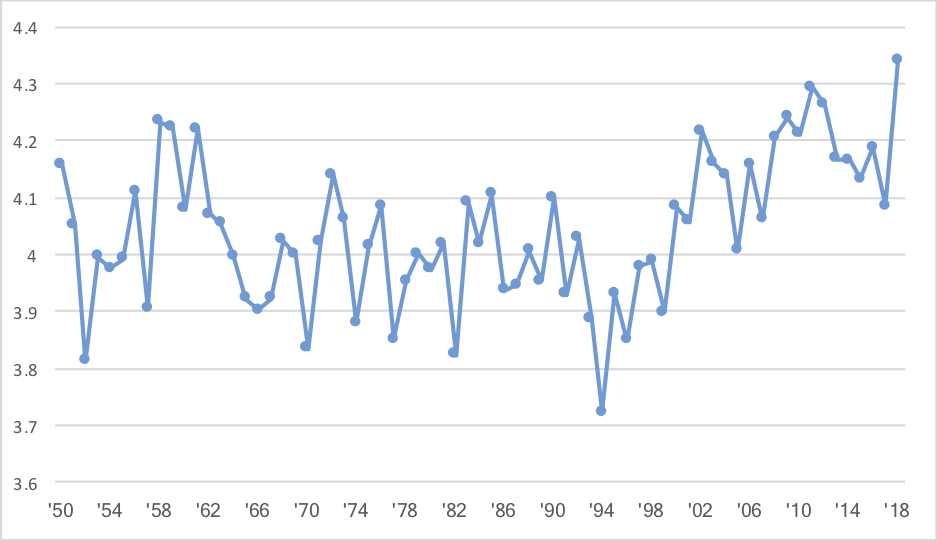
This season, the average carry in the NFL has gained 4.34 yards. That would set a new record, and it would also represent a large 0.25 YPC increase over last season’s average. The graph shows the YPC average in every NFL season since 1950:

[continue reading…]

{ 1 comment }

The Big 12 came into college football existence in 1996, when Texas, Texas Tech, Texas A&M, and Baylor left the SWC to join forces with Nebraska, Colorado, Kansas, Kansas State, Oklahoma, Oklahoma State, Iowa State, and Missouri from the Big 8. The conference has been one of the best in college football, but it’s done a terrible job of producing quality NFL quarterbacks. In fact, there have been just 19 quarterbacks to start an NFL game who played in the Big 12:

Baker Mayfield
Patrick Mahomes
Bryce Petty
Landry Jones
Geno Smith
Brandon Weeden
Ryan Tannehill
Robert Griffin
Blaine Gabbert
Sam Bradford
Colt McCoy
Stephen McGee
Josh Freeman
Chase Daniel
Vince Young
Seneca Wallace
Chris Simms
Sage Rosenfels
Koy Detmer

Mahomes running for a touchdown against Mayfield’s Sooners

There have been 25 quarterbacks drafted from the Big 12: of the group that have started more than 5 games, only two have a winning record. Young, who managed to have a good record despite not being a good passer, and Mahomes, who is now 8-1. Before 2018, no quarterback from the Big 12 had thrown more TDs than interceptions, had more wins than losses, and started more than 5 games.

There are five former Big 12 quarterbacks who have started a game this season: Mahomes, Mayfield, Tannehill, Gabbert, and Bradford.  Through 8 weeks, there were no Big 12 starting QB matchups (although Gabbert played a bunch against Tannehill in the season opener), but tomorrow, the Browns and Chiefs will play.  This means a revival of sorts of a classic game between Mayfield and Mahomes that featured 12 passing touchdowns and nearly 1300 passing yards.

This will be the first time two teams started Big 12 quarterbacks since week 17 of the 2016 season, a forgettable and meaningless matchup between Landry Jones and RG3.  The most high-octane Big 12 QB game of all time was probably another week 17 game, this time between Geno Smith and Ryan Tannehill in 2014.  The table below shows all matchups where both starting quarterbacks played in the Big 12:

YearTeamWinning QBOppLosing QBBoxscoreScoreCombined Pass YdCombined Pass TDCombined INT
2016pitLandry JonescleRobert GriffinBoxscore27-2450952
2015miaRyan TannehillphiSam BradfordBoxscore20-1960931
2014nyjGeno SmithmiaRyan TannehillBoxscore37-2465540
2014miaRyan TannehillnyjGeno SmithBoxscore16-1330002
2013nyjGeno SmithmiaRyan TannehillBoxscore20-742413
2013miaRyan TannehillnyjGeno SmithBoxscore23-343923
2013ramSam BradfordjaxBlaine GabbertBoxscore34-2049252
2013miaRyan TannehillcleBrandon WeedenBoxscore23-1056124
2013nyjGeno SmithtamJosh FreemanBoxscore18-1746622
2012ramSam BradfordtamJosh FreemanBoxscore28-1356835
2012miaRyan TannehillramSam BradfordBoxscore17-1450020
2012wasRobert GriffintamJosh FreemanBoxscore24-2262211
2012ramSam BradfordwasRobert GriffinBoxscore31-2851642
2011jaxBlaine GabberttamJosh FreemanBoxscore41-1440125
2011cleColt McCoyjaxBlaine GabbertBoxscore14-1040911
2011ramSam BradfordcleColt McCoyBoxscore13-1237311
2010tamJosh FreemanramSam BradfordBoxscore18-1733830

Quarterbacks from the Big 12 have disappointed for over two decades. But Mahomes is changing things, and Mayfield may be on the path to joining him.

{ 0 comments }

Rivers, Brees, and The Elusive Quest For An MVP Award

Drew Brees and Philip Rivers are two of the best quarterbacks of the last dozen years. Brees joined the Saints in 2006, paving the way for Rivers to become the Chargers starting quarterback that season. Since then, they are the only two players who threw for 50,000 yards from 2006 to 2017, and they  have been just a hair behind Tom Brady, Aaron Rodgers, and Peyton Manning in terms of efficiency.

But despite over a decade of great play, neither Brees nor Rivers have won the AP MVP award. The main reason? The triumvirate of Manning, Brady, and Rodgers have won 8 of the 12 AP MVP awards from ’06 to ’17. In the other years, the award went to Matt Ryan in 2016, Cam Newton in 2015, and running backs Adrian Peterson in 2012 and LaDainian Tomlinson in 2006.  In 2012, if Peterson didn’t win the award, Manning would have won it (Peterson beat Manning 30.5 votes to 19.5 votes, and Manning lapped the field for the AP All-Pro QB vote), so neither Brees not Rivers were denied that season.

But in 2006, it probably would have gone to Brees, it not for the historic year that Tomlinson had.  Brees was the AP first-team All-Pro choice at QB, largely because of how he transformed the Saints offense from one of the worst to one of the best in a single offseason.  Tomlinson ran away with the vote, capturing 44 of 50 votes, but Brees was the runner-up with 4 votes to Manning’s two.  That said, I’m not sure I feel particularly bad for Brees on this point: advanced statistics point to Manning as having been the best quarterback that year, and by a decent margin.  The ’06 Colts were historically great at picking up first downs, Manning led in ANY/A, and Manning lapped the field in Total QBR.  Brees would have won the award based on factors other than pure merit, had it not been for Tomlinson’s performance.

Still, it’s hard not to feel bad for these teammates on the ’04 and ’05 Chargers.  For the last 12 years, Brees and Rivers have been behind Manning/Brady/Rodgers in 10 of 12 years, and also behind historically great single seasons from Brees’s NFC South rivals.   I went ahead and calculated how many Adjusted Net Yards each quarterback has provided, relative to league average, for each season since 2006.  The formula is simple.  In 2009, for example, Brees averaged 8.31 ANY/A (Adjusted Net Yards/Attempt, of course, is yards per attempt, with a 45-yard penalty for interceptions, deductions for sacks, and a 20-yard bonus for touchdown passes) and Rivers averaged 8.30 ANY/A, while the league average that season was 5.65.  Brees had 534 dropbacks, so he is credited with 1,422 Adjusted Net Yards of value added over average (8.31 – 5.65, multiplied by 534).  Rivers had 511 dropbacks, so he is credited with 1,356 ANY of value added over average.

In both 2008 and 2009, Brees and Rivers ranked 1st and 2nd in value added over average.  In ’08, both the Saints and Chargers finished 8-8; Manning, who led the NFL with 6 game-winning drives, won the AP MVP on the 12-4 Colts.  In ’09, Manning’s Colts began the year 14-0 before shutting things down for the season; Manning was always a shoe-in for that award, thanks to a whopping 7 fourth quarter comebacks in those 14 games; no other quarterback had more than 3 that season.  But in terms of ANY/A (and Value), Rivers and Brees were better choices than Manning both years.

In addition, Brees had three seasons where he ranked 2nd in value (’06, ’11, ’17) and two more where he ranked 3rd (’12, ’13). Rivers had a third 2nd-place finish in value in 2010 (behind MVP Brady), and also had a 3rd (2017), 4th (2013), and 5th (2006) place finish.

This year, both players are having remarkable seasons, but Rivers ranks 3rd in Value and Brees ranks 6th in Value. Yes, it looks like Patrick Mahomes or Jared Goff or even Todd Gurley could be what stops Brees and Rivers from that elusive first AP MVP Award.

The graph below shows Brees, Rivers, and the leader in Adjusted Net Yards over average for each year since 2006. The NFL leader is in red; Rivers is in Chargers colors, and Brees is in Saints colors.  Both Rivers and Brees have had a lot of great seasons, but seasons that fall just shy of MVP-level  great.

Rivers and Brees both were victims of Manning in ’08 and ’09, but the biggest snake eyes either of them rolled was in 2011. That year, Rodgers had his best season and was historically great — the only better seasons since ’06, by value, were Manning ’13 and Brady ’07. But Brees 2011 was also great — in fact, it’s the 5th-best season since ’06, with Ryan ’16 being the only other season ahead of him. It just so happens that Brees picked a bad time to have a career season.

{ 0 comments }

Previously:

Houston, Seattle, and Indianapolis were your three most run-heavy teams of the week, in large part because their team’s quarterbacks were so darn efficient. The Seahawks had the best passer rating of week 8, followed by the Texans, the Raiders, and the Colts. Seattle was noticeably rush-heavy: yes, the Game Script was heavily in Seattle’s favor, but the Seahawks became the first team in 2018 to rush on over 68% of plays.

On the other side of things, the Jaguars and Giants were the three most pass-happy teams of week 8. Jacksonville, a week after trading for Carlos Hyde, passed on 72% of all plays in a tight game… and that includes Blake Bortles being responsible for 8 of the team’s 17 runs! Including sacks, pass attempts, and rushes, Bortles was the Jaguars guy on 53 of 62 plays, or 85.4% of all Jacksonville plays.

The full week 8 Game Scripts data, below: [continue reading…]

{ 0 comments }