
In 1999 and 2000, no team in NFL history relied on one running back quite like the Indianapolis Colts. During those two seasons, Edgerrin James was responsible for 98% of all carries given to Colts running backs, 99% of all rushing yards from Indianapolis running backs, and 98% of all yards from scrimmage and 97% of all touchdowns scored by Colts running backs. The table below shows the stats from the nine running backs to play for the Colts during these two seasons: [continue reading…]
Jonathan Taylor had a season for the ages. Here are the top 10 yards per carry seasons by a running back with at least 300 carries:
| Games | Rushing | ||||||||||||
|---|---|---|---|---|---|---|---|---|---|---|---|---|---|
| Rk | Player | Age | Draft | Tm | Lg | Year ▼ |
G | GS | Att | Yds | Y/A | TD | Y/G |
| 1 | Jonathan Taylor | 22 | 2-41 | IND | NFL | 2021 | 17 | 17 | 332 | 1811 | 5.45 | 18 | 106.5 |
| 2 | Adrian Peterson | 27 | 1-7 | MIN | NFL | 2012 | 16 | 16 | 348 | 2097 | 6.03 | 12 | 131.1 |
| 3 | Chris Johnson | 24 | 1-24 | TEN | NFL | 2009 | 16 | 16 | 358 | 2006 | 5.60 | 14 | 125.4 |
| 4 | Frank Gore | 23 | 3-65 | SFO | NFL | 2006 | 16 | 16 | 312 | 1695 | 5.43 | 8 | 105.9 |
| 5 | Barry Sanders* | 29 | 1-3 | DET | NFL | 1997 | 16 | 16 | 335 | 2053 | 6.13 | 11 | 128.3 |
| 6 | Barry Sanders* | 26 | 1-3 | DET | NFL | 1994 | 16 | 16 | 331 | 1883 | 5.69 | 7 | 117.7 |
| 7 | Eric Dickerson* | 24 | 1-2 | RAM | NFL | 1984 | 16 | 16 | 379 | 2105 | 5.55 | 14 | 131.6 |
| 8 | Walter Payton* | 23 | 1-4 | CHI | NFL | 1977 | 14 | 14 | 339 | 1852 | 5.46 | 14 | 132.3 |
| 9 | O.J. Simpson* | 28 | 1-1 | BUF | NFL | 1975 | 14 | 14 | 329 | 1817 | 5.52 | 16 | 129.8 |
| 10 | O.J. Simpson* | 26 | 1-1 | BUF | NFL | 1973 | 14 | 14 | 332 | 2003 | 6.03 | 12 | 143.1 |
Provided by Stathead.com: View Stathead Tool Used
He joined Jim Brown, Jim Taylor, O.J. Simpson, Walter Payton, and Clinton Portis as the only players to average 100 rushing yards and 1 rushing TD per game while having a YPC average of at least 5.4. But perhaps most remarkably, he won the rushing crown by over 500 yards. If that sounds like a lot to you, it’s because it is. The last time a player run the rushing crown by such a large margin was Simpson back in his record-breaking 2,000 yard 1973 season. [continue reading…]
InIn one of the first posts at Football Perspective, I looked at the leaders in rushing yards over every 10-year period. The question asked in that article was who would ultimately lead the NFL in rushing yards from 2012 to 2021. We can now answer that question.
The answer may surprise you. I suggested that Trent Richardson was the obvious favorite. Among the names I offered as potential candidates were Mark Ingram, Dion Lewis, Jacquizz Rodgers, LeSean McCoy, Beanie Wells, DeMarco Murray, Doug Martin, David Wilson, Ronnie Hillman, Lamar Miller, Isaiah Pead, Kendall Hunter, and LaMichael James. I said that we could not rule out college stars like Marcus Lattimore or Michael Dyer or Montee Ball or Malcolm Brown or De’Anthony Thomas.
I said Ray Rice and Ryan Mathews, at 25-year-old in 2012, were probably too old to consider. That logic applied to 26-year-old stars Arian Foster and Marshawn Lynch. And while they may have been stud running backs, a quartet of 27-year-olds in Maurice Jones-Drew, Matt Forte, Adrian Peterson and Chris Johnson were clearly too old to consider.
I did not include Ezekiel Elliott or Derrick Henry, as both players were still in high school. As it turns out, barring injury in 2021, they will both finish in the top 5 of rushing yards from 2012 to 2021 despite both entering the league in 2016. Ingram, who was a 2nd-year player in 2012, will fall to 6th when Henry and Elliott pass him. The top 3? In a big surprise, the 27-year-old Peterson — then still recovering from a torn ACL — will wind up third on the list, and just over 300 yards away from the decade-lead. I named the 24-year-old McCoy one of the top candidates, and he will wind up 2nd on the list. But the leader in rushing yards from 2012 to 2021? [continue reading…]
Did you know that the Titans are 13-0 when Derrick Henry rushes for at least 100 yards? Analysts who have given more than a few seconds of thought know this is the kind of statistic doesn’t tell us much about causality. I’ll let Doug Drinen explain why, as he did back in May 2001 in a classic article on the types of tricks people use to lie with statistics:
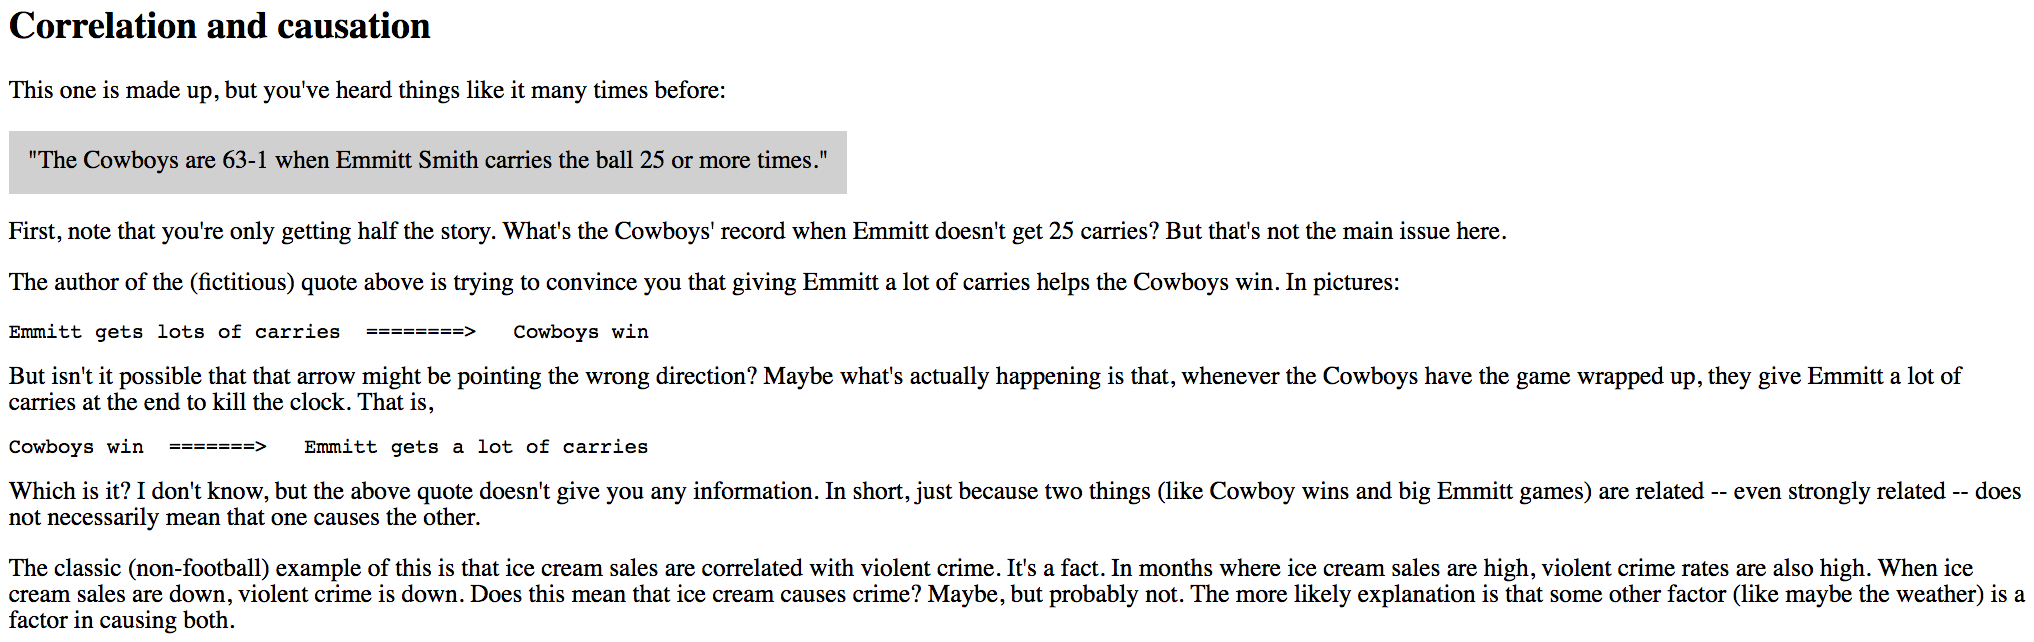
Thoughtful analysts have long known that while running successfully can help you win, winning definitely leads to more carries and more yards. That said, I wanted to actually investigate Henry’s 13 games with the Titans where he crossed the century mark and see: how much did it matter that he rushed for 100 yards?
Crossing the 100-yard mark did not help Tennessee win (3 games)
Week 4, 2019 vs. ATL – Boxscore
Henry rushed for exactly 100 yards in this game. His final carry was a 1-yard run on 3rd-and-11 that brought us to the two-minute warning. The Titans were up 24-10 at this point, so crossing the 100-yard mark was meaningless.
Week 13, 2017 vs. HOU – Boxscore
The Titans led 17-13 with 57 seconds remaining in the game. The Texans had just called their final timeout. Tennessee had 3rd-and-5 at their own 25-yard line, and a punt here would give Houston the ball back with a chance to win. However, Henry was sharing carries with DeMarco Murray at this point in his career, and with 57 seconds remaining, Henry had just 10 carries for 34 yards. On his final carry of the game, he rushed for 5 yards to pick up the first down and clinch the game… and then kept going for another 70 yards, scoring a touchdown to put the icing on the cake. Henry finished with 11 carries for 109 yards, but had he been tackled at the Houston 10-yard line and finished with 99 yards, the game was still over. A great run that clinched the game, to be sure, but him actually crossing the century mark was meaningless.
Week 6, 2017 vs. IND – Boxscore
Henry’s first 100-yard game, and a near mirror image of the game described above. Henry had 18 carries for 59 yards with 1:00 left in the game. The Titans, up by 7 points, had 3rd-and-5 at their own 28, with the Colts out of timeouts. A failed third down conversion would give Indianapolis a chance to tie the game, but Henry rushed for 5 yards to pick up the first down… and then 68 more. He finished with 19 carries for 131 yards, but crossing the 100-yard mark was not meaningful to helping the Colts win. Had he rushed for 6 yards, instead of 68 yards, the game still was over. [continue reading…]
Frank Gore keeps inspiring these posts. Yesterday, Frank Gore rushed for 65 yards, which gives him 19,155 yards from scrimmage for his career, moving him into 4th-place on the all-time list.
| Rank | Player | Scrimmage Yards | Years | Tm |
|---|---|---|---|---|
| 1 | Jerry Rice+ | 23,540 | 1985-2004 | 3TM |
| 2 | Emmitt Smith+ | 21,579 | 1990-2004 | 2TM |
| 3 | Walter Payton+ | 21,264 | 1975-1987 | chi |
| 4 | Frank Gore | 19,155 | 2005-2019 | 4TM |
| 5 | Marshall Faulk+ | 19,154 | 1994-2005 | 2TM |
| 6 | LaDainian Tomlinson+ | 18,456 | 2001-2011 | 2TM |
| 7 | Barry Sanders+ | 18,190 | 1989-1998 | det |
| 8 | Marcus Allen+ | 17,654 | 1982-1997 | 2TM |
| 9 | Curtis Martin+ | 17,430 | 1995-2005 | 2TM |
| 10 | Larry Fitzgerald | 16,940 | 2004-2019 | crd |
Provided by Pro-Football-Reference.com: View Original Table
This was also his 149th game with at least 50 rushing yards, which moved him alone into 2nd place in that category, too.
| Rk | Player | From | To | Tm | W | L | T | W-L% | 50+ Rush Yd G |
|---|---|---|---|---|---|---|---|---|---|
| 1 | Emmitt Smith* | 1990 | 2004 | DAL/ARI | 112 | 61 | 0 | .647 | 173 |
| 2 | Frank Gore | 2005 | 2019 | SFO/MIA/IND/BUF | 89 | 59 | 1 | .601 | 149 |
| 3 | Walter Payton* | 1975 | 1987 | CHI | 94 | 54 | 0 | .635 | 148 |
| 4 | Curtis Martin* | 1995 | 2005 | NYJ/NWE | 82 | 53 | 0 | .607 | 135 |
| 5 | Barry Sanders* | 1989 | 1998 | DET | 67 | 61 | 0 | .523 | 128 |
| 6 | Jerome Bettis* | 1993 | 2005 | PIT/RAM/STL | 83 | 44 | 0 | .654 | 127 |
| 7 | LaDainian Tomlinson* | 2001 | 2011 | SDG/NYJ | 80 | 45 | 0 | .640 | 125 |
| 8 | Tony Dorsett* | 1977 | 1988 | DAL/DEN | 86 | 33 | 0 | .723 | 119 |
| 9 | Franco Harris* | 1972 | 1984 | PIT/SEA | 92 | 26 | 1 | .777 | 119 |
| 10 | Adrian Peterson | 2007 | 2019 | MIN/ARI/WAS | 69 | 48 | 1 | .589 | 118 |
Provided by Pro-Football-Reference.com: View Original Table
Gore is 17 touches away from 4,000 touches, and 20 touches away from moving ahead of Curtis Martin into third place on that all-time list, too. But the stat that everyone is talking about now is that Gore moved ahead of Barry Sanders into third-place on the all-time rushing list.
| Rank | Player | Rushing Yards | Years | Tm |
|---|---|---|---|---|
| 1 | Emmitt Smith+ | 18,355 | 1990-2004 | 2TM |
| 2 | Walter Payton+ | 16,726 | 1975-1987 | chi |
| 3 | Frank Gore | 15,289 | 2005-2019 | 4TM |
| 4 | Barry Sanders+ | 15,269 | 1989-1998 | det |
| 5 | Curtis Martin+ | 14,101 | 1995-2005 | 2TM |
| 6 | Adrian Peterson | 13,861 | 2007-2019 | 4TM |
| 7 | LaDainian Tomlinson+ | 13,684 | 2001-2011 | 2TM |
| 8 | Jerome Bettis+ | 13,662 | 1993-2005 | 2TM |
| 9 | Eric Dickerson+ | 13,259 | 1983-1993 | 4TM |
| 10 | Tony Dorsett+ | 12,739 | 1977-1988 | 2TM |
| 11 | Jim Brown+ | 12,312 | 1957-1965 | cle |
Provided by Pro-Football-Reference.com: View Original Table
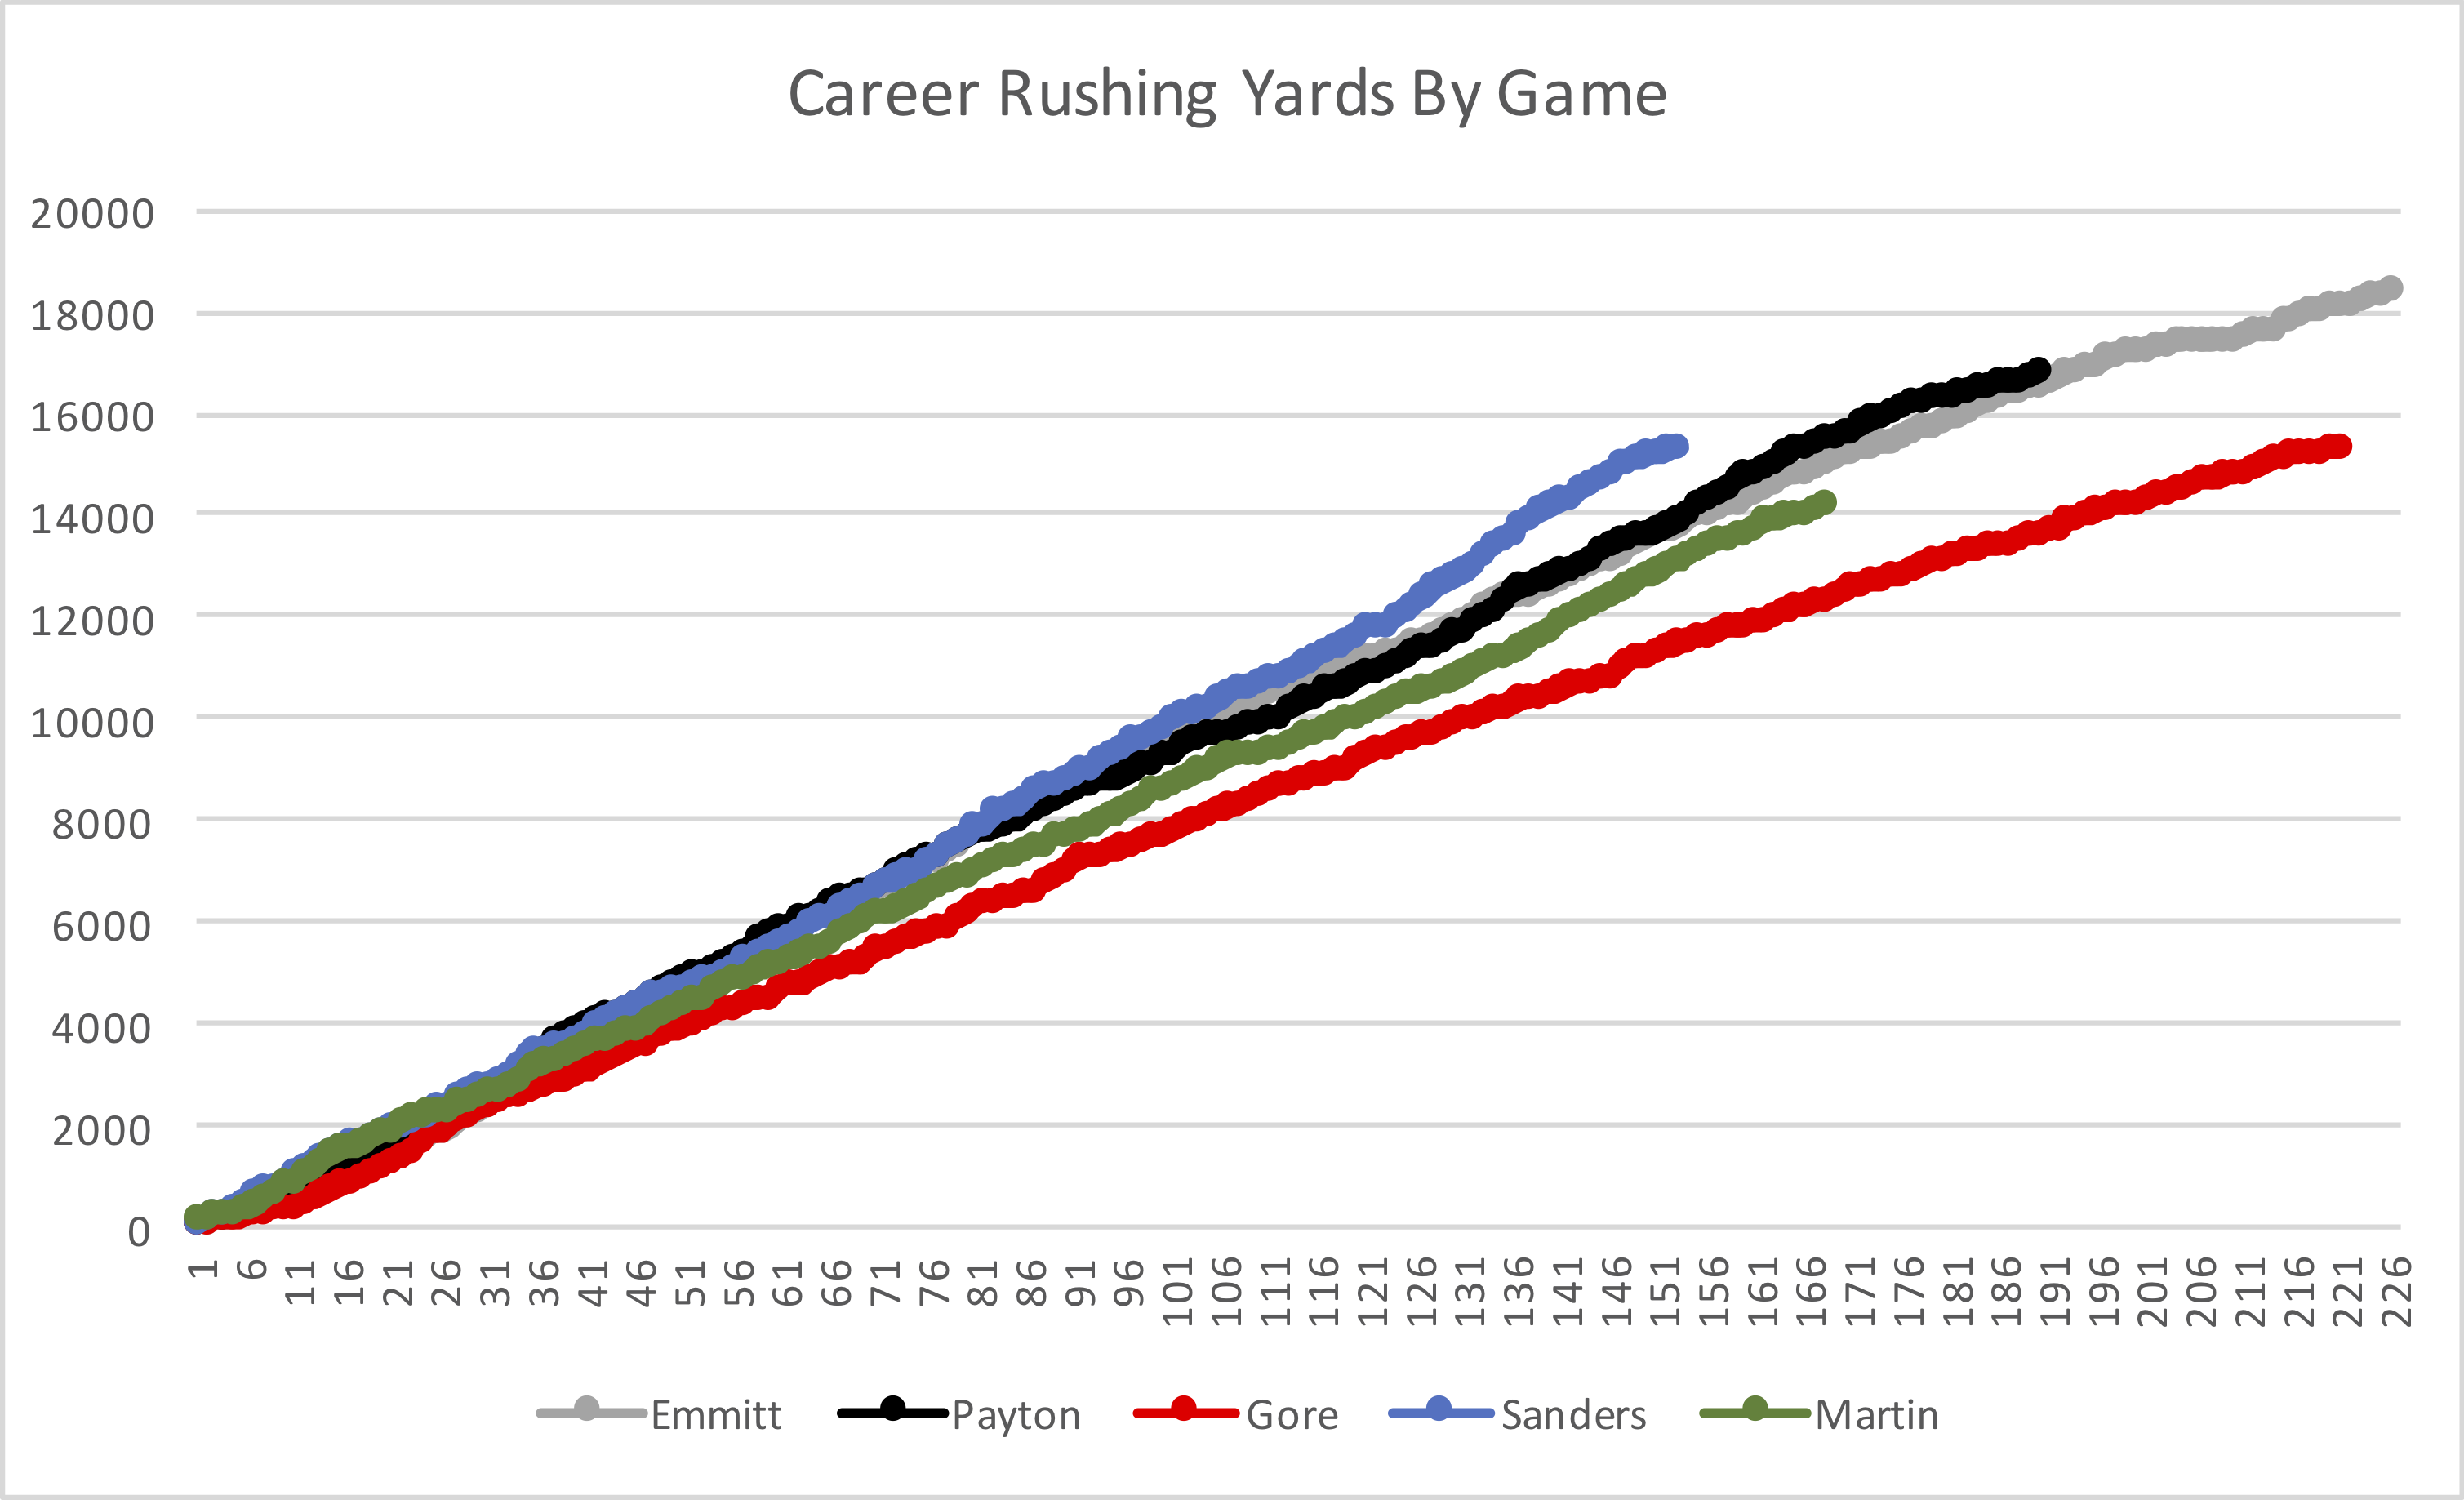
And while Gore was not as dominant as Sanders or Smith or Payton, in some ways that makes what he’s done more remarkable. The graph below shows the career rushing yards, after game X, for each of the players who rank in the top 5 in career rushing yards. Nobody but Hall of Fame running backs can keep producing after 150 games, but that’s what Gore has done. He was never as talented as Sanders or Payton, but his durability, toughness, and consistency is just as remarkable as the talent that those two backs had.
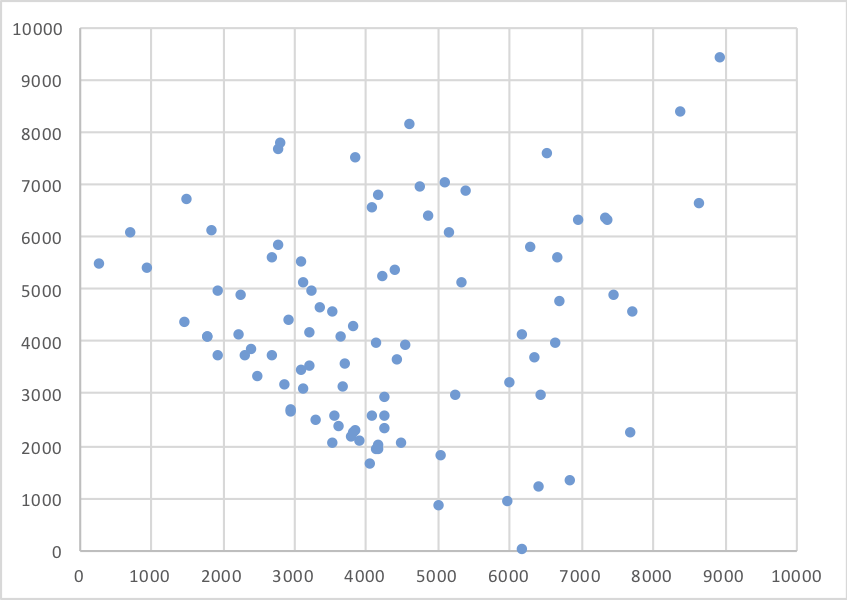
Prior to Gore, only three running backs — Emmitt Smith, John Riggins, and Walter Payton — rushed for over 5,000 yards in their 30s. All are Hall of Famers, as are two (Marcus Allen, John Henry Johnson) who came up just short of the post-30, 5K mark. Gore had an excellent career in his 20s, and then became the best running back in his 30s in NFL history. The graph below shows the 100 leaders in rushing yards in history. The X-Axis shows career rushing yards in a player’s 20s; the Y-Axis shows career rushing yards in a player’s 30s. [continue reading…]
You probably don’t think much about Vince Young these days, but I wrote a bit about him this summer. One thing that stood out to me about Young’s career was that for a running quarterback, he didn’t take many sacks. There are 20 quarterbacks since 1970 to rush for 1,000 yards and average at least 20 rushing yards per game in their careers; Young (5.98%) and Steve McNair (5.29%) are the only two quarterbacks with a sack rate below 6.5%.
Young’s best sack season was 2009, when he had just 9 sacks. Young actually finished with more rush attempts (55) than sack yards lost (36), which seemed basically impossible. Young remains the only player since at least 1970 to accomplish that fact, among quarterbacks with enough pass attempts to qualify for the passing title.
For his career, Young had 3.4 rush attempts for every sack, which is outstanding and the best mark among quarterbacks with at least 500 pass attempts (Tim Tebow was at 4.8, but he had just 361 pass attempts). But Lamar Jackson is hot on Young’s heels, and is quickly establishing himself as the best combination of rushing threat/sack avoider in NFL history.
Last year, Jackson didn’t qualify for the passing title, but he was even more impressive than 2009 Young when it came to sack yards lost and rushing attempts. As a rookie, Jackson had 147 rushing attempts and lost just 71 yards to sacks! Along with ’09 Young, he became just the third player with at least 6 times as many rushing attempts as sacks, minimum 150 pass attempts.
Jackson averaged 43.4 rushing yards per sack, which is basically an unfathomable number for a quarterback. And this year, Jackson’s sack rate has dropped from 8.6% to 7.3%; and while he’s running less, his rushing yards to sack ratio is still outstanding.
The top four seasons since 1970, minimum 100 pass attempts, in rushing yards to sacks are:
1) Lamar Jackson, 2018 (43.4 to 1)
2) Lamar Jackson, 2019 (33.9 to 1) [current through week 8]
3) Steve Young, 1991 (31.9 to 1)
4) Vince Young, 2009 (31.2 to 1)
For his career, Jackson is averaging 7.0 rushing attempts per sack. Tebow is at 4.8, Ray Lucas at 3.5, Young at 3.4, and then Kordell Stewart is fifth at 3.3. It is just as, if not more dramatic, when we look at rushing yards per sack.
Lamar Jackson is the leader at 38.5, followed by Tim Tebow at 24.1, Terrelle Pryor at 20.2, Michael Vick at 19.3, a young Josh Allen at 18.4, and then Vince Young at 17.6.
Some of Jackson’s crazy numbers here are just the result of him being the most rushing-heavy quarterback in modern history. He’s averaging an absurd 55 rushing yards per game for his career and an even more absurd 81 rushing yards per game since becoming a starting quarterback. But most of the other really run-oriented quarterbacks had bad sack rates: Tebow was at 10.2%, Bobby Douglass 12.2%, and Michael Vick was at 9.8% when with the Falcons. Jackson is at 7.9%, and I’ll be curious to see if he can keep this going.
I’ll close with a graph showing all quarterbacks since 1970 with at least 224 pass attempts. The X-Axis shows career rushing yards per game, while the Y-Axis shows career sack rate. See if you can spot Jackson.
And yes, it was important to get this in before Jackson faces the Patriots this weekend.
In 1977, the Kansas City Chiefs went 2-10. This was during one of the worst passing seasons in NFL history, the season that encouraged the 1978 rules changes. Quarterback Mike Livingston went 1-10 as the starter and he was about as bad as his record. Kansas City brought him back as the team’s starter in 1978, but changed coaches, bringing in Marv Levy. The future Bills coach inherited a terrible team in Kansas City that was particularly inexperienced on defense: all three starters on the defensive line were rookies, as was one of the linebackers; two other starters were ’77 draft picks, and another two starters were 24-year old players drafted in 1976. That’s 8 of 11 starters on defense that were 24 or younger, to go with a a bad passing attack centered around Livingston, and WRs Henry Marshall and Larry Dorsey.
So what did Levy do? He decided to install the Wing-T offense, centered around three halfbacks, a tight end, and Marshall at split end. Kansas City had Tony Reed as the starting halfback, Arnold Morgando as the fullback, and Ted McKnight as the Wingback as part of a ball-controlled offense designed to keep the young defense (and weak passing game) off the field. But on October 1st, 1978, it was veteran backup Macarthur Lane — with the emphasis on veteran — that powered the offense. Lane rushed 17 times for 144 yards in a game where Livingston and backup Tony Adams combined to complete 9 of 21 passes for just 83 yards.
So why is this noteworthy today? Well, on October 1st, Lane was 36 years and 199 days old. Playing in that Wing-T offense, he became the oldest player to ever rush for 100 yards in a game. And yesterday, Frank Gore nearly matched him. The ageless Gore rushed 17 times for 109 yards in a Bills loss to the Patriots. He wasn’t aided by a Wing-T offense, but the 36 year, 138-day old back did his best to keep the Bills alive on a day where the passing attack was a disaster (averaging 1.22 ANY/A).
And historians, take note: Gore will be 36 years and over 200 days old for the Bills four games in December, making him eligible to set the new record for the oldest player to rush for 100 yards in a game. [continue reading…]
Yesterday, I looked at rushing success rate for individual running backs. Today, I perform the same analysis for running backs, but at the team level (and ignoring runs by non-RBs).
Here’s how to read the table below. The Rams led the NFL in rushing success rate by running backs last season. Los Angeles RBs had 363 carries (after removing 3rd or 4th and long runs that did not pick up a first down) and 228 of them were successful, a 62.8% conversion rate. That was the best rate in the NFL. As noted yesterday, Todd Gurley was great (60.2%), but the other Rams running backs had even higher rates. It was truly a remarkable rushing attack in Los Angeles last year, at least until the NFC Championship Game and the Super Bowl. [continue reading…]
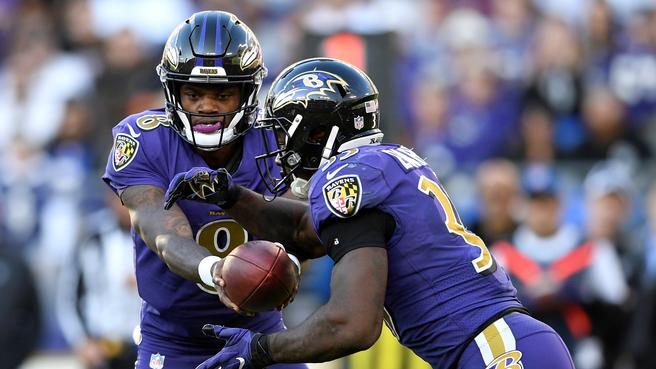
A pair of rookies powered the Ravens rushing attack.
Today, I want to study running back success rate. What do I mean by that? It’s simply the number of successful running plays divided by the total number of running plays; in other words, it’s the rushing analog of completion percentage. How am I calculating this metric?
Let’s start with the denominator: which rushing plays are included? All rushing plays are included but with one exception: I have discarded all runs (a) on 3rd or 4th down, (b) with greater than 5 yards to go, and (c) where the running back failed to get the first down. If a team calls a run play on 3rd-and-6, I am not going to fault the running back. I will simply discard the play. However, if he actually picks up the first down on 3rd-and-15, I will count the play. Only 3% of rushing plays were excluded using this, but it just “feels” like the right thing to do. [continue reading…]
In 2015, Thomas Rawls averaged 5.65 yards per carry, best in the NFL. The next year, Rawls averaged just 3.20 YPC, the second-worst rate in the league. That’s an extreme case (actually, the most extreme case), but it does represent the general idea that yards per carry is simply not very sticky from year to year.
In the graph below, I have shown all running backs who had at least 100 carries in back to back years since 1970. The X-Axis shows the YPC each player had in Year N, and the Y-Axis shows the YPC that player had the following year, Year N+1. The R^2 shows the correlation between those two numbers. The best-fit formula to predict Year N+1 Yards per Carry from Year N Yards per Carry is 3.05 + 0.28 * Year N YPC. The R^2, of course, is the square of that 0.28 coefficient. Take a look at this graph:

What if we raise the minimums to 150 carries both years? [continue reading…]
Regular readers are familiar with my running back heat maps, but let’s use Ezekiel Elliott and Saquon Barkley as examples.
Last season, Elliott and Barkley finished first and second in rushing yards and rushing attempts. Elliott averaged a very strong 4.73 yards per carry, but Barkley had a sparkling 5.01 YPC average. However, there is more than meets the eye.
Elliott rushed for positive yards on 83% of his carries; that’s pretty good, because the average among all running backs with at least 100 carries was 81%. Meanwhile, Barkley rushed for positive yards on only 77% of his carries. Elliott rushed for at least 2 yards on 71% of his carries; Barkley did it on just 61% of his carries. Gaining at least 3 yards? Elliott did that 55% of the time, while Barkley did it just 48% of the time. This trend holds true for awhile: Elliott picked up at least 4, 5, and 6 yards on 45%, 35%, and 29% of his carries; for Barkley, those rates were 38%, 30%, and 25%, respectively.
At least 7 yards? Elliott did that on 24% of his carries, while Barkley only rushed for 7+ yards 18% of the time. It gets a little closer at 8 and 9 yards, but Elliott still wins, 18% to 16% and 16% to 15%.
How about at least 10 yards? The Cowboys star gained 10 or more yards on 13% of his rushes; Barkley did it on 12% of his carries. How about 15+ yards? Elliott hit that mark on 8.2% of his carries, while the Giants start did it on 7.7% of his rushes. So how in the world did Barkley finish the season with a higher yards per carry average? Because Elliott rushed for 20+ yards on just 4% of his carries, while Barkley did it on 6% of his carries. More importantly, Elliott’s longest run was 41 yards, while Barkley had runs of 46, 50, 51, 52, 68, 68, and 78. That’s how, despite Elliott pretty much “winning” at each distance, he lost the YPC battle. Even if Elliott had big runs more often, Barkley’s big runs were really big runs. [continue reading…]
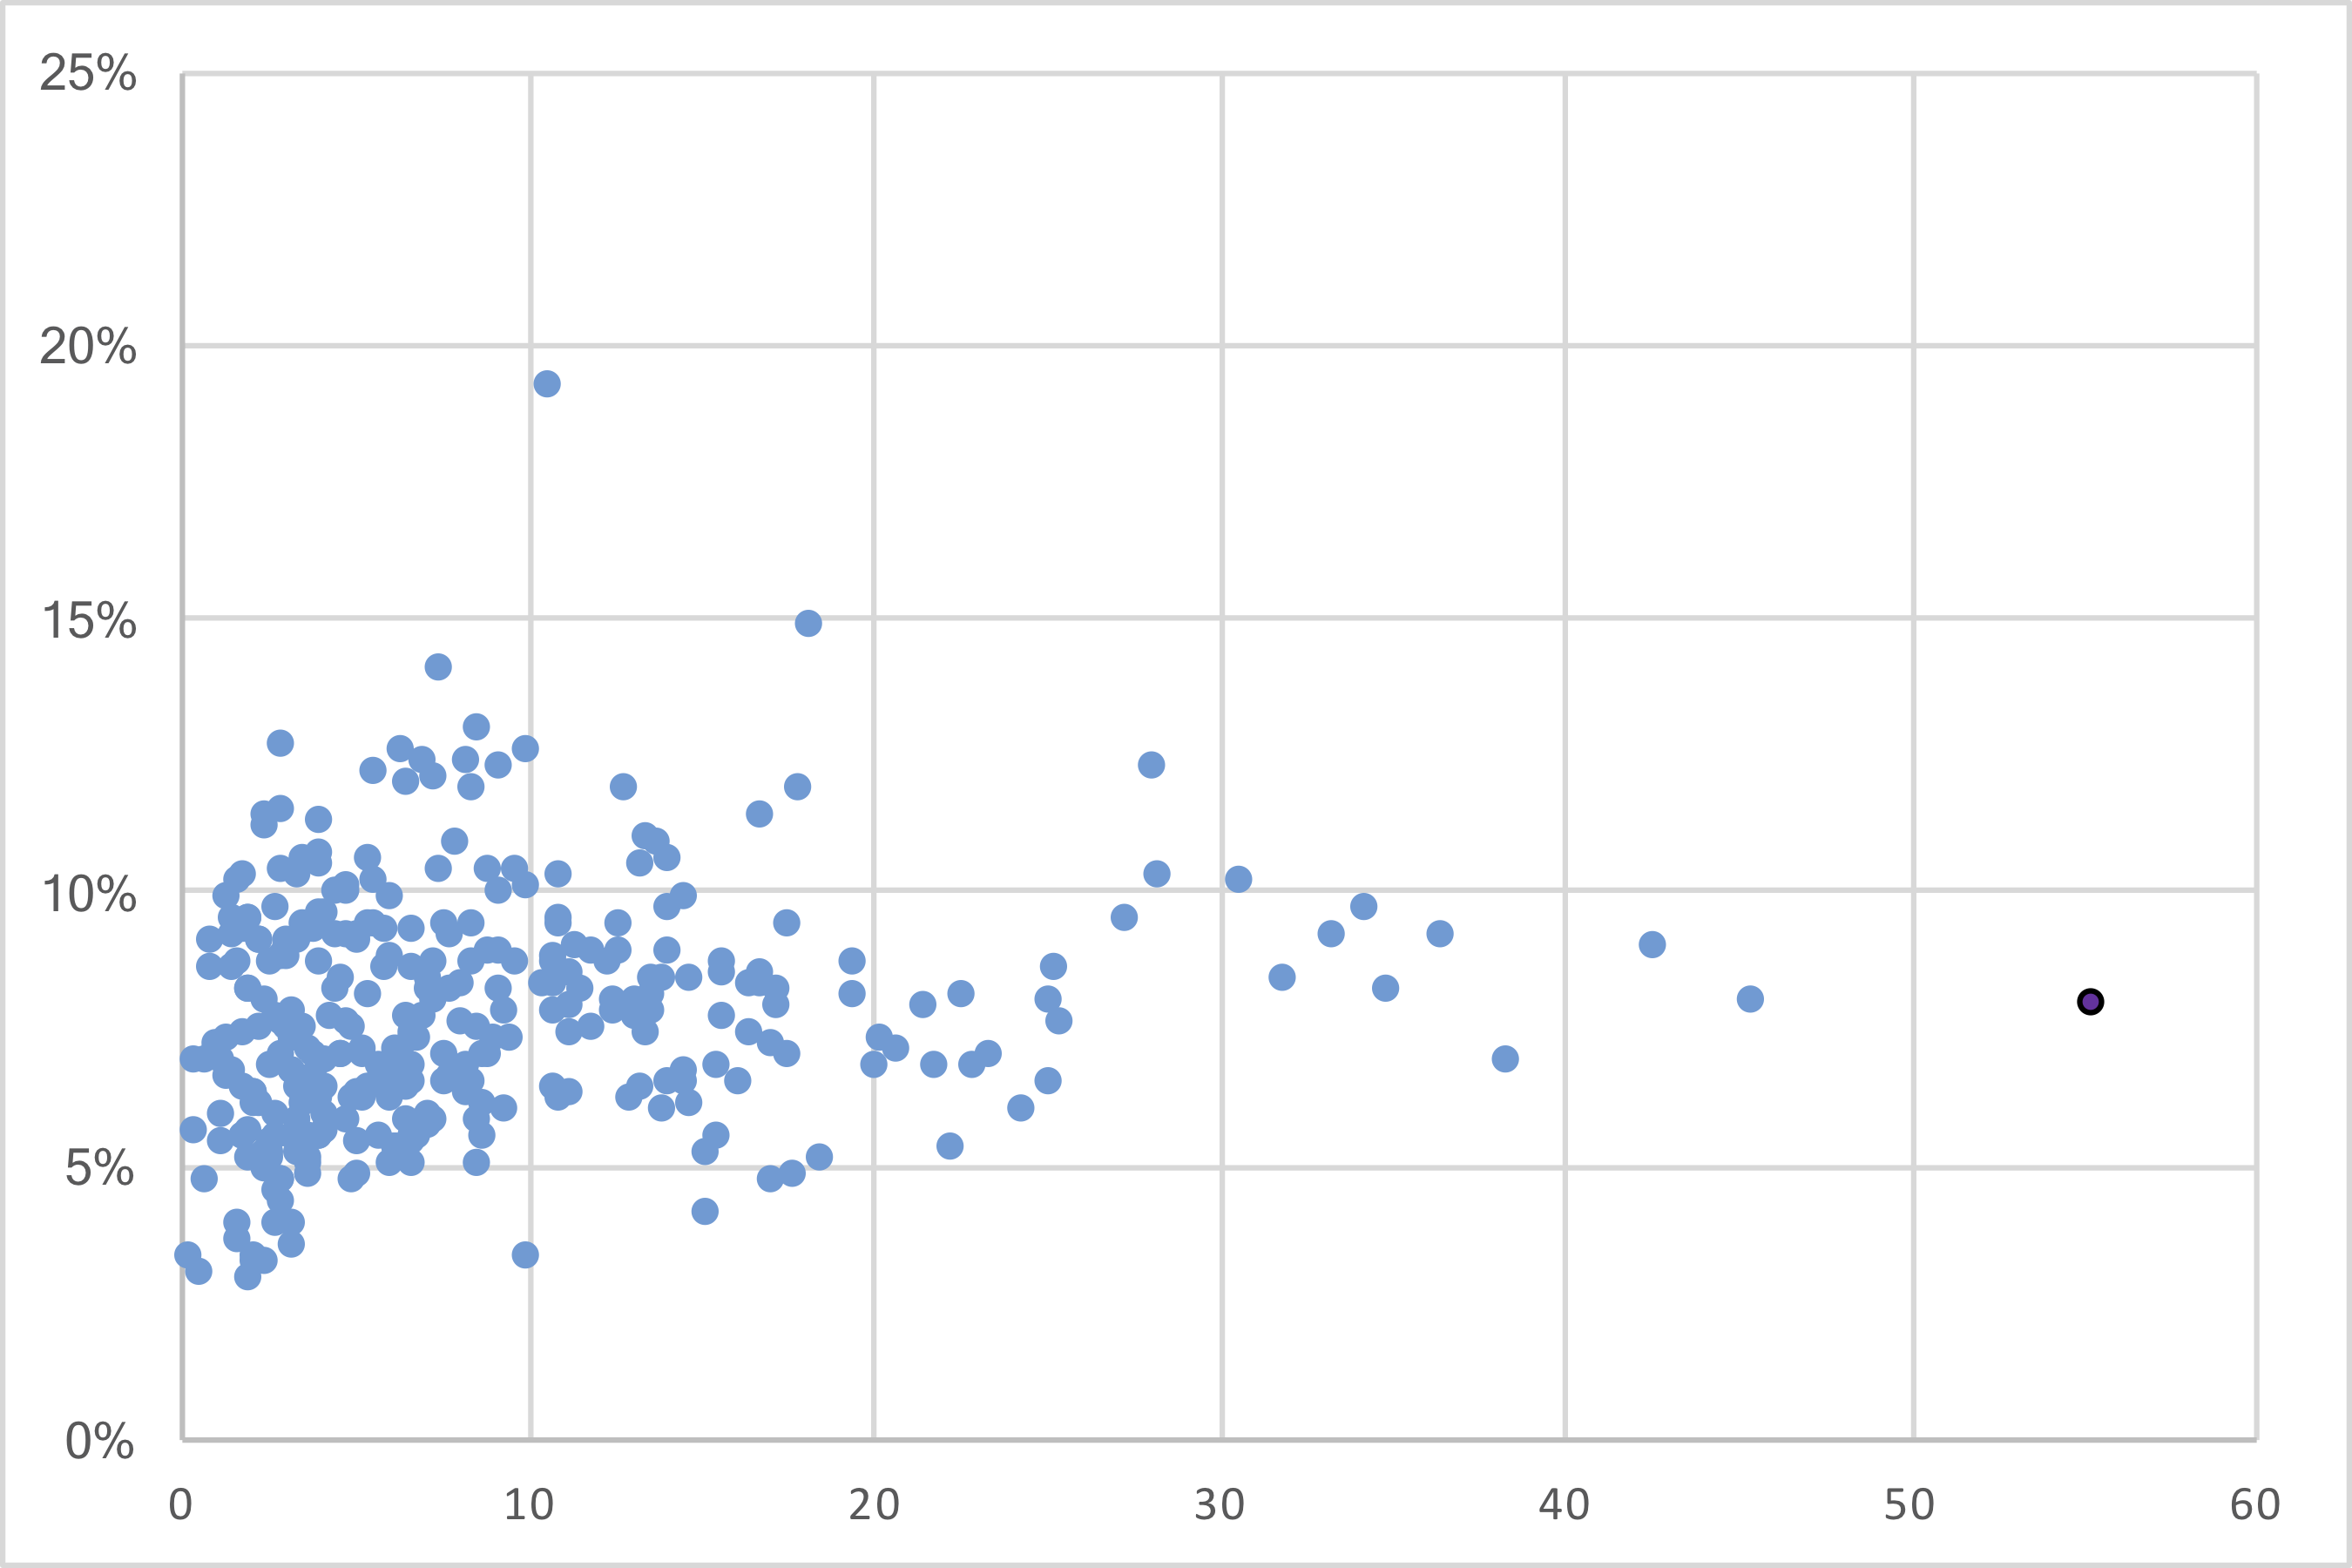
In 2018, there were over 80 games where a running back had at least 20 carries in the game. How would you expect those carries to be distributed?
I don’t think you would expect him to have 10 carries in each half, or 5 carries in each quarter, or to average 1 carry every 3 minutes. I would expect a number of those carries to be at the end of the game, because these are games the team usually won (I also eliminated all games that went to overtime, to limit the sample to just 60 minutes of regulation) and running backs tend to get carries late in games when they are ahead.
That…. isn’t quite the case. Below are the average number of carries by these running backs over every minute of the game. It’s true that these running backs with 20+ carries in the game are often getting carries in minute 56, 57, 58, and 59, but not to an extreme level (also interesting although not surprising: there are very few carries in the final minute of the game; that’s because teams typically kneel in this situation). [continue reading…]
Barkley ranks 3rd in yards from scrimmage in 2018.
In 2016, Ezekiel Elliott was the 4th overall pick. He helped the Cowboys to a 9-win improvement.
In 2017, Leonard Fournette was the 4th overall pick. He helped the Jaguars to a 7-win improvement.
On their own, of course, neither player was worth that many wins. But that was part of the argument used when the New York Giants took a running back — Saquon Barkley in this instance — with the second overall pick, ahead of say, Sam Darnold. The thought process was that the Giants might have one last run in them under Eli Manning, and Barkley could have an Elliot- or Fournette-like impact for Big Blue. And there was evidence that drafting a top-5 running back typically leads to a big improvement in wins for a team; in addition to Elliott and Fournette, Reggie Bush and the three running backs selected in the top 5 of the ’05 Draft all added at least 5 wins to their teams.
On one hand, Barkley clearly didn’t lead to that sort of impact. In 2017, the Giants went 3-13; this year, New York is 5-10, pending a meaningless week 17 game against the Cowboys. On the other, Barkley has probably exceeded even the most optimistic of expectations, producing 1,884 yards from scrimmage through 15 games. Whatever you thought about Barkley the prospect, Barkley the NFL player certainly hasn’t disappointed.
But that only serves to underscore how a star running back isn’t worth a top-5 pick, especially in a draft with potential franchise quarterbacks available. Barkley has averaged 4.9 yards per carry (10th-best), rushed for 1,198 yards (3rd-best) and rushed for 10 touchdowns (5th-best): he has been a big improvement on the ground for an offense that relied on Orleans Darkwa and Wayne Gallman last year. And as a receiver, Barkley has lived up to the billing: he has 87 receptions on a 77.0% catch rate and has averaged 7.9 yards per catch. He hasn’t lost a fumble all season!
But the Giants, perhaps in part due to bad luck, have remained a bad team. New York is 2-4 in games decided by 3 or fewer points, and 4-7 in games decided by a touchdown or less, so maybe the Giants should have won 6 or 7 games already. Barkley has made the Giants a better team — or, at least, a better offense — but there remains a limit to how much value a running back can provide in the 2018 NFL.
The biggest red herring, I think, comes in the terms of receiving yards. Barkley has 688 receiving yards, which sounds great until you realize that Barkley has 21% of Giants targets and 24% of Giants receptions, but only 17% of Giants receiving yards and 15% of Giants first downs. This isn’t a knock on Barkley as much as it is a knock on the position: for the most part, running backs don’t make a big contribution in the passing game, even when they have a lot of receptions.
Consider that Barkley had 113 targets. Of those:
- 26 were incomplete passes;
- 16 were third down receptions that did not pick up a first down;
- 8 were first or second down receptions that gained negative or zero yards
That’s 50 of 113 targets that did not provide value, compared to 28 of 113 targets that gained a first down. Again, this isn’t much of a knock on Barkley the player: for a running back, it’s extremely difficult to provide significant value in the passing game. [1]By way of comparison, let’s look at Le’Veon Bell in 2016, who is known for being a big boon in the passing game. He had 118 targets last year. 24 were incomplete passes, 7 were third … Continue reading And in the modern NFL, there’s a very real cap as to the value a running back can provide in the running game, while passers are picking up first downs with relative ease. By comparison, Barkley has gained a first down on just 18% of all rushing plays.
Barkley looks like he may be the next great running back, but it’s not looking like he was a great choice with the #2 pick.
References
| ↑1 | By way of comparison, let’s look at Le’Veon Bell in 2016, who is known for being a big boon in the passing game. He had 118 targets last year. 24 were incomplete passes, 7 were third down receptions that did not pick up a first down, and 9 were first/second down receptions that gained negative or zero yards. Meanwhile 35 went for first downs. That’s obviously better than Barkley, but still results in more clearly bad pass plays than clearly good ones. |
|---|
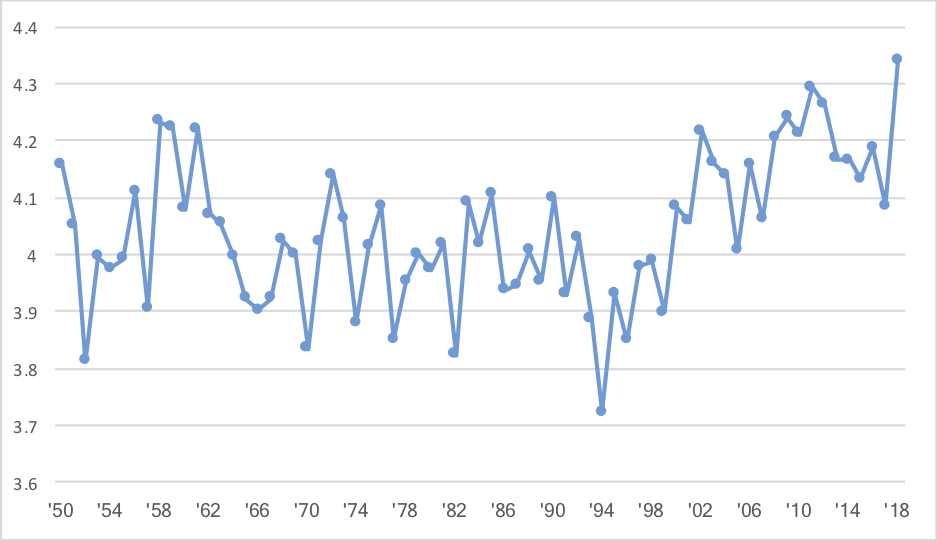
Rushing yards per carry continues to rise: a month ago, I noted that the league-wide yards per carry average was 4.34. If that held, it would set a new record, breaking the 4.29 mark set in 2011.
Since then, rushing efficiency has soared: since week 9, the Panthers are averaging over 6 yards per carry, 9 more teams are averaging over 5 yards per carry, and a total of 23 teams are averaging 4.29 YPC or better. The great rushing performance of the last month (4.61 YPC) has raised the 2018 league average mark to an incredible 4.44 yards per carry.
And yet, rushing quantity has never been lower. For the season, teams are rushing just 25.7 times per game, and even since week 9, that level is just 26.0 rushing attempts per game. This will go down as the season with the fewest rushing attempts in history, and also the season with the highest yards per carry average in history. The common theme here is passing: teams are passing more than ever, and defenses don’t seem very concerned about stopping the run. Offenses want to pass, and defenses are more than happy to allow teams to run (including via non-running back runs). That’s how you get crazy results like this.
And how crazy are these results? Well, take a look at the graph below, which shows every NFL season since 1932. Each year is on the X-Axis, and there are two Y-Axes: the left Y-Axis shows yards per carry, and the right Y-Axis shows rushing attempts per game. The NFL average yards per carry is shown in blue dots against that left Y-Axis, and the NFL rushing attempts per game is shown in red diamonds against the right Y-Axis.

This season, the average carry in the NFL has gained 4.34 yards. That would set a new record, and it would also represent a large 0.25 YPC increase over last season’s average. The graph shows the YPC average in every NFL season since 1950:
Jets running back Isaiah Crowell had a remarkable game on Sunday against the Broncos. He made the most of his 15 carries, producing a 77-yard rushing touchdown, along with carries of 54, 36 and 15 yards. He finished the day with 219 rushing yards, setting a new Jets franchise rushing record in the process.
Do you know what else he did? He averaged 14.33 yards per carry, the highest single-game YPC average by any player in history with at least 15 carries. That made me wonder: what are the highest single-game yards per carry averages at all carry levels?
Joey Galloway holds the record for yards per carry in a game, at 86.0. He did that on one carry, as you could probably guess (and what a carry it was). Up the minimum threshold to 2 or more carries, and Brian Mitchell is your record-holder: he averaged 52.2 yards per carry on 2 carries for 105 yards. At 3+ carries, Cordarrelle Patterson was the record-holder, with a 3-102-34.3 performance … until Browns running back Nick Chubb broke that mark in week 4 of this season against the Raiders with 3 carries for 105 yards. At 4+ carries, Latavius Murray holds the record with a 28 yards per carry average. And so on. [continue reading…]
Let Emmitt Smith always stand out as the counterexample to the idea that a heavy workload is bad for a player’s future. Smith is the only player in NFL history to record 2,000 carries before the end of his age 26 season (he also has a record 279 postseason carries through his age 26 season). And yet Smith remains the only player in NFL history to pick up 9,000 rushing yards from age 27 through the end of his career.
Yesterday, I looked at the question of when is a player’s career half over. The sample there was all retired players with at least 5,500 career rushing yards and at least 750 rushing yards in their best season. The most common age to be the “midpoint” of a player’s career was his age 26 season. Today, a look at the amount of rushing yards gained by players through their age 26 season (on the X-Axis), and from their age 27 through the rest of their career (on the Y-Axis).
Le’Veon Bell turned 26 years old in February, which means — if he winds up playing much in 2018 — he might be halfway done with his career by the end of this season.
Does that feel like an exaggeration to you? I looked at all players who had at least one season with 750+ rushing yards, had at least 5,500 career rushing yards, and were retired. And about half of those players had rushed for at least half of their career rushing yards by the end of their age 26 season. That season was by far the most common mid-point, with 34 out 94 players hitting their 50% career mark during their age 26 season. This includes Walter Payton, Barry Sanders, LaDainian Tomlinson, Jerome Bettis, Eric Dickerson, and Marshall Faulk; it’s also where Adrian Peterson and Marshawn Lynch would be had they retired after 2017. [continue reading…]
During the season, I looked at the Carolina Panthers and how their team rushing stats were a bit misleading.
The Carolina Panthers have rushed for 982 yards this year, an average of 109.1 per game. That ranks 15th in the NFL, and just a hair above the league average rate of 108.1 rushing yards/game. But the Panthers don’t have anything resembling a traditional ground game: of those 982 yards, starting running back Jonathan Stewart has just 350 of them, while quarterback Cam Newton has 341 rushing yards, the most of any quarterback in the NFL in 2017.
In addition, wide receivers Curtis Samuel, Damiere Byrd, and Russell Shepard have combined for 87 yards; that’s the third-most rushing yards in the league for any team behind the Rams (Tavon Austin) and Raiders (Cordarrelle Patterson) among non-QB/non-RBs. In fact, Panthers running backs are averaging just 61.6 rushing yards per game, the fewest in the NFL.
Carolina’s running game improved the rest of the way, but that was thanks to both Newton and the traditional ground game improving. The Panthers finished the season 4th in rushing yards, which sounds really good! But Carolina also ranked just 27th in rushing yards by running backs, which, well, doesn’t sound very good. The table below shows where each team ranked in rushing yards by running backs, along with in just raw rushing yards: [continue reading…]
On Saturday, I wrote about Gray Ink for rushing yards, and showed the career leaders using the methodology described in that post. Today, we do the same but for Yards from Scrimmage.
One interesting player is LeSean McCoy, who continues to look like a Hall of Famer. He ranked 15th in Rushing Yardage Gray Ink, which puts him comfortably in the group of Hall of Fame rushers. This is due to a number of strong seasons: he led the NFL in rushing in 2013, ranked 3rd in 2014, 4th in 2011 and 2017, and 6th in 2016. He also has a good chance (he needs 1700 more rushing yards with the Bills) of becoming just the third player with 5,000 rushing yards with two different teams.
Well, McCoy also ranks 15th in Yards from Scrimmage Gray Ink. He led the NFL in YFS in 2013, and ranked 4th in 2010 and 2017 and 5th in 2011 and 2016. He leads the NFL in yards from scrimmage since entering the league, too.
The table below shows the top 100 players in Gray Ink in terms of Yards From Scrimmage: [continue reading…]
Yesterday, I looked at Gray Ink for running backs. You can read the details there, but today I wanted to delve into the specifics behind each player’s grade.
The table below shows the results for each running back in each season where he finished in the top 10 in rushing. It’s fully sortable and searchable. Let’s use Edgerrin James as an example. If you type his name into the search box, you’ll see the following: In 2000 and 1999, he led the league in rushing, and received 9.8 points for each year. In 2004, he ranked 4th in rushing, and gets 7 points for that finish. In ’05, he ranked 5th and in ’07 he ranked 7th; he gets 6 and 4 points for those performances. In total, James receives 36.7 points of Gray Ink, the most of any non-HOFer among eligible running backs. [continue reading…]
On Thursday, I looked at a measure of passing efficiency and gray ink: where a first place finish rewards a player with 10 points, a second-place finish 9 points, a third-place finish 8 points, and so on. Today, I’m going to do the same thing but with rushing yards, so a rushing crown is worth 10 points, a runner-up title is worth 9 points, and so on. You can read a few twists in this footnote. [1]I want to give more credit to seasons where there were more teams. So when Kareem Hunt led the 32-team NFL last season, that was worth 10 points. What about when Pug Manders led the 9-team NFL in … Continue reading
Let’s use Barry Sanders as an example. In four seasons, he led the NFL in rushing (+40 points), and in three other seasons, he was the runner up (+27 points). He also had two seasons where he ranked 4th in rushing yards (+14) and one season where he ranked 5th (+6), for a total of 87 points. Using the pro-rated method explained in the footnote, since there were fewer than 32 teams during his career, Sanders actually gets credit for 82.7 points. That is still the most of any player in history: [continue reading…]
References
| ↑1 | I want to give more credit to seasons where there were more teams. So when Kareem Hunt led the 32-team NFL last season, that was worth 10 points. What about when Pug Manders led the 9-team NFL in 1941? That feels less meaningful, and that is especially true when comparing a 9th-place finish in 2017 to a 9th-place finish in 1941. One option is to take the number of points — say, 10 — and divided it (32/X), with X being the number of teams in the league. So if there are 9 teams, you would take 10 and divide it by 3.55, and get 2.8 points. That feels too extreme to me: it would make a first-place finish in a 9-team league less valuable than an 8th-place finish in a 32-team league. So do I use 10 points or 2.8 points… or do I split the baby? Well, that’s what I did: I averaged those two numbers to get 6.4 points, equal to a 4th- or 5th-place finish today. I was comfortable with that result, but your mileage may vary.
Other thoughts: I combined all AFL and AAFC seasons. Probably not ideal, but it was the quickest/simplest thing to do. |
|---|
Let’s start with some trivia.
Which running back has the most 100-yard rushing games in his career?
| Click 'Show' For the Answer | Show |
|---|---|
There have been 11 running backs who have rushed for 100+ yards in a winning effort in 40 or more regular season games. Ten of them are in the Hall of Fame, but the man who has done it 51 times — the third most ever — is not (and is eligible). Name him.
| Click 'Show' For the Answer | Show |
|---|---|
Which running back has the best winning percentage in games when he rushed for 100+ yards, minimum 15 games?
| Click 'Show' For the Answer | Show |
|---|---|
Which running back has the best winning percentage in games when he rushed for 100+ yards, minimum 30 games?
| Click 'Show' For the Answer | Show |
|---|---|
Here’s a record that I am confident will not be broken in the next 20 years, and might not ever be broken at all. One running back rushed for 100+ yards in a game that his team lost 32 times in his career. No other player has done it more than 23 times. To get a sense of comparison, Adrian Peterson and Steven Jackson have done it 31 times, combined. Name him.
| Click 'Show' For the Answer | Show |
|---|---|
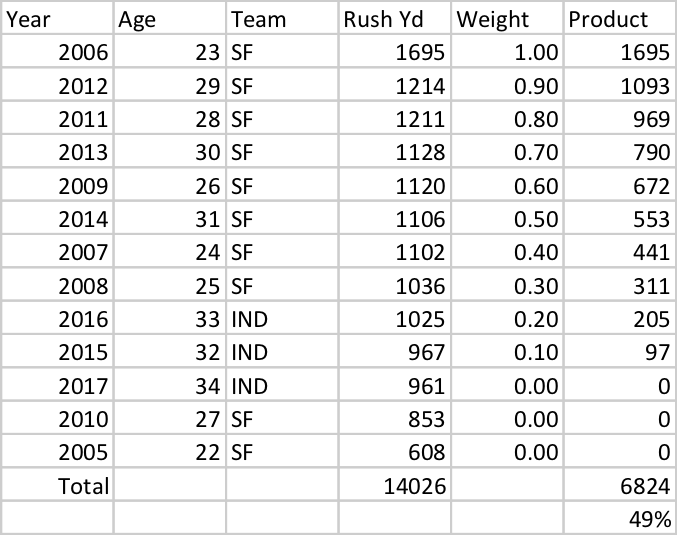
Frank Gore has had a remarkable career. He’s averaged at least 60 rushing yards per game in 12 different seasons, second only to Emmitt Smith. But it’s also been somewhat remarkable in how unremarkable each season has been: Gore averaged a nondescript 43.4 rushing yards per game as a rookie and then an eye-popping 105.9 rushing yards per game in his second season; since then, for 11 straight years, Gore has averaged between 60 and 80 rushing yards per game. No other player has more than 7 such seasons in their career, let alone consecutive, with Warrick Dunn, Franco Harris, and Ricky Watters tied for second place on the list.
So far, Gore has rushed for 14,026 rushing yards in his career. But I wanted to try to identify similar — and dissimilar — rushers to Gore. So here’s what I did: for each running back, I identified his rushing yards in each season of his career. For seasons where the league had fewer than 16 team games per season, I pro-rated that player’s production as if the league had 16 games. So players in a 14-game season get their rushing yards bumped by 14.3%, regardless of how many games they played. Then, I gave a player 100% credit for their best rushing season, 90% credit for their second best rushing season, 80% credit for their third best rushing season, and so on. Doing this gives Gore just 6,824 rushing yards, just under half of his actual total.
Two years ago, I looked at running back heat maps for the 2015 season; that was a fun article, so let’s update those numbers for 2017. This builds off of yesterday’s post about yards per carry.
Last season, Steelers running back Le’Veon Bell led the NFL in rushing attempts. How did Bell fare? Well, he had a slightly below-average 4.02 yards per carry average, but that was due to a lack of big plays. You may be as shocked as I was to learn that Bell didn’t have a single rush go for even 30 yards; his long of the year was a 27-yard rush against the Chiefs. It’s hard to stand out in yards per carry without big runs, and Bell is a good example of how you can still be an effective runner without big gains.
Bell rushed for positive yards on 85% of his carries; that’s very good, because the average among all running backs with at least 100 carries was 80%. In fact, Bell was 5% or 6% above average at gaining at least 1, 2, or 3 yards on all of his carries last year, and he was above average at gaining at lest 4, 5, 6, 7, 8, 9, or 10 yards. And Bell gained at least 15+ yards on 4% of his carries, matching the league average. But Bell gained at least 20 yards on only 1% of his carries (and, of course, at least 30+ yards on 0% of his carries), compared to the league average of 2%. That’s the only reason Bell comes in with a below-average YPC number from 2017.
In the picture below, I’ve listed all running backs with at least 100 carries. I have then shown how they fared at rushing for at least 1 yard, at least 2 yards, at least 3 yards,… at least 10 yards, at least 15+ yards, and at least 20+ yards. A blue shading is good: that means a player gained yards at a higher clip than average. A red shading is bad, even though this is a heat map, since I think it makes more sense to associate red with bad (if you don’t like the way my brain works, you can let me know in the comments). [continue reading…]
Three years ago, I wrote this post titled “Take Away His X Best Carries and He’s Average.” I did the same thing last year, too. The idea was simple: Suppose you sort each running back’s carries in descending order by yards gained. How many carries would we need to take away from him to drop his production to at or below average?
There were 47 running backs last season who had at least 100 carries in 2017, those players averaged 4.08 yards per carry last season. The best running back by yards per carry last season, by far, was Alvin Kamara, with a remarkable 6.07 average gain. Kamara had just 120 carries last year, but he was remarkable at producing big runs. He had 13 carries of 15+ yards last season, an unfathomable (and unsustainable) rate of one 15+ yard run every 9.2 carries. Kamara’s lofty YPC number wasn’t the result of one big run, which is often the case for a player with a high YPC average on a low number of runs: sure, Kamara had a 74-yard run, but no other run went for more than 25 yards.
In fact, if you removed Kamara’s 12 best runs, he would have still averaged 4.083 YPC, a hair above the 4.078 average among all running backs with 100+ carries. So in order to bring Kamara’s YPC below-league average, you need to remove his 13 best runs of the season.
The next best player by this metric was Patriots RB Dion Lewis. You might be surprised that Lewis — who had a 4.98 YPC on 180 carries — would be higher than Chiefs RB Kareem Hunt, who averaged 4.88 YPC on 272 carries. All else being equal, this metric rewards players with higher averages on a larger number of carries. But that’s what made Lewis’s season so impressive: he averaged 4.98 YPC despite his longest run being just 44 yards, and his second-longest topping out at 31 yards. Hunt had runs of 69, 58, and 53 yards. Take away Lewis’s best 5 runs, and his YPC drops to 4.26; take away Hunt’s best five, and he drops below average to 4.04.
The table below shows for each RB how many of their best carries you need to take away to bring their 2017 YPC average below 4.08. [continue reading…]
It has become part of conventional wisdom, I think, to suggest that teams are using running backs as receivers more than ever before. But that continues to not be supported by the evidence. Last year, I looked at the average receiving yards gained in each season by “running backs” in the NFL. Yes, I put running backs in quotes because I didn’t actually look at running backs because, well, positional designations can be a bit tricky the farther back in NFL history you go.
But here is what I did do, and let’s use 2017 as an example. Last year, Kareem Hunt led all players in rushing yards with 1,327. That represented 2.4% of all rushing yards in the NFL last season by all players who gained at least one rushing yard. Hunt was also a good receiver, adding 455 yards through the air. So when figuring out how many receiving yards the “average running backs” gained, 2.4% of that figure will be assigned 455 yards. Todd Gurley rushed for 2.3% of all NFL rushing yards and had 788 receiving yards; therefore, 2.3% of the “average running back” will be credited with 788 receiving yards. Le’Veon Bell was at 2.3% and 655 yards. Add those three together, and 7.0% of the receiving yards by the average running back will be based on an average of 633 receiving yards.
That’s a lot, but there were also eleven running backs with 750+ rushing yards and less than 250 receiving yards: LeGarrette Blount, Latavius Murray, Jordan Howard, Marshawn Lynch, Jay Ajayi, Bilal Powell, Isaiah Crowell, Alex Collins, Dion Lewis, C.J. Anderson, and Frank Gore. In 2016, the “average running back” had 228 receiving yards; in 2017, that number jumped to… 231 receiving yards. By comparison, in 2002, it was 292 receiving yards. [continue reading…]
The NFL requires a player to record 6.25 carries per game in order to qualify for the yards per carry crown. Using that cutoff, here were the leaders in yards per carry during the 2013 season.
| Game | Game | Rush | Rush | Rush | Rush | Rush | Rush | Rush | |||||
|---|---|---|---|---|---|---|---|---|---|---|---|---|---|
| Rk | Tm | Age | Pos | G | GS | Att | Yds | TD | Lng | Y/A ▼ |
Y/G | A/G | |
| 1 | Andre Ellington | ARI | 24 | rb | 15 | 1 | 118 | 652 | 3 | 80 | 5.5 | 43.5 | 7.9 |
| 2 | Cam Newton* | CAR | 24 | QB | 16 | 16 | 111 | 585 | 6 | 56 | 5.3 | 36.6 | 6.9 |
| 3 | Donald Brown | IND | 26 | rb | 16 | 5 | 102 | 537 | 6 | 51 | 5.3 | 33.6 | 6.4 |
| 4 | DeMarco Murray* | DAL | 25 | RB | 14 | 14 | 217 | 1121 | 9 | 43 | 5.2 | 80.1 | 15.5 |
| 5 | LeSean McCoy*+ | PHI | 25 | RB | 16 | 16 | 314 | 1607 | 9 | 57 | 5.1 | 100.4 | 19.6 |
| 6 | Jamaal Charles*+ | KAN | 27 | RB | 15 | 15 | 259 | 1287 | 12 | 46 | 5.0 | 85.8 | 17.3 |
| 7 | LeGarrette Blount | NWE | 27 | rb | 16 | 7 | 153 | 772 | 7 | 47 | 5.0 | 48.3 | 9.6 |
Provided by Pro-Football-Reference.com: View Original Table
There is nothing special about a threshold of 6.25 carries/game (or 100-carries in a 16-game season). If the cut-off was lower, we could have had any of these players be the yards per carry king for the 2013 season:
| Game | Game | Rush | Rush | Rush | ||||
|---|---|---|---|---|---|---|---|---|
| Player | Year | Age | Tm | G | GS | Att | Yds | Y/A |
| Travis Benjamin | 2013 | 24 | CLE | 8 | 3 | 1 | 45 | 45.00 |
| Antone Smith | 2013 | 28 | ATL | 15 | 0 | 5 | 145 | 29.00 |
| Tavon Austin | 2013 | 23 | STL | 13 | 3 | 9 | 151 | 16.78 |
| Cordarrelle Patterson | 2013 | 22 | MIN | 16 | 6 | 12 | 158 | 13.17 |
| Michael Vick | 2013 | 33 | PHI | 7 | 6 | 36 | 306 | 8.50 |
| Terrelle Pryor | 2013 | 24 | OAK | 11 | 9 | 83 | 576 | 6.94 |
| Colin Kaepernick | 2013 | 26 | SFO | 16 | 16 | 92 | 524 | 5.70 |
| Russell Wilson | 2013 | 25 | SEA | 16 | 16 | 96 | 539 | 5.61 |
Provided by Pro-Football-Reference.com: View Original Table
Today’s post is a re-post from friend of the program Bryan Frye’s site, which is being republished with his permission and encouragement. As regular readers know, Bryan operates his own fantastic site, http://www.thegridfe.com. You can view all of Bryan’s guest posts here, and follow him on twitter @LaverneusDingle. Enjoy!
Born March 26, 1960 in San Diego, California, Marcus Allen knew from a young age he was a special talent. During neighborhood football games, he was always several steps ahead of everyone else. He preferred playing defensive back and aspired to be like his hero Lem Barney, but he also spent time in his backyard trying to emulate the running style of Browns legend Leroy Kelly. That time paid dividends when Abraham Lincoln High School coaches Vic Player and Roy Reed decided to make Allen a two-way player, starting him at quarterback. Although Allen was recruited to the University of Southern California to play safety, head coach John Robinson saw enough to Allen’s rushing ability on tape to move him to running back.
He began his college career as a backup for star tailback Charles White. He excelled in limited action, helping the Trojans win a national title as a freshman. The following year, in an effort to maximize the talent on the field, running backs coach John Jackson moved Allen to the fullback position, where he would block for White, as well as have more opportunities to carry the ball. Allen proved to be a proficient and determined blocker, helping pave the way for White to gain 1,803 rushing yards and take home the Heisman Trophy in 1979.
When Allen finally got his chance to carry the load as the team’s primary starter, he proved himself one of the best backs in the nation. He gained 1,794 yards and scored 15 touchdowns as a junior, but that was just a preview of what the talented tailback could do on the field. As a senior, in 1981, Allen put on a masterful all-around performance. He eclipsed 200 rushing yards in eight of eleven games [1]Treating post-season/bowls separately, as does the Heisman Trust. on his way to becoming the first player to run for over 2,000 yards in a single season. Combined with his contribution as a receiver, Allen led the nation with 2,559 yards [2]He added an additional 124 yards in a Rose Bowl loss to Penn State. and 23 touchdowns, earning the Heisman Trophy in the process. [3]He also took home the Maxwell Award and the Walter Camp Award.
Following a decorated career at USC, Allen was drafted tenth overall to the Los Angeles Raiders in the 1982 NFL Draft. Amidst a tumultuous season in which a players strike reduced the schedule to just nine games, the 22 year old rookie thrived. He started strong, picking up 180 yards and a touchdown in his first ever game as a pro. He built on that success and, ultimately, led the league in both yards and scoring while helping the Raiders to an NFL-best 8-1 record. Despite suffering an upset loss to the Jets in the divisional round of the playoffs, Raiders faithful knew they had found a special talent in Allen.
In his second year, he proved to be a dynamic weapon, picking up 1,604 yards on 266 carries and a career-high 68 receptions. He even completed four of seven passes for 111 yards and three scores. Those were solid numbers, but they weren’t enough to garner Allen as much as a Pro Bowl nod. It was the postseason where he built his legacy. En route to trouncing every team on the Raiders’ schedule, Allen gained 584 yards and scored five touchdowns. This included one of the great highlights in Super Bowl history against the favored Washington juggernaut. After his defense stopped John Riggins on a 4th and 1, Allen drove the final nail in the coffin with the signature run of his storied career: a sure stop for a loss that he turned into a 74 yard touchdown jaunt through the heart of the Washington faithful. He earned the Super Bowl MVP award for his efforts.
The following season, he continued to prove his versatility, gaining 758 receiving yards to complement his 1,168 rushing yards. He also led the league with 18 touchdowns. He then outdid himself just a year later. The 1985 season was Allen’s finest as a pro. He rushed for a league-high 1,759 yards and gained a then-record 2,314 yards from scrimmage. [4]A record he held until Barry Sanders gained 2,358 in 1997. His prolific production behind an unheralded offensive line earned him the Most Valuable Player award from the Associated Press and the Pro Football Writers Association. In winning MVP honors, Allen became the only player in history to win an NCAA National Championship, a Heisman Trophy, a Super Bowl, and be named Super Bowl MVP and a league MVP.
Unfortunately, the success of his MVP performance did not carry over into the following season. After topping 100 yards on the ground in the first two games, Allen suffered a nagging ankle injury that diminished his effectiveness for the rest of the year. He would not gain 100 yards on the ground again that season and, in fact, would only top the century mark in six more games in his career. Although he played in 13 games, he lacked the game-changing ability that once defined him. The low point of the season came in week 13 against the Eagles: driving to set up a game-winning field goal in overtime, Allen lost a fumble that was returned 81 yards to set up a Randall Cunningham touchdown run. Some observed this was the turning point in Allen’s career with the Raiders.
In 1987, a players strike saw one game removed from the league schedule and another three played primarily by replacement players. To the displeasure of Raiders owner Al Davis, Allen never crossed the picket line. When it ended, Allen returned from the strike to contend with Davis signing college football legend and professional baseball player Bo Jackson to play running back during the latter part of the season. Although this initially resulted in a timeshare at halfback, Allen ultimately volunteered to play fullback and use his blocking prowess to clear holes for Jackson. This allowed head coach Tom Flores to fully exploit his talented stable of backs, but it also meant significantly fewer carries for Allen. It was a sign of things to come.
Over the next three seasons, Allen would carry the burden of the team’s rushing attack for the first half of the season, knowing he would have to relinquish the role to a part-time football player for the latter part of the year. He threw key blocks for the younger back, threatened opposing defenses as a receiver, often played injured, and led his team by example in the locker room. Even after Jackson suffered a career-ending hip injury, Davis brought in veterans Roger Craig and Eric Dickerson to take the leading role. It wasn’t until 1993, when he was 33 years old, that he was able to get a fresh start and a starting job for a new team.
After being pursued by Chiefs head coach Marty Schottenheimer, Allen joined fellow veteran expat Joe Montana in Kansas City. He repaid his coach’s faith by playing five more years and scoring 47 more touchdowns, including a league-leading 12 rushing scores in his first year with the team. Although age and injury had taken their toll on Allen’s physical abilities, he maintained the mental toughness and innate ability to play football. Schottenheimer would later say: “If God put one person on this earth to be a professional football player it would have been Marcus Allen… He was the most instinctive, natural football player that I have ever been around.” [5]From A Football Life: Marcus Allen.
By the time he retired at the age of 38, he had played in more games (220) and scored more touchdowns (145) than any running back to that point in history. Some focus solely on his career arc and write him off as a compiler who only produced big numbers because he played for a long time. That is simply not the case. On account of the strike his rookie year, his first four seasons comprised just 57 regular season games. Compared with every player in history through the same number of games, Allen ranks fifth in yards from scrimmage (6942). [6]Behind Eric Dickerson, Edgerrin James, Terrell Davis, and LaDainian Tomlinson. Thanks to injuries, strikes, and Davis’s eccentricity, after those first four years, he never played another full season with a starter’s workload.
His uncanny knack for finding the end zone contributed significantly to his long career. As an elder statesman, he was used as the Chiefs’ primary goal line threat. Even when banished to Davis’s doghouse, Allen still got the nod from coaches in critical situations. Consequently, he was able to pick up 18 of his 123 rushing touchdowns during his last four seasons with the team, despite averaging fewer than eight carries per game over that span. It speaks volumes that coaches were willing to disregard ownership in order to get Allen on the field. But it wasn’t just his coaches who valued him; his teammates thought enough of him to vote him team MVP four times between 1984 and 1988, despite his reduced role as a ball carrier.
Despite missing time and feuding with the owner, Allen remained productive when on the field. He was a talented enough receiver that draft analysts thought he might be switched to wide receiver coming out of college. They were on to something. At the time he retired, Allen ranked 22nd among all players, and first among running backs, with 587 career receptions. He was also the first player ever to rush for over 10,000 yards and gain over 5,000 yards receiving in a career. Twenty years later, only Marshall Faulk and Tiki Barber have joined that club. [7]Only Faulk has more of both.
Allen played a full season’s worth of playoff games. In those 16 games, he had 267 carries for 1,347 yards (5.0 YPC) and 11 touchdowns. He added 53 receptions for 530 yards and two touchdowns. A season of 1,877 yards and 13 touchdowns is even more impressive when you consider that nine of those games came after Allen turned 30.
He also used his quarterback pedigree to benefit his teams in the NFL. Over the course of his career, he completed 12 of 27 passes for 282 yards and six touchdowns. These weren’t typical goal line gadget plays you’d expect to see from a running back; they were largely plays with the same degree of difficulty you’d assign to a quarterback.
That kind of versatility earned him admiration from coaches across the league. In a 1985 article, the Los Angeles Times asked several NFL coaches to rate contemporary running backs. Despite a presumed lack of speed leaving him ranked as the ninth-best pure runner, the panel thought enough of the rest of his game to rank him (tied with Walter Payton) as the best all-around running back.
We’ve established that Allen was a natural runner, punishing blocker, talented receiver, and, when called upon, a decent passer. As important to his legacy as his prodigious on-field accomplishments, however, may be his strength of character.
Davis valued loyalty and reportedly considered Allen’s refusal to cross sides during the strike, as well as his frequent holdouts, as personal betrayals. As an act of retribution, Allen believed, Davis refused to release or trade him, instead preferring to let him sacrifice his body as a 205 pound blocking back. It was rumored that Davis instructed the coaching staff not to play him and even went as far as warning quarterback Jay Schroeder not to look to him on pass plays. Despite knowingly fighting an uphill battle, the star running back didn’t create tension in the locker room and, in fact, was universally respected by his peers.
Even after filing an antitrust suit against the NFL (helping pave the way for unrestricted free agency) and publicly lamenting that Davis robbed him of his prime, his teammates honored him with his fifth Commitment to Excellence Award. He was a steadfastly unselfish teammate, even at the expense of his own legacy, and the guys in the locker room recognized both his resilience and his leadership. To paraphrase Allen: You can’t pretend to be tough; either you are or you aren’t. Both mentally and physically, Marcus Allen was tough. He is also one of the all-time greats.
References
| ↑1 | Treating post-season/bowls separately, as does the Heisman Trust. |
|---|---|
| ↑2 | He added an additional 124 yards in a Rose Bowl loss to Penn State. |
| ↑3 | He also took home the Maxwell Award and the Walter Camp Award. |
| ↑4 | A record he held until Barry Sanders gained 2,358 in 1997. |
| ↑5 | From A Football Life: Marcus Allen. |
| ↑6 | Behind Eric Dickerson, Edgerrin James, Terrell Davis, and LaDainian Tomlinson. |
| ↑7 | Only Faulk has more of both. |
The 2017 Cleveland Browns went 0-16, a season the franchise would like to forget. The team’s best offensive player was running back Isaiah Crowell, who shouldered a very large percentage of the team’s rushing workload – at least among running backs. Quarterback DeShone Kizer finished second on the team in rushing yards, while backup running back Duke Johnson was the team’s leader in targets, receptions, and receiving yards — and it wasn’t particularly close.
One thing that was notable about Crowell’s season: among Browns running backs, Crowell was the leader in rushing yards in all 16 games. Four other teams had one player lead the team’s running backs in rushing in 15 of 16 games: the Rams with Todd Gurley, the Steelers with Le’Veon Bell, the Chiefs with Kareem Hunt, and the Colts with Frank Gore. Los Angeles, Pittsburgh, and Kansas City all made the players and rested starters in week 17; Gurley, Bell, and Hunt led their teams in rushing in each of the first 15 team games of the season. As for Indianapolis, Gore led the team in rushing each week with one notable exception: against the 49ers, Marlon Mack rushed 9 times for 91 yards, while Gore had 14 carries for only 48 yards against his former team. Save that for the revenge game narrative.
We talk a lot about how running back by committee is retaking the league after the stud running back era of the mid-’00s. Last year, for 15 of the league’s 32 teams, one running back led the team in rushing in 75% of their team’s games. I’m not quite sure whether this is the best or even the right way to measure RBBC, but I do think it’s a useful balancing act against other, typical measures.
The table below shows, for each team, how many games one RB led all team running backs in rushing: [continue reading…]