≡ Menu

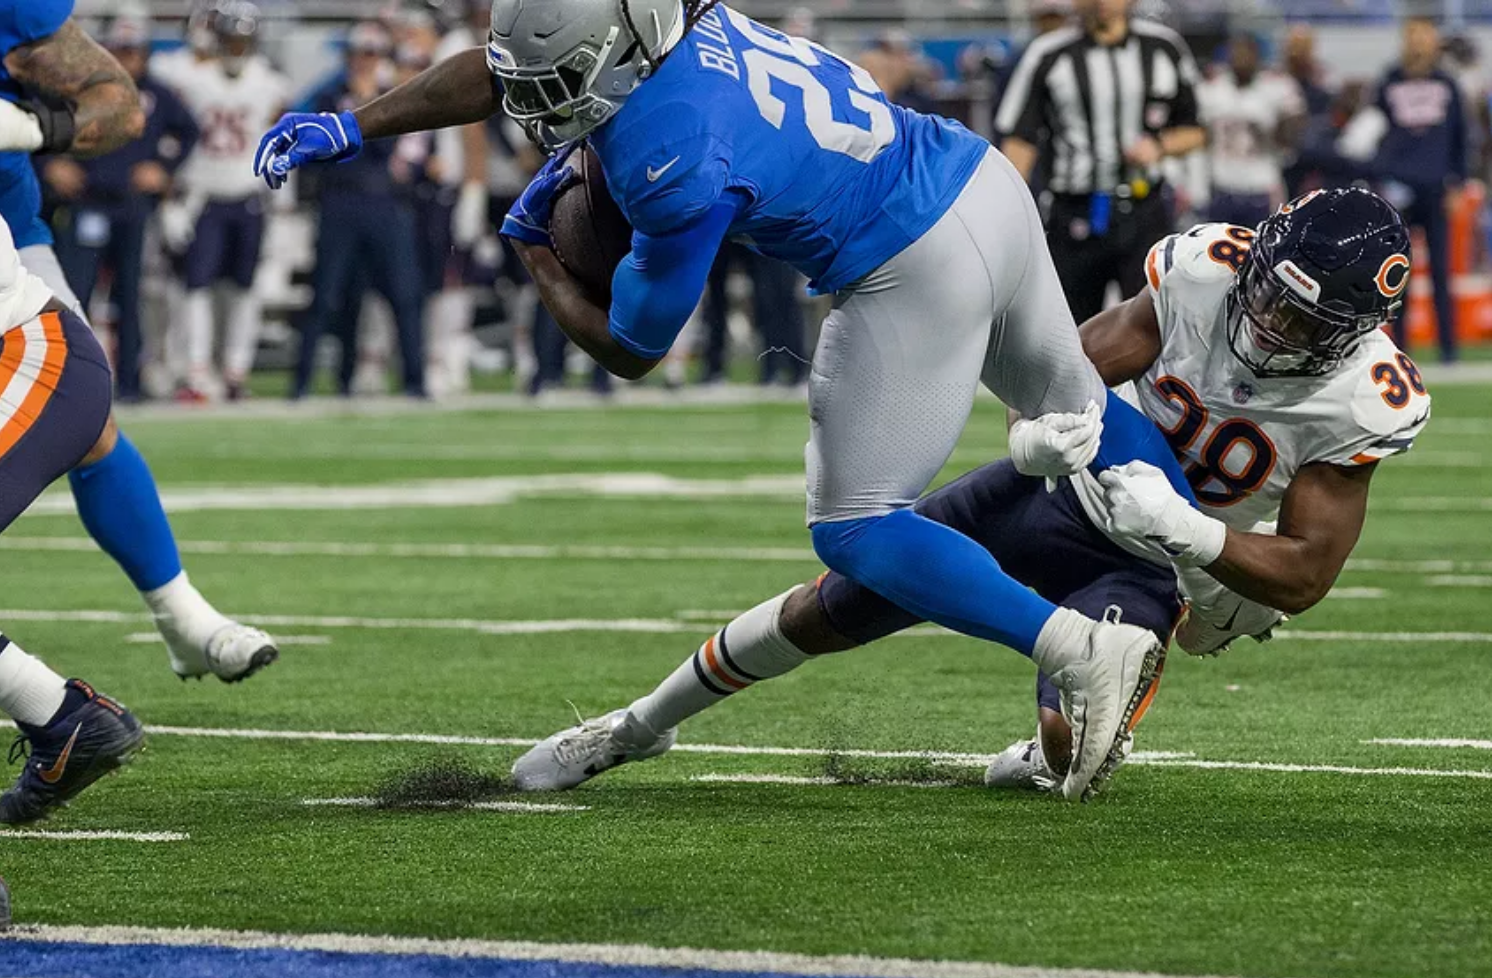
It’s the game’s first play from scrimmage. Your team has the ball, on 1st-and-10, at its own 30-yard line. The quarterback hands it to the running back, who begins running forward.

He avoids a tackle in the backfield, preventing a 1-yard loss. He then runs from the 29 to the 30 to the 31 to the 32…. and so on, until getting tackled at the 45 yard line. He gets high-fives from his teammates as he jogs back to the huddle.

Now, let’s look at you the coach. Which one-yard incremental gain out of those 15 yards made you the happiest? The least-happy? Let’s assume that you are all-knowing, and therefore know the value of each yard gained at all points during a game. If we had a happiness monitor on you, where would it spike? Did the 1-yard gain from the 29 to the 30 make you happy (ignoring for these purposes, the fact that you couldn’t gain the other yards if you didn’t gain the first ones)? Was it the 1-yard gain from the 33 to the 34, putting you in 2nd-and-6? The 1-yard gain from the 39 to the 40, guaranteeing a new set of downs? The 1-yard gain from the 44 to the 45, bringing you ever closer to the end zone?

What about the least happy: that is, which 1-yard gain did almost nothing for you? As it turns out, there’s an answer to that question. And it may surprise you.

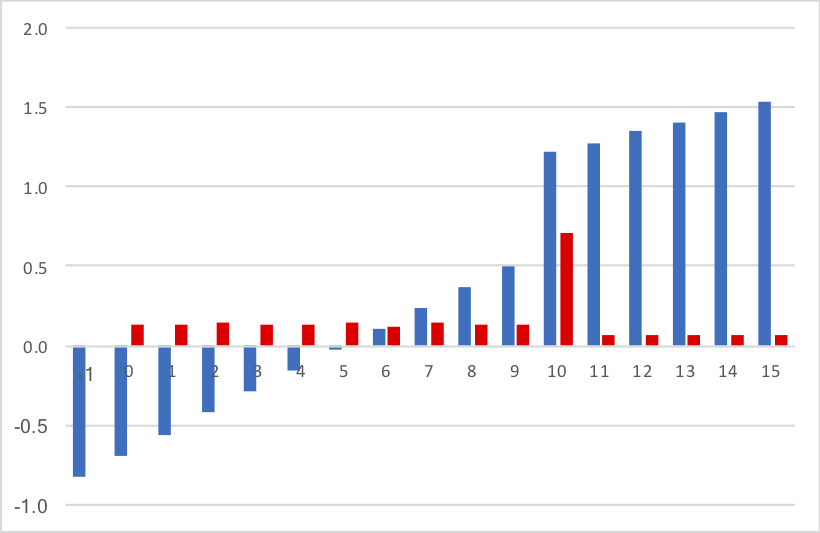
Using the Expected Points Added feature in PFR’s play-by-play log, we can measure how many expected points were added as each yard was gained.  That is shown that in blue columns in the graph below. For example, a 1-yard gain is worth -0.4 expected points, because gaining just one yard on 1st down is a bad thing; it sets a team back.  Gaining exactly 4 yards is worth 0.0 expected points: it doesn’t change how you think this drive will end. Gaining 12 years is worth nearly 0.8 additional expected points, and gaining 15 yards is worth nearly one full point of EPA.  That’s what the blue columns show.

The red columns? They show the marginal expected points added of each additional yard gained.  There are three takeaways from looking at the marginal value of each yard: (1) each yard is worth about +0.14 EP up until yard 10; (2) the 10th yard provides zero (or even negative!) value, and (3) all yards after 10 are about half as valuable as the yards gained before 10 yards (about +0.07 EP). Take a look:

This is a bit counter-intuitive.  Don’t feel bad if you thought that the 10th yard was the most valuable yard, since that is the yard that moves the chains.  But history shows us that it’s better for an offense to have 2nd-and-1 at the 39 than 1st-and-10 at the 40, since 2nd-and-1 is such an advantageous situation for the offense.

Pretty interesting, I think.

Now, let’s do the same exact exercise but for 2nd-and-10. Once again, each additional yard is worth about 0.14 EP in the beginning, but then we have an enormous jump when it comes to that 10th yard.  Gaining 9 yards on 2nd-and-10 is worth 0.50 EPA, but gaining 10 yards is worth 1.21 EPA!  That means there are 0.71 EPA assigned to that 10th yard, making it by far the most valuable. And then, once again, the value of each yard gained after picking up a first down drops in half to about 0.07 EPA.  The total EPA from each gain is shown in blue, while the red column shows the marginal value of each yard gained.

[continue reading…]

{ 1 comment }

How Sticky Is Yards per Carry From Year To Year?

In 2015, Thomas Rawls averaged 5.65 yards per carry, best in the NFL. The next year, Rawls averaged just 3.20 YPC, the second-worst rate in the league. That’s an extreme case (actually, the most extreme case), but it does represent the general idea that yards per carry is simply not very sticky from year to year.

In the graph below, I have shown all running backs who had at least 100 carries in back to back years since 1970. The X-Axis shows the YPC each player had in Year N, and the Y-Axis shows the YPC that player had the following year, Year N+1. The R^2 shows the correlation between those two numbers. The best-fit formula to predict Year N+1 Yards per Carry from Year N Yards per Carry is 3.05 + 0.28 * Year N YPC. The R^2, of course, is the square of that 0.28 coefficient. Take a look at this graph:

What if we raise the minimums to 150 carries both years? [continue reading…]

{ 0 comments }

Blount getting tackled, per usual

On Wednesday, I looked at all running backs with at least 100 carries. Then, for those running backs who averaged over 4.41 yards per carry (the average YPC for that group), I asked the question: how many of the best rushes would you need to discard for each running back to have an average (or worse) YPC average?

The answer was not many. For Todd Gurley and Gus Edwards, who led the league in this metric, the answer was just 6 runs. Taking away Gurley’s 6 best carries dropped his YPC average to 4.34; taking away his 5 best would have dropped his YPC to “only” 4.43, so you need to take away his best 6 carries to get him to average or below.

But what about the reverse? If we look at all running backs with at least 100 carries who averaged fewer than 4.41 yards per carry, how many of their worst rushes would you need to discard to get that running back to average or better?

The leader in this category is LeGarrette Blount, and it wasn’t particularly close. In 2018, the Lions running back rushed 154 times for just 418 yards, an abysmal 2.71 YPC average. [continue reading…]

{ 0 comments }

You can hear me on the Bill Barnwell podcast today discussing the Jets, Le’Veon Bell, and the running back posts I’ve done this week.

Listen here

Or on iTunes

My segment begins at 30:39

{ 0 comments }

Aaron Jones led the NFL (much to my dismay) in yards per carry in 2018, averaging 5.48 yards per carry courtesy of 729 yards on 133 carries. But there are many problems with focusing too much on a simple metric like yards per carry, which doesn’t tell you very much.

Every year, I like to conduct a study on all running backs who had above average YPC averages and then figure out how many carries we would need to remove to drop his YPC to below average. Why do I like to do this? Because it’s the offseason, and why not! But also because it helps to highlight and remind us how sensitive YPC is to outlier runs.

When I looked at the top running backs in the NFL last year, as a group, they rushed 8,153 times for 35,989 yards, a 4.41 YPC average. So for all running backs who had an above-average YPC number last year, how many carries would we have to remove to get them below 4.41?

Jones had a 67-yard run last year; take that away, and his YPC drops to 5.02. Remove his next 3 best runs — 33, 30, and 29 yards — and his YPC drops to 4.42. You need to take away his 5th best carry, an 18-yard rush, to drop his YPC to 4.31. So for Jones, the answer is 5 carries is how many you need to take away to get his YPC to below the threshold.

You might think, hey, this is biased against running backs with a low number of carries! Well, that’s the point! We should be skeptical of placing too much emphasis on a player’s YPC average if that running back doesn’t have a lot of carries. The “leader” in this statistic is actually a two-way tie between Todd Gurley and Gus Edwards. For Gurley, you need to take away his top 6 runs — which were only 36, 29, 26, 24, 24, and 23 yards — to get his YPC down to 4.36. This serves as a good way of noting that Gurley actually had a “down” year when it comes to YPC: he was only a couple of long runs away from an even more dominant season. Edwards had only 127 carries, but he also didn’t have many big runs: even if you take away his best 5 runs, his YPC would drop to 4.45; you need to remove his 6th best carry to get him to 4.34.

The graph below shows the results for each player who had an above-average YPC last year. The first four columns should be self-explanatory. The “TakeAway” column shows how many carries you need to take away to get that player’s YPC to below 4.41. Note that for Barkley, McCaffrey, and Chubb — despite each topping 5.0 YPC — that answer is only 3! And for Chubb and Barkley, removing their best 5 runs brings both players to a sub-4.00 YPC average. The next 10 columns show the 10 longest runs that player had. Then, the final 10 columns show that player’s YPC average once you remove each of his best X carries. [continue reading…]

{ 0 comments }

Rob Gronkowski Was An Outlier In Yards per Reception

Rob Gronkowski has retired from football, at the age of 29. At his peak, Gronk was the most dominant tight end of all time. He excelled at so many things and in so many ways: a remarkable red zone scorer, a tremendous blocker, a clutch receiver, and a consistent producer. From 2011 to 2017, Rob Gronkowski averaged 67.5 yards per game in all seven seasons; all other tight ends in the NFL combined to do that…. 7 times (Jimmy Graham twice, Travis Kelce twice, and Delanie Walker, Jordan Reed, and Greg Olsen once each).

But one of Gronk’s statistics that most interests me is his remarkable yards per catch, particularly given his size. The graph below shows the 300 players with the most receiving yards in pro football history. The X-Axis shows player weight; the Y-Axis shows yards per catch. This graph includes running backs, wide receivers, and tight ends, so lots of running backs are at the bottom of the graph. But what sticks out — as you would suspect — is how bare the upper right portion chart appears. In other words, players who weigh a lot typically don’t have high YPC averages. [continue reading…]

{ 2 comments }

Running Back Heat Maps – 2018 Season

Regular readers are familiar with my running back heat maps, but let’s use Ezekiel Elliott and Saquon Barkley as examples.

Last season, Elliott and Barkley finished first and second in rushing yards and rushing attempts. Elliott averaged a very strong 4.73 yards per carry, but Barkley had a sparkling 5.01 YPC average. However, there is more than meets the eye.

Elliott rushed for positive yards on 83% of his carries; that’s pretty good, because the average among all running backs with at least 100 carries was 81%. Meanwhile, Barkley rushed for positive yards on only 77% of his carries. Elliott rushed for at least 2 yards on 71% of his carries; Barkley did it on just 61% of his carries. Gaining at least 3 yards? Elliott did that 55% of the time, while Barkley did it just 48% of the time. This trend holds true for awhile: Elliott picked up at least 4, 5, and 6 yards on 45%, 35%, and 29% of his carries; for Barkley, those rates were 38%, 30%, and 25%, respectively.

At least 7 yards? Elliott did that on 24% of his carries, while Barkley only rushed for 7+ yards 18% of the time. It gets a little closer at 8 and 9 yards, but Elliott still wins, 18% to 16% and 16% to 15%.

How about at least 10 yards? The Cowboys star gained 10 or more yards on 13% of his rushes; Barkley did it on 12% of his carries. How about 15+ yards? Elliott hit that mark on 8.2% of his carries, while the Giants start did it on 7.7% of his rushes. So how in the world did Barkley finish the season with a higher yards per carry average? Because Elliott rushed for 20+ yards on just 4% of his carries, while Barkley did it on 6% of his carries. More importantly, Elliott’s longest run was 41 yards, while Barkley had runs of 46, 50, 51, 52, 68, 68, and 78. That’s how, despite Elliott pretty much “winning” at each distance, he lost the YPC battle. Even if Elliott had big runs more often, Barkley’s big runs were really big runs. [continue reading…]

{ 0 comments }

Yesterday, I looked at the way each team’s roster was concentrated in terms of salary cap dollars.  A few teams, like the Giants, Lions, and Vikings, were notable for allocating a significant portion of their 2019 salary cap dollars to their top players.  Meanwhile, the Jets, Bills, and Browns were on the other end of that spectrum.

Of course, the Jets, Bills, and Browns all drafted quarterbacks in the first round of the 2019 Draft, while the Giants, Lions, and Vikings are all paying big dollars to veteran quarterbacks. How would the data look if we excluded the top (by salary cap dollars) quarterback on each team?

I re-ran those numbers today.  Once again, we will be using the Concentration Index, described here, to “grade” each team’s roster construction. To summarize, we do the following steps:

1) Calculate the 2019 salary cap hit of the top 51 players on each team’s roster. Thanks to Over The Cap, I was able to collect this information.  Eliminate the highest paid QB on each team’s roster.

2) For each player on each team, calculate the percentage of team salary cap dollars spent on that player. For example, Denver’s Von Miller has a 2019 cap hit of $25.1M, and the Broncos top 50 players (excluding QB Joe Flacco) have a cap hit of $142M. Therefore, Miller is taking up 17.7% of Denver’s non-Flacco 2019 cap spend.

3) Square the result for each player (so Miller’s 17.7% becomes 3.1%), and then sum those results for each player on each team to get team grades.

By squaring the results, you give more weight to players taking up a larger percentage of their team’s pie.   The graph below shows each team.  The X-Axis shows the 2019 Salary Cap dollars each team spent on their 50 highest paid players, excluding their top quarterback.  The Y-Axis is the concentration index result.  The Broncos are at the top of the chart, thanks in large part due to Miller.  Ignoring Flacco, Denver’s top 6 players (Miller, Emmanuel Sanders, Derek Wolfe, Ronald Leary, Chris Harris, Jr., and newly-added Ja’Wuan James) are being paid $75M 2019 cap dollars, while the Broncos bottom 37 players (in their top 51) are being paid just $35.3M. That’s an extreme “studs and duds” approach that becomes even more clear once you remove all top-paid quarterbacks. [continue reading…]

{ 1 comment }

2019 Salary Cap Info and Concentration Index

The New York Giants have a very top-heavy salary cap structure. The team’s top five 2019 salary cap hits belong to Eli Manning, Nate Solder, Janoris Jenkins, Alec Ogletree, and Kevin Zeitler, and total a whopping $76.7 million. Meanwhile, the Giants players with the 6th through 51st largest cap hits total just $71.5 million. That’s absurdly top-heavy (and comes after moving on from Damon Harrison, Olivier Vernon and Odell Beckham over the last few months). The Giants organization has really embraced a “star and duds” approach.

Consider the Buffalo Bills, whose top-5 largest 2019 cap hits belong to Star Lotulelei, Mitch Morse, Jerry Hughes, LeSean McCoy, and Trent Murphy and total $50.6M. The rest of the top 51 salary cap hits on the roster total $107.5M. The Bills do not have a single player with a 2019 salary cap hit of $11.8M or greater; meanwhile, every other team in the NFL has at least two such players.

The Giants and Bills are at the extreme ends of salary cap/roster construction. One way to measure how concentrated (or not concentrated) a team’s salary cap is by using the Concentration Index, described here. In short, we do the following steps:

1) Calculate the 2019 salary cap hit of the top 51 players on each team’s roster. Thanks to Over The Cap, I was able to collect this information.

2) For each player on each team, calculate the percentage of team salary cap dollars spent on that player. For example, Kirk Cousins of the Vikings has a 2019 cap hit of $29M, and the Vikings top 51 players have a cap hit of $184M. Therefore, Cousins is taking up 15.8% of Minnesota’s 2019 cap spend.

3) Square the result for each player (so Cousins’s 15.8% becomes 2.5%), and then sum those results for each player on each team to get team grades.

By squaring the results, you give more weight to players taking up a larger percentage of their team’s pie. Matthew Stafford ($29.5M cap charge) has both the highest 2019 Cap charge in the league and since the Lions top 51 players only have cap hits totaling $160M, has the highest percentage of team cap charge at 18.4%. When you square that result, you get 3.4%. Meanwhile, for Buffalo, Lotulelei’s $11.5M charge represents 7.3% of Buffalo’s top 51 largest cap hits, and then drops to just 0.5% when you square the result.

When you sum those squared results for each team, the Giants stand out as the team with the largest concentration of salary cap dollars in the fewest players, at 7.0%. Meanwhile, the Bills have dispersed their salary cap dollars in the widest manner, at just 3.7%.

Another interesting team is Cleveland. The Browns are similar to Buffalo, and have spread their salary cap dollars around: their concentration index is just 4.2%, the second lowest in the league. But Cleveland also has spent the most 2019 salary cap dollars on its top 51 players, at a whopping $192M! Think about what that means: the Browns are paying a ton of money to their players in the aggregate, but spreading it around a lot. That must mean that Cleveland is paying a lot of people good money, and well, that’s exactly what’s happening. The Browns are paying 14 players at least $6.6M in 2019 cap dollars. No other team has more than 11 such players.

The graph below shows the results of today’s post. The X-Axis shows the 2019 salary cap dollars each team has spent on its top 51 players (no dead money is included). The Y-Axis shows the concentration index for each team for these 51 players. As you can see, the Giants (highly concentrated) are at the top of the chart, the Bills are at the bottom, the Browns are at the far right (lots of $$ spent), and the Dolphins (little $$ spent) are at the far left.

[continue reading…]

{ 0 comments }

In 2018, there were over 80 games where a running back had at least 20 carries in the game. How would you expect those carries to be distributed?

I don’t think you would expect him to have 10 carries in each half, or 5 carries in each quarter, or to average 1 carry every 3 minutes. I would expect a number of those carries to be at the end of the game, because these are games the team usually won (I also eliminated all games that went to overtime, to limit the sample to just 60 minutes of regulation) and running backs tend to get carries late in games when they are ahead.

That…. isn’t quite the case. Below are the average number of carries by these running backs over every minute of the game. It’s true that these running backs with 20+ carries in the game are often getting carries in minute 56, 57, 58, and 59, but not to an extreme level (also interesting although not surprising: there are very few carries in the final minute of the game; that’s because teams typically kneel in this situation). [continue reading…]

{ 0 comments }

About 12 years ago, Doug and I wrote about where the league leaders in attempts ranked in yards, and vice versa. I only remember one thing about that post, and it’s about Jon Kitna. You probably don’t spend much time thinking about Jon Kitna these days, but here’s one of the quirkiest stats in NFL history.

In 2001, Jon Kitna led the NFL in pass attempts, but ranked 16th in passing yards.

That’s really, really hard to do. He averaged just 5.5 yards per pass attempt, among the worst performances by any passer in the last two decades.

Cincinnati actually had a remarkable set of weapons: Darnay Scott was 29, Corey Dillon was 27, Peter Warrick was 24, T.J. Houshmandzadeh was 24, and Chad Johnson was 23.  Johnson and Houshmandzadeh were rookies, though, and far away from becoming the players they would become, while Scott was at the tail end of a good career. The Bengals even had a pair of strong blockers in FB Lorenzo Neal and TE Tony McGee.  The offensive coordinator was Bob Bratkowski – who was in his first year in Cincinnati, but would remain until 2010 – while the head coach was Dick LeBeau. The next season, Kitna averaged 6.7 yards per pass attempt: he threw for nearly the same amount of yards, but on 108 fewer attempts.

But his 2001 season is a performance that is unlikely to ever be matched. The graph below shows where the league leader in pass attempts in each season ranked in passing yards. It should be pretty easy to understand, and even easier to find Kitna. [continue reading…]

{ 0 comments }

Quarterback Records Against The Belichick Patriots

Including the postseason, Bill Belichick is 255-89 as head coach of the New England Patriots. That’s really good! Said differently, quarterbacks facing New England since 2000 have a 0.258 winning percentage, which is really bad.

Which quarterbacks have fared the best and the worst against Belichick? Let’s start with some trivia: can you name the quarterback who has gone 3-0 against Belichick’s Patriots?

Click 'Show' for Answer Show

In addition, only one quarterback has gone 2-0 against Belichick. Can you name him?

Click 'Show' for Answer Show

Below is the record for every quarterback against Belichick. The final column shows the record of all quarterbacks against Belichick *without that quarterback included*. That is the column by which the table is sorted. [continue reading…]

{ 0 comments }

Last year, Penn State tight end (and now Miami Dolphin) Mike Gesicki had the best vertical jump at the Combine. In general, the vertical jump favors lighter players and taller players: it’s easier to produce a big vertical jump if you have long legs and are carrying less mass.

The best-fit formula to estimate a player’s vertical jump at the 2019 Combine would be predicted using the following formula:

Projected VJ = 36.85 + 0.173 * height (inches) – 0.0667 * weight (pounds)

Using that formula, Virginia safety Juan Thornhill produced the top vertical jump at the 2019 Combine. Standing six feet even and weighing 205 pounds, we would expect such a player to have a 35.6″ vertical. Thornhill, meanwhile, had a remarkable 44″ vertical jump. [continue reading…]

{ 0 comments }

Did you know that Dan Marino and Bob Griese have accounted for over 45% of all pass attempts, over 48% of all passing yards, and over 53% of all passing touchdowns in Miami Dolphins history? The Dolphins are the rare franchise that has just four players with more than 40 touchdown passes: Marino (420), Griese (192), Ryan Tannehill (123), and Jay Fiedler (66). But perhaps here is the most startling stat: Ryan Tannehill has the best passer rating in Dolphins history!

Yes, Tannehill — he of the back-to-back-to-back-to-back-to-back-to-back breakout seasons — has a better passer rating than both Marino and Griese, although of course that’s not true when you adjust for era. Marino ended his career with an 86.4 passer rating, and a 76.9 passer rating when adjusted for era. Griese had a 77.1 actual passer rating, and a 79.0 passer rating when adjusted for era (Griese also took a ton of sacks, while Marino took very few, which is the only reason Greise’s era-adjusted rating comes in ahead of Marino’s). Tannehill, through 2017, had a 65.1 era-adjusted passer rating, and in 2018, had a 66.4 EA PR, but his career un-adjusted passer rating is 87.0.

So while we know passer rating is silly to use when not adjusting for era, as a matter of trivia, it’s pretty interesting to see Tannehill ahead of Marino. But ANY/A — which includes sacks — is a better way to measure passing efficiency. And so today, I thought it might be interesting to look at the history of the Miami Dolphins passing offense and passing defenses, based on trailing 16 game averages.

That’s shown in this graph below. The orange line shows the trailing 16-game Adjusted Net Yards per Attempt average of the Dolphins offense going back to 1966. You can see the Marino-induced spike in ’84 and ’85, as more games from his historic 1984 season is captured by the trailing average. The aqua line shows the trailing 16-game ANY/A allowed by the Dolphins defense: the valleys shown in ’73/’74 and early 1983 are good representations of the Super Bowl defenses that carried the Dolphins in 1972, 1973, and 1982 (of course, the ’72 and ’73 offenses were good, too). [continue reading…]

{ 1 comment }

Last year, Georgia running back Nick Chubb was the leader in the bench press. This year, Kansas State running back Alex Barnes — who led the Big 12 in rushing — was your top muscle man. The bench press is an exercise that measures upper body strength, but it is biased in favor of heavier players and shorter players.

The best-fit formula to project bench press reps for the 2019 Combine was:

Expected BP reps = 45.00 -0.7513 * Height (Inches) + 0.1240 * Weight (Pounds)

For example, here are the projected reps for a player at the 2019 Combine with each of the following heights (in inches) and weights (in pounds):

[continue reading…]

{ 1 comment }

Tannehill is expected to break out of this pocket.

The next Ryan Tannehill breakout season will be coming in Tennessee, after the Dolphins traded Tannehill and a 2019 6th round pick to the Titans for Tennessee’s 2020 4th round pick and 2019 7th round pick.

Okay, snark aside, the Tannehill breakout season never actually happened, despite the predictions of sports journalists everywhere. After a nondescript rookie season in 2012, the breakout didn’t happen in his sophomore season in 2013. That prompted me to ask the question: How long does it take great quarterbacks to break out?

Tannehill began his career with two consecutive seasons of below-average ANY/A, and while some excused his poor numbers due to bad coaching and offensive line play, I wrote that if “Tannehill turns into a star quarterback, he’ll be a very unique case.” That line remains true.

Many expected him to break out in his third year in 2014, but that didn’t happen, either. At that point, I wondered whether Tannehill was ever going to break out, and noted that if a quarterback begins his career with three straight years of below-average play, that’s probably bad sign.

Then, prior to his fourth season in 2015, Jon Gruden said the breakout season was coming, and so did… Tannehill himself. It did not happen, and blame wound up being placed on the head coach.

After four seasons, I asked the satirical question: Where Does Ryan Tannehill rank in the Pantheon of Great QBs? At the time, there had been 88 quarterbacks since 1970 who had taken at least 90% of the same team’s pass attempts in every year in any four-year window. Of those passers, Tannehill had the second worst passing stats of any quarterback and was one of just three that failed to start a single playoff game. So, clearly, Tannehill had to be great to be getting all of these snaps despite both a below-average record and below-average statistics. [continue reading…]

{ 2 comments }

The Blake Bortles Era Took Too Long To End

A sad sight for Jaguars fans.

The Jaguars signed Nick Foles and released Blake Bortles this week, finally ending the very long and very underwhelming Blake Bortles era. Since being selected with the 3rd overall pick in the 2014 Draft, Bortles has thrown 2,632 passes, 9th most in the NFL.

During that time, he leads all players in interceptions (75), picks six (13), losses (49), ranks second in fumbles (46), ranks third in sacks taken (195), and ranks 12th in passing yards, 13th in pass completions, and 15th in passing touchdowns.

So how did Bortles last so long? If you squint, you can see how Bortles lasted five years, mostly by never putting together back-to-back clearly bad seasons.

As a rookie in 2014, Bortles finished dead last in ANY/A and went 3-10. It was an awful season, but not necessarily out of line with what you would expect from a rookie quarterback joining a bad team. [continue reading…]

{ 0 comments }

Reid finally signed a small deal with Carolina in 2018.

Landon Collins just smashed whatever ceiling we thought existed on the safety market: the new Redskins defensive back signed a 6-year, $84M contract with $26M fully guaranteed, that will give him $45M over the next 3 seasons. His signing in Washington is part of a much larger trend, notable in light of the controversy surrounding the safety market a year ago.

In 2018, Earl Thomas got into a nasty dispute with Seahawks management over a new contract. Seattle would not relent, and Thomas eventually returned and played a final year with $8.5 million remaining on his contract. Thomas played just four games in 2018 due to a broken leg, but that didn’t prevent the Ravens from giving him a new 4-year contract worth $55M, with $32M guaranteed.

In 2018, Eric Reid’s shadow loomed over the safety market: he went unsigned all summer, presumed at least in part due to the controversy surrounding his kneeling during the national anthem and the related grievance against the league that the NFLPA filed on his behalf. He eventually signed a 1-year deal worth less than $2M with the Panthers, but this week, he re-signed with Carolina on a 3-year, $22M deal (that, at a minimum, will be a 1-year, $9M deal).

Tyrann Mathieu was frustrated last summer, too, in the midst of a brutal market for safeties. He wound up signing a 1-year deal with Houston for $7M. This offseason? Mathieu just inked a 3 year, $42,000,000 deal with Kansas City.

In 2018, Kurt Coleman signed with the Saints after being released by Carolina. He signed a 3-year, $16.35M deal, but has already been released; that contract ended up being a 1-year, $6.3M deal. The other most “notable” signing was Morgan Burnett with the Steelers, to a three year, $14.35 million contract. Otherwise, safeties didn’t sign any notable contracts a year ago, in stark contrast to 2019.

Kenny Vaccaro was a high profile free agent last year, but he was limited to a 1-year, $1.1M deal with the Titans in 2018. Tennessee just resigned him, though, now to a 4-year, $26M deal with $12M guaranteed. That’s a pretty nice upgrade. [continue reading…]

{ 0 comments }

This is a picture of one Hall of Fame player.

The Giants really did it: New York traded Odell Beckham to the Cleveland Browns for the 17th and 95th picks in the 2019 Draft, along with safety Jabrill Peppers. On the surface, this is an insane decision by the Giants front office. Dig a little deeper, as Bill Barnwell did, and your suspicions are confirmed.

A future Hall of Fame wide receiver — which is the trajectory Beckham is on — who is just 26 years old is an invaluable asset. Consider that Don Hutson, Marvin Harrison, Steve Largent, Michael Irvin, Raymond Berry, John Stallworth, Fred Biletnikoff, Lynn Swann, Calvin Johnson, Reggie Wayne, and a host of other great receivers (include a still active Larry Fitzgerald) played their whole careers for one team. Their teams saw an elite talent and never let them go. I expect Julio Jones to join this group or the next one.

Some all-time greats eventually moved on to other teams at the tail ends of their careers, like Jerry Rice, Tim Brown, Art Monk, Andre Reed, Isaac Bruce, Steve Smith, Harold Carmichael, Stanley Morgan, Andre Johnson, Torry Holt, Chad Johnson, Henry Ellard, Bob Hayes, etc. It’s not unusual for teams to part ways when they think their superstar receiver is outside of his prime years.

Even in cases where some all-time greats left earlier, it still wasn’t that early. Lance Alworth, James Lofton, Terrell Owens, Tommy McDonald, Harlon Hill, Gary Clark, and yes, even Antonio Brown, played all of their 20s with one team. [continue reading…]

{ 0 comments }

Last year, I wrote about the shrinking middle class of quarterbacks in the NFL. After the 2019 NFL Draft, things looked even more polarizing: with four QBs being selected in the top 10, and a fifth joining a “franchise QB” in Baltimore, there was a very small middle class of quarterbacks in the NFL, at least based on salary cap dollars.

That leaves just four teams with non-franchise, non-rookie QBs: the Dolphins with Tannehill, the Broncos with Keenum, the Jaguars with Bortles, and the Bengals with Dalton.

As you know, none of those teams were successful last year, and three of them have gone in a different (albeit similarly unexciting) direction at quarterback. Miami is going to release Ryan Tannehill, and the Broncos and Jaguars swapped out expensive veteran quarterbacks who aren’t franchise quarterbacks in Case Keenum and Blake Bortles for… expensive veteran quarterbacks who aren’t franchise quarterbacks (but have won a Super Bowl!) in Joe Flacco and Nick Foles.

In addition to those four teams, there are three other teams in quarterback purgatory. One is Washington, who lost Alex Smith due to injury (and are paying borderline franchise quarterback dollars to him this year, to the tune of a $20.4M cap hit) and replaced him with Keenum, who at least has an extremely modest base salary in 2019. Of course, going cheap at quarterback with a below-average passer is hardly a strategy teams look to employ, especially when it comes with spending an extra $20M on an injured quarterback. The other two teams found themselves in no man’s land thanks to inconsistent play from the first two picks in the 2015 NFL Draft. Tampa Bay and Tennessee both used the fifth year option to extend the contracts of Jameis Winston and Marcus Mariota, but that leaves them with cap hits in excess of $20M for 2019 despite neither player being a top-10 quarterback. That leaves the Titans and Bucs in a similar space — in terms of both salary cap dollars and quarterback production — to teams like the Bengals, Broncos, and Jaguars.

So, to recap: (i) two teams (Miami and Washington) are lost at quarterback and probably deserve an incomplete grade at this time: both are prime candidates to use a high draft pick on a quarterback in the 2019 Draft, and (ii) five teams (CIN/JAC/DEN/TEN/TB) are stuck paying between $16 and $22M to quarterbacks that are among the least desirable starting quarterbacks in the league.

11 teams, meanwhile, are rolling with quarterbacks on rookie deals, including all 5 from the 1st round of the 2018 Draft (CLE/NYJ/BUF/ARI/BAL), with the possible chance that Arizona may in fact replace last year’s 1st round QB with a new 1st round QB. The other 6 teams? 3 took QBs in the 1st round of 2017 (CHI/KC/HOU) and all are very happy about that: those three teams have a 2-year window with those rookies on cheap deals. The other 3 took QBs in the 2016 Draft: two with the first two picks (LA/PHI), and one (DAL) with a late round pick. The Cowboys are likely to give Dak Prescott a big contract before the start of the ’19 season, as Dallas doesn’t have the fifth year option at its disposal since Prescott wasn’t a first round pick. Prescott’s contract is up after this season (Dallas can of course use the franchise tag on him), while the Eagles and Rams can — if they choose — wait a year on both Jared Goff and Carson Wentz. Of course, as the Bucs and Titans can attest, the fifth-year option is hardly cheap, but based on their productivity, both Goff and Wentz would still be good values at $21M in 2020 (it helps that they’ve been much more effective than the top two picks in the draft the prior year).

That leaves 14 teams with “franchise QBs” at least measured by dollars (whether Derek Carr or Eli Manning still qualify is a different matter), although Jimmy Garoppolo (another player on whom the jury is still out) — by virtue of having an insane $37M cap hit last year — is only counting for $19.35M against the 2019 cap. These are the quarterbacks you would expect, so there’s not much more to say about them. Last year, Washington and Baltimore were on this list, but both have much cheaper quarterbacks in ’19 (again, with the Redskins being a weird case due to Smith’s injury).

So we have 14 teams that paid big dollars to franchise quarterbacks and another 11 that are trying to win with “cheap” rookie deal quarterbacks. The other 7 teams include two incompletes and five teams that basically lost the quarterback carousel and are still looking to find the answer.

Below is a graphical representation of the NFL landscape, in terms of starting quarterbacks: [continue reading…]

{ 1 comment }

As I do each year, I like to analyze the results from the NFL combine but adjust for height and weight.

Based on the results in Indianapolis in 2019, the best way to project estimated 40-yard dash times based on weight and height was to use the following formula:

Estimated 40-yard dash time = 3.569 -0.002 * height (inches) + 0.005426 x weight (lbs)

Weight has a much bigger role than height when calculating estimated 40 times, and you can see that in the graph below, which represents the estimated 40 times for a player at the ’19 Combine at various heights and weights: [continue reading…]

{ 0 comments }

Antonio Brown is in the news today. The star receiver was just traded from Pittsburgh to Oakland, capping one of the most successful runs any wide receiver has ever had with one team.

Brown led the NFL in receiving yards from 2012 to 2016, a 5-year period where he racked up 7,102 yards. Then he had a monster year in 2017, and his trailing 5-year total was upped to a whopping 7,848 yards. That not only led all players, it also was the largest number of receiving yards any player ever gained over any 5-year period.

That held true for… one season, as Julio Jones — who missed most of 2013 — led the NFL in receiving yards from 2014 to 2018 with 7,994 yards.

The table below shows the league leader in receiving yards over every 5-year period. Note that the AAFC and AFL have pretty strong representation here; for those curious, I included both leagues when calculating the league leaders, but I also noted in the footnotes who would be the leader if your study was NFL stats only. [continue reading…]

{ 0 comments }

The 2014 Draft, Five Years Later

The 2014 Draft is now 5 years in the rear view mirror, which makes it a good time to review the results of that draft.

The graph below shows each player from the 2014 Draft. The X-Axis shows the amount of draft capital spent on each pick, in reverse order. So those players on the left side of the graph were drafted early, with late round picks on the far right side of the graph. The Y-Axis shows the amount of Career AV that player has produced, according to PFR.

[continue reading…]

{ 1 comment }

Sweat is an elite athlete.

Last year, edge rushers Marcus Davenport (14th overall pick by the Saints) and Lorenzo Carter (66th pick by the Giants) ran the top weight-adjusted times in the 40-yard dash.  For perspective, Davenport weighed in at 264 and ran a 4.58, while Carter was 450 pounds and ran a 4.50.  Based on the best-fit formula from the 2018 combine, every 5 additional pounds of player weight corresponded to taking about 3 hundredths of a second longer to run the 40, so Davenport and Carter essentially tied for having the best time in the race.

This year, there was no tie.  In fact, it wasn’t particularly close, as Mississippi State edge rusher Montez Sweat weighted 260 pounds but ran a 4.41!

PFR has 40-yard dash times at the NFL combine going back to 2000. Over that time period, there have been a number of players who have run the race in 4.45 or fewer seconds at a decent weight, and a number of players at 250 pounds or heavier who ran a sub 4.70 40. But being both heavy and lightning fast is pretty unusual. In fact, Sweat and Vernon Davis (2006, 254, 4.38) really stand out in this regard.

The graph below shows the heavy guys who ran fast times, and the fast guys who weren’t super skinny, going back to 2000.  The X-Axis shows weight, and the Y-Axis shows 40 time, in reverse order.  You want to be up and to the right, and Davis and Sweat (both colored in red) stand out the most in that regard.  The top left is all the super fast players, and the bottom right is all the heavy athletes, but it’s the rare athlete who could hang out in either group.  Davis and Sweat are those rare athletes. [continue reading…]

{ 0 comments }

Will The Cardinals Trade Josh Rosen?

Four months ago, this headline would have been unthinkable. But now the rumors are swirling that the Cardinals are interested in drafting Oklahoma QB Kyler Murray with the first overall pick… and also trading Josh Rosen, last year’s first round pick.

I’m short on time today and will try to add more on this later. But for now, I’ll open this up to the crowd:

1) What should the Cardinals do?

2) What do you think the Cardinals will do?

The graph below shows all quarterbacks drafted in the first round of the NFL Draft from 1967 (the start of the common draft) through 2014. For each quarterback, I’ve shown how many starts that quarterback had with the team that drafted him (although for John Elway, Eli Manning, and Philip Rivers, I used the Broncos, Giants, and Chargers, since that feels more appropriate for this study).

Two quarterbacks drafted in the late ’80s — Kelly Stouffer and Jim Everett — were traded after lengthy holdouts and never started a game with the teams that drafted them. Only 21 of the 113 quarterbacks drafted in the first round failed to start 16 games with the teams that drafted them; those quarterbacks are shown in red dots.

{ 0 comments }

The Left-Handed Quarterback Has Disappeared

Look around the NFL these days, and you won’t see any left-handed quarterbacks. The last touchdown pass in the NFL that came from a left-handed player came from Tennessee Titans defensive back Kevin Byard. The 2015 season was the last time an NFL team started a left-handed quarterback, with former Boise State quarterback Kellen Moore and Steelers backupMichael Vick each seeing some action.

The heyday of the southpaw signal caller was in 1995 and 1996, when Steve Young, Boomer Esiason, Mark Brunell, and Scott Mitchell were all regular starters. [continue reading…]

{ 0 comments }

20 Questions: Jets Uniforms Contest

On April 4th, the Jets will unveil new uniforms. There are a lot of questions one can ask about this obviously noteworthy and exciting event. Post your answers in the comments, and we will grade them on April 5th!  All disputes will be resolved by me however I see it.

For each correct answer, you receive the number of points displayed next to that correct answer.  For each incorrect answer, you receive 0 points.  Most points wins. For example, if you answer “yes” to the first question, and the Jets uniform includes the color green, you only get 10 points. If it does not, you get 0 points. But if you answer “no”, and the uniform does not include green, you get 90 points (and you get 0 points if it includes green).

1) Will the uniform include the color green?

  • Yes: 10 points
  • No: 90 points

2) Will green be the primary (as measured by surface area) color on the jersey (i.e., ignoring the pants and helmet)?

  • Yes: 25 points
  • No: 75 points

3) Will the uniform include the color black (not currently on the Jets uniform)

  • Yes: 49 points
  • No: 51 points

4) Will the uniform contain a color that is NOT green, white, or black?

  • Yes: 80 points
  • No: 20 points

5) Will the uniform contain any shade of red?

  • Yes: 95 points
  • No: 5 points

6) Will the uniform contain any shade of blue?

  • Yes: 90 points
  • No: 10 points

7) Will the Jets home uniform contain more black than white?

  • Yes: 60 points
  • No: 40 points

8) Will the uniform include a picture of a jet plane, a reference to flying, or a reference to New York City?

  • Yes: 80 points
  • No: 20 points

9) Assuming green is included (question null if not), will the color green be roughly the same shade of green currently used in the team’s uniform?

  • Yes: 66 points
  • No: 34 points

10) Assuming green is included (question null if not), will the color green be lighter than the shade currently used in the team’s uniform?

  • Yes: 66 points
  • No: 34 points

11) Assuming green is included (question null if not), will the color green be darker than the shade currently used in the team’s uniform?

  • Yes: 66 points
  • No: 34 points

12) Will the Jets main (i.e., excluding alternates) road jersey (excluding pants and helmet) have white as the primary (i.e., surface area) color?

  • Yes: 25 points
  • No: 75 points

Helmet/Logo Questions

13) Will the Jets helmet contain a plane (ala the 1963 version)?

  • Yes: 80 points
  • No: 20 points

14) Will the Jets helmet contain a football?

  • Yes: 30 points
  • No: 70 points

15) Will the Jets helmet contain the letters NY?

  • Yes: 50 points
  • No: 50 points

16) Will the Jets helmet bring back the concept of letters “JETS” in a slant font that resembles the wing of a plane?

  • Yes: 45 points
  • No: 55 points

17) Will the Jets helmet contain 3 colors?

  • Yes: 80 points
  • No: 20 points

18) Will the primary color (i.e., surface area) on the Jets helmet remain white?

  • Yes: 55 points
  • No: 45 points

19) Will the helmet keep the two parallel line down the middle of the helmet theme?

  • Yes: 45 points
  • No: 55 points

20) Will any part of the uniform, logo, or helmet have a call back or reference to the navy and gold Titans uniforms of Jets past?

  • Yes: 90 points
  • No: 10 points
{ 0 comments }

In general, the first running back selected in the Draft finishes as the top rookie running back frequently, all things considered, particularly when the top rookie running back was a high pick (think Todd Gurley or Ezekiel Elliott). Given that there are over 20 rookie running backs most seasons, it is remarkable that the top rookie running back can be the most productive player even more than 25% of the time, which they do.

That was also the case in 2018, at least if you define productivity by traditional measures (advanced metrics may tell a different story). Saquon Barkley had 1,307 rushing yards, 721 receiving yards, and 15 offensive touchdowns; if you credit each touchdown with an additional 20 yards on top of the yards gained to produce that touchdown, that gives Barkley 2,328 adjusted yards.

He also was, by far, the running back on whom the most draft capital was spent. Selected with the 2nd overall pick, the Giants used 30.2 points of draft value on Barkley. That’s more than double the value spent on any other running back.

The graph below shows the draft value and adjusted yards for each rookie running back in 2018. The Y-Axis shows adjusted yards; obviously more is better, and being higher on the chart means more yards. The X-Axis shows draft value, shown in reverse order (you can also think of it as draft pick shown in regular order, but I like my charts to place the best quadrant in the upper right; therefore, draft value is shown from most capital spent to least). [continue reading…]

{ 1 comment }

As I noted earlier this week, the Patriots have a lot of Draft Value in the 2019 Draft. In fact, as of now — which is not going to hold, since the Patriots always make draft day trades — they have more draft capital than any other defending Super Bowl champion since the ’03 Patriots. The ’03 Patriots traded with the Ravens (who were trading up for Kyle Boller) during the ’03 Draft for Baltimore’s 2004 1st round pick. That gave the defending Super Bowl champions two first round picks, which they used on Vince Wilfork and Ben Watson.

Below is the draft capital each Super Bowl champion had in the draft immediately following their Super Bowl victory. I put the six Patriots teams in red. [continue reading…]

{ 0 comments }

2018 Air Yards And YAC, By Position

RB Christian McCaffrey had 867 receiving yards last year, while WR Chris Godwin had 842 receiving yards. But they got there in very different ways. McCaffrey gained just 16 of his receiving yards via “air yards” — yards gained on catches based on yards in the air the pass traveled from the line of scrimmage to the receiver — and 851 of his receiving yards came on yards gained after the catch. Godwin had 597 air yards, and 245 yards after the catch.

That’s an extreme split, but consistent with the general rule that running backs gain very little air yards (many of their receptions come from behind the line of scrimmage, which produces negative air yards) and a lot of yards after the catch. For wide receivers, about 60-70% of their yards come through the air, with the remainder coming after the catch.

Tight ends are interesting, by virtue of usually landing somewhere in between those two marks. The graph below shows data from the 2018 season, with air yards shown on the X-Axis and yards gained after the catch shown on the Y-Axis. Running backs are in red, tight ends are in green, and wide receivers are in blue. [continue reading…]

{ 0 comments }
Previous Posts