
Regular readers are familiar with my running back heat maps, but let’s use Ezekiel Elliott and Saquon Barkley as examples.
Last season, Elliott and Barkley finished first and second in rushing yards and rushing attempts. Elliott averaged a very strong 4.73 yards per carry, but Barkley had a sparkling 5.01 YPC average. However, there is more than meets the eye.
Elliott rushed for positive yards on 83% of his carries; that’s pretty good, because the average among all running backs with at least 100 carries was 81%. Meanwhile, Barkley rushed for positive yards on only 77% of his carries. Elliott rushed for at least 2 yards on 71% of his carries; Barkley did it on just 61% of his carries. Gaining at least 3 yards? Elliott did that 55% of the time, while Barkley did it just 48% of the time. This trend holds true for awhile: Elliott picked up at least 4, 5, and 6 yards on 45%, 35%, and 29% of his carries; for Barkley, those rates were 38%, 30%, and 25%, respectively.
At least 7 yards? Elliott did that on 24% of his carries, while Barkley only rushed for 7+ yards 18% of the time. It gets a little closer at 8 and 9 yards, but Elliott still wins, 18% to 16% and 16% to 15%.
How about at least 10 yards? The Cowboys star gained 10 or more yards on 13% of his rushes; Barkley did it on 12% of his carries. How about 15+ yards? Elliott hit that mark on 8.2% of his carries, while the Giants start did it on 7.7% of his rushes. So how in the world did Barkley finish the season with a higher yards per carry average? Because Elliott rushed for 20+ yards on just 4% of his carries, while Barkley did it on 6% of his carries. More importantly, Elliott’s longest run was 41 yards, while Barkley had runs of 46, 50, 51, 52, 68, 68, and 78. That’s how, despite Elliott pretty much “winning” at each distance, he lost the YPC battle. Even if Elliott had big runs more often, Barkley’s big runs were really big runs.
In the picture below, I’ve listed all running backs with at least 100 carries. I calculated how often each running back, on each carry, rushed for least 1 yard, at least 2 yards, at least 3 yards,… at least 10 yards, at least 15+ yards, and at least 20+ yards. I plotted that below, but to make the graph more user friendly, each cell shows often the RB gained at least X yards relative to league average for all RBs with 100+ carries. So for Barkley, he rushed for at least 1 yard on 77% of his carries; since the league average is 81%, I put a “-4%” in his cell rather than 77%.
When you review, note that blue shading is good (meaning a player gained yards at a higher clip than average) while red shading is bad.
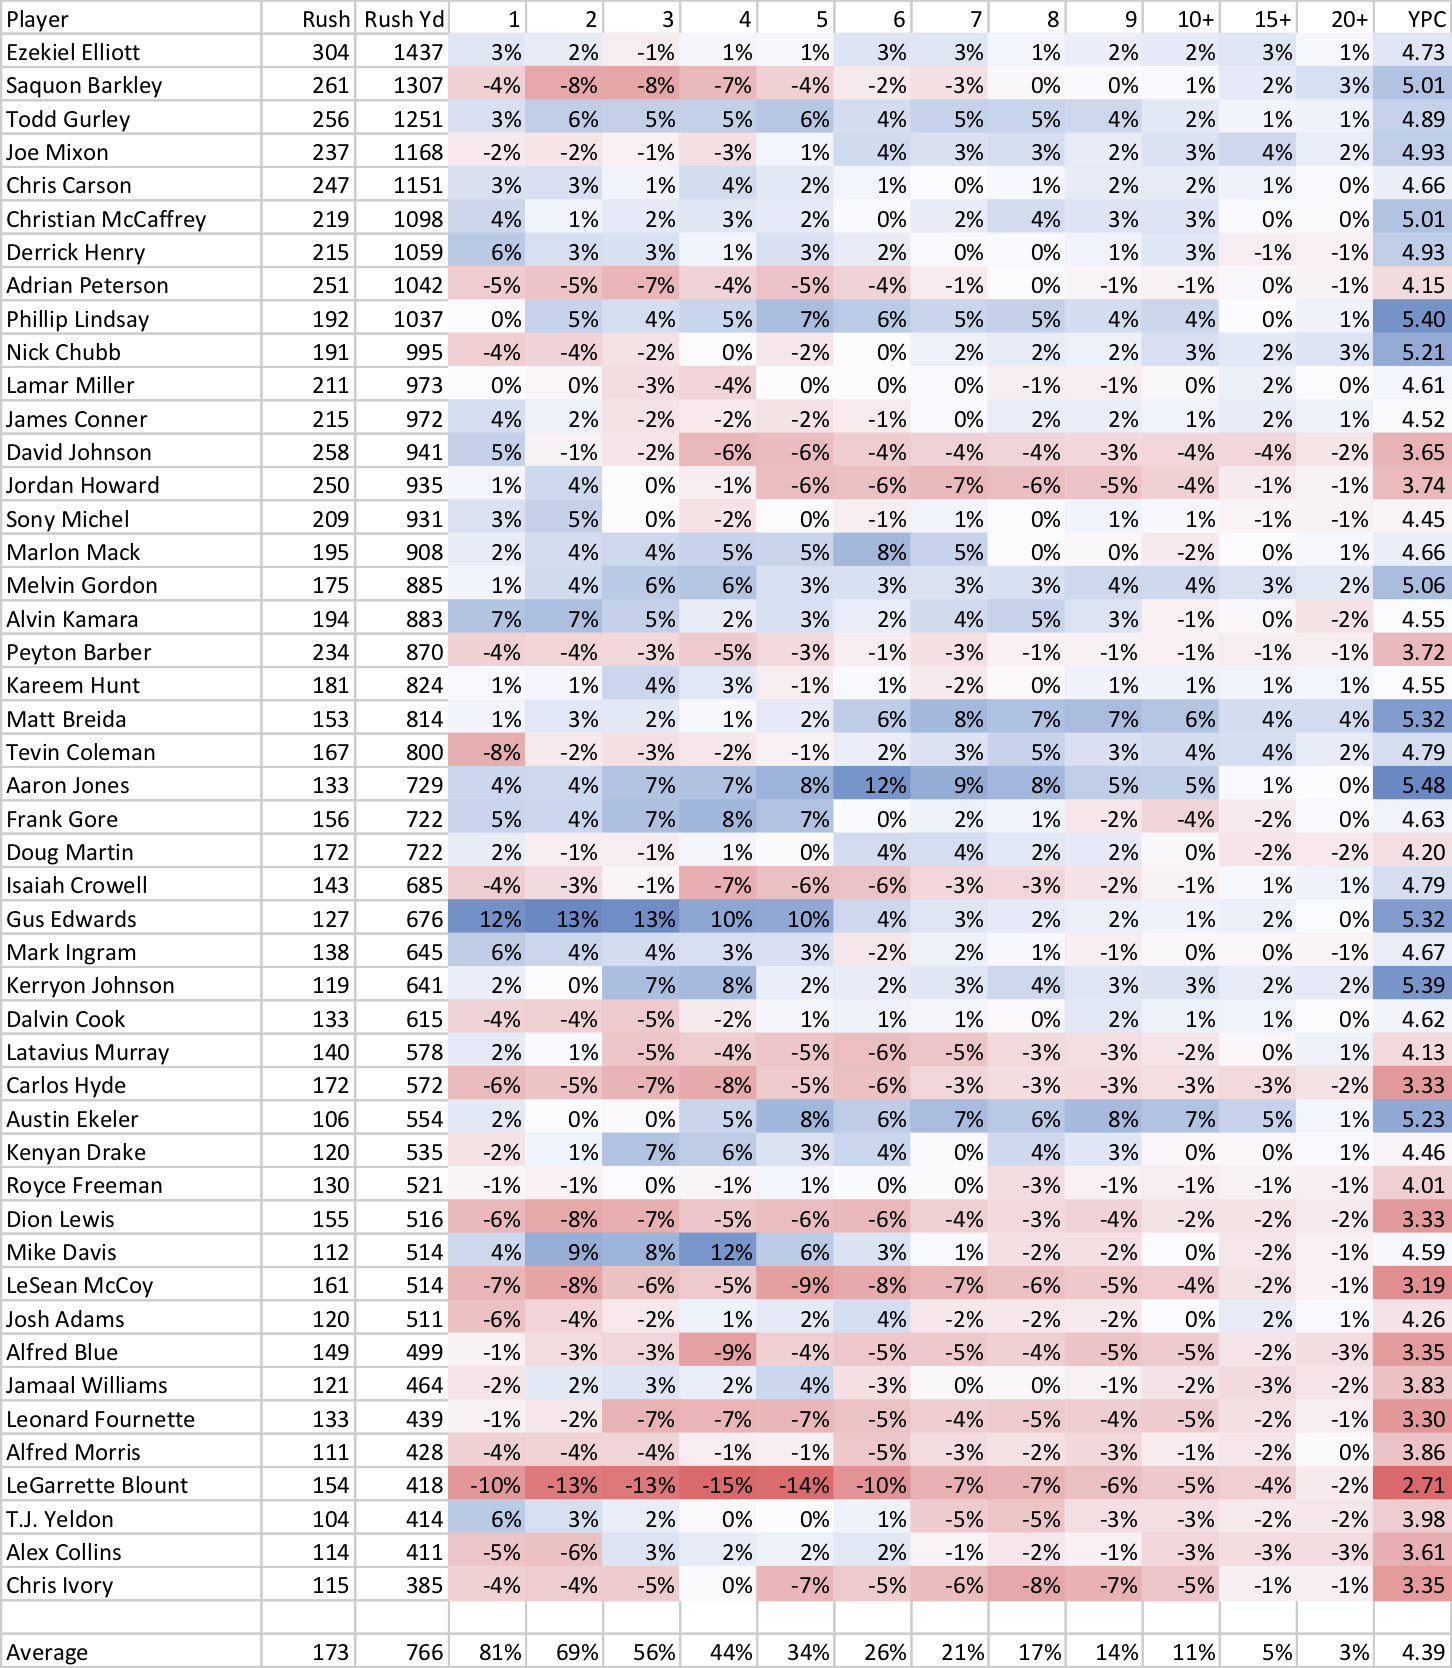
For Barkley, the obvious takeaway is that his YPC average overstated his 2018 production. He rushed for at least 4+ yards significantly less often than the average runner, and was generally well below average at producing successful runs. Note that this is a criticism of his production and his statistics, not Barkley the player (for example, your view may be that his below-average play on a carry-to-carry basis was entirely due to his offensive line). But whatever you think of Barkley the player, I don’t think it’s arguable that his YPC significantly overstated how effective he was on a consistent basis.
Who stands out as being terrific on a consistent basis?
Aaron Jones was at +7% when it comes to picking up at least 4 yards, and really stood out at gaining 6 or more yards: he did that on 38% of rushes, compared to an average of 26% for all running backs in this data set. Baltimore’s Gus Edwards was exceptional at gaining positive yards: he was 10% above average at gaining 1+, 2+, 3+, 4+, and 5+ yards, in the Ravens remarkable running attack under Lamar Jackson.
But both Jones and Edwards had excellent YPC averages, so most people probably assumed they had good seasons. Three players who were noteworthy at consistently gaining yards well above their YPC average are Alvin Kamara, Kenyan Drake, and Mike Davis. Kamara gained 3+ yards and 8+ yards at a rate that was 5% above average, but his YPC was capped by a lack of big runs. In fact, Kamara had just one run that was greater than 18 yards, a 49-yard rush against the Giants. Drake was one of the best at gaining 4, 5, or 6 yards, but was average at gaining 10+ yards. And Davis was below average at even medium gains — say, 8 or 9+ yards — but fantastic at getting 2, 3, and 4 yards at a time. In fact, Davis led the NFL when it came to picking up at least 4 yards, doing so 56% of the time. That came despite only finishing slightly above average in YPC.
In addition to Barkley, Nick Chubb and Isaiah Crowell stand out as players whose YPC overstate their carry-to-carry effectiveness.
What stands out to you?