≡ Menu

There are still three games left to play in the 2023 NFL regular season. And for San Francisco, that includes a game Monday night against the AFC’s best team, the Baltimore Ravens. But let’s just pause for a moment and appreciate how dominant San Francisco has been this year.

On offense, the 49ers are averaging 9.45 Adjusted Net Yards per Attempt. [1]ANY/A is simply yards per attempt, with a 20-yard bonus for sacks, a 45-yard penalty for interceptions, and includes sack data. That is significantly better than the rest of the league; Miami ranks second at 7.89, and Houston ranks third at 7.07. The league average this season is 5.79 ANY/A, meaning San Franciso is averaging 3.66 ANY/A more than the average team. How remarkable is that? Well, if it holds up, it would finish as the third best of the Super Bowl era:

Yes, that means this San Francisco offense — with Brock Purdy, Christian McCaffrey, Deebo Samuel, George Kittle, Brandon Aiyuk, and Trent Williams — is already one of the best of the Super Bowl era even after you adjust for era. [2]Without adjusting for era, the 49ers rank as the 2nd-best passing offense ever. Think about that: every other offense in the Super Bowl era, besides Peyton Manning in his best year and Dan Marino in his best year, has been less efficient than this year’s 49ers team. [continue reading…]

References

References
1 ANY/A is simply yards per attempt, with a 20-yard bonus for sacks, a 45-yard penalty for interceptions, and includes sack data.
2 Without adjusting for era, the 49ers rank as the 2nd-best passing offense ever.
{ 4 comments }

Pick a QB, any QB: there are no right answers.

The 2018 NFL Draft was supposed to change the landscape of the NFL at the quarterback position. Maybe not right away, of course, but in a few years — say, 2021? — the five quarterbacks selected in the first round of the 2018 NFL Draft would be the stars of the day. Instead, Josh Rosen flamed out immediately, Sam Darnold proved to be underwhelming under three different coaches, and Baker Mayfield’s stock fell dramatically in his fourth year. Even Lamar Jackson, the 2019 AP MVP, has fallen off; after a notable dropoff in play from 2019 to 2020, he fell further in an injury-plagued 2021. At this point, only Josh Allen is an unimpeachable franchise quarterback, but even he has seen a significant decline in passing efficiency this season.

All told, the 2018 first round quarterbacks as a group have been decidedly below average as passers this season, with three of the four starters (excluding Rosen) being in the bottom five of the NFL in interception rate.

This made me curious: which draft classes have been the most productive in 2021? With 17 weeks in the books — a traditional NFL regular season — here’s what I did. [continue reading…]

{ 0 comments }

Cowboys cornerback Trevon Diggs has  recorded 11 interceptions through 15 team games this season. That’s already the most in the NFL by any player since 40 years ago, when another Dallas corner — Everson Walls — also had eleven picks.  Last year, I wrote about Xavien Howard and J.C. Jackson, the two AFC East cornerbacks who were doing something pretty remarkable. Both players had absurdly high interception numbers given the context of the modern game, which involves adjusting for era.

While teams throw more often now than they did throughout the history of the game, the frequency of interceptions per pass attempt has dipped at an even more severe rate than the quantity of pass attempts has risen. That’s why, despite more passing, there are fewer interceptions per game in the modern era than there has been at any other time since World War II. The graph below shows interceptions per team game in the NFL from 1945 through week 16 of the 2021 season: [continue reading…]

{ 1 comment }

Top Receivers in 2020 Per Team Pass Attempt

Nobody could stop Adams in 2020.

Davante Adams was the best wide receiver in the NFL in 2020, and by a very large margin. Unless you want to assign a heavy penalty on him for playing with the MVP quarterback, Adams had otherworldly numbers. He played in just 14 games, but still gained 1,374 yards, 73 first downs, and caught 18 touchdowns. This came in just 461 pass attempts during those 14 games, making that even more impressive.

When measuring receiver performance, it’s important to recognize that some wide receivers play on pass-heavy teams while some play on run-heavy teams. Targets are often mistakenly viewed as a measure of opportunity, when really targets are a form of production; a player who gets a target on a play is doing something positive. The best measure of opportunity is routes run, and team pass attempts serves as a good proxy for that.

Let’s skip Adams, who again blows away the field. Let’s instead look at Titans wide receiver A.J. Brown, who is often the lead horse for the great efficiency numbers that Ryan Tannehill has produced since joining the Titans. Brown missed two games this year, but in those 14 games, he gained 1,075 receiving yards, 55 first downs and 11 touchdowns. Most impressively, this came with only 424 pass attempts (excluding sacks) in those games. Brown picked up a first down on 13% of all Titans pass attempts in the games he played, the fourth-best mark in the NFL; he caught a touchdown on 2.6% of all Tennessee pass plays during those 14 games, the third-highest mark in the league. A receiver can only produce on passing plays, and Brown was a huge reason for the Titans success last year.

For each receiver last year, I calculated how many Adjusted Catch Yards they gained, which is simply receiving yards with a 9-yard bonus for each first down and a 20-yard bonus for each touchdown. [1]Without duplication, so a touchdown only gets 11 additional yards, since each touchdown is always a first down. For Brown, that means he gained 1691 adjusted catch yards; in the 14 games he played, he averaged 3.99 ACY per team pass attempt, the second-best rate in the NFL. Here are the top 100 receivers by this metric: [continue reading…]

References

References
1 Without duplication, so a touchdown only gets 11 additional yards, since each touchdown is always a first down.
{ 0 comments }

In the modern NFL, the passing game — and the passing offense — is king.  With completion percentages, passing yards, and passing touchdowns continuing to hit all-time highs, and interceptions reaching all-time lows, it’s easy to only focus on each team’s passing game.  But you may have missed not one, but two of the greatest defensive record-breaking seasons of all time.

The NFL record by a defensive player for interceptions in a season is 14, set by Dick “Night Train” Lane in 1952.   A bad faith argument sometimes notes how remarkable it was that Lane did that in a 12-game season, ignoring the fact that interceptions were more than three times more likely per pass attempt back in the early ’50s.  And while pass attempts are going up, because the interception rate has dropped so significantly, the amount of interceptions in each game has significantly decreased over time:

[continue reading…]

{ 1 comment }

Previously:

[continue reading…]

{ 0 comments }

The Giants have 306 rushing yards this year, and quarterback Daniel Jones has 137 of them, leaving just 169 for the rest of the team.

In the passing game, Jones has thrown every pass for New York through four weeks in 2020. He has picked up 889 passing yards and also lost 83 yards due to sacks. If we look at his advanced splits, we see that 541 of his passing yards have come through the air, with 348 yards coming via yards after the catch. A quarterback is not fully responsible for his air yards, and a quarterback also plays a role in how much YAC his receivers gain. That said, I thought it would be fun to engage in a bit of fiction and treat all air yards as belonging to the quarterback, and all YAC as belonging to the receivers.

In that case, Jones has gained 137 rushing yards, thrown for 541 yards, and lost 83 yards due to sacks, for a total of 595 yards. That is not very much, but consider: all other Giants have gained just 169 yards on the ground and 348 after the catch, for a pitiful total of just 517 yards. So Jones has been responsible for 53.5% of all Giants yards in 2020, which is actually the largest percentage of any player in the league.

To go to the opposite extreme, let’s go visit newly benched quarterback Dwayne Haskins in Washington. The Football Team has rushed for 369 yards, with Haskins only adding 30 yards on the ground. And while the 2018 first round pick has thrown for 939 yards this year, most of them have come after the catch: Haskins has just 362 air yards, compared to 577 yards added after the catch by his receivers (Washington running backs Antonio Gibson and J.D. McKissic have combined for 21 receptions and 176 yards, but 190 of those yards came after the catch; in addition, wide receiver Terry McLaurin leads all wideouts through four weeks in YAC with 198 yards.) Haskins has also lost 101 yards on sacks so far this season: add it up, and Haskins is responsible for adding only 291 yards of offense (30+362-101) by this methodology, while his teammates have picked up 916 yards of offense (339 rushing yards and 577 of YAC). That puts Haskins as the main man for just 24.1% of the yards that Washington’s offense has gained this year.

I used this methodology for every team in the league. Only two quarterbacks, Jones and Ryan Fitzpatrick in Miami, are responsible for over half of their team’s offense. Among teams that have winning records, Lamar Jackson and Josh Allen stand out as two quarterbacks who have gained over 48% of their team’s offenses. After them, Ryan Tannehill, Russell Wilson, and Tom Brady stand out (all over 45%) as no other quarterback is on a team with 3+ wins and has even 40% of his offense.

The full list is below. I also included what percentage of the team’s pass attempts each quarterback has taken, to help you identify quarterbacks who have missed some time. Here’s how to read the Lamar Jackson line. This year he has thrown for 516 air yards compared to having just 253 yards of YAC; he also has rushed for 235 yards. Jackson has lost 70 yards due to sacks, giving him a total of 681 responsible yards. As a team, Baltimore has 1,366 yards of offense, which means Lamar Jackson has been responsible for 49.9% of the team’s yards. Jackson has also taken 97% of the Ravens team pass attempts this year, and has a 3-1 record. [continue reading…]

{ 0 comments }

Week 2 (2020) Game Scripts: The Jets Stay Grounded

Previously:

[continue reading…]

{ 0 comments }

Rob Gronkowski, Tom Brady, and WOWY Stats

Tis better to be with Gronk than without.

Rob Gronkowski played for the New England Patriots from 2010 to 2018. It was one of the wildest and most celebrated rides in NFL history. But today I want to build on the great work done by Adam Harstad and analyze Gronk’s career through the lens of how Tom Brady fared — with and without Gronk. [1]As always, thanks to Adam for the inspiration and much of the methodology behind this post. For defining what is included in my data set, please jump to the end of this post to see how Gronk games and non-Gronk games are defined.

I am going to not going to spend much time discussing Gronk’s first and last seasons, for two reasons. In 2010, rookie Gronk was not yet Gronk(TM); he also didn’t miss any games. And 2018 Gronk was BrokenGronk; outside of 2010 and 2018, he was pretty much always a dominant force when healthy.

So let’s focus on the prime 7 years of Gronk’s career. In 2011, 2014, and 2015, Gronkowski was almost always healthy. There was only one missed game of note there, and it was one where Brady and the entire Patriots team struggled. [2]Technically there was a second missed game, but it was a week 17 game where Gronkowski sat out to rest and Brady only played a half. In those three seasons, Gronkowski was a unanimous first-team All-Pro selection each season among major voting publications.

So, for WOWY purposes — that is, With Or Without You — the seasons we have to analyze for Gronkowski and Brady are 2012, 2013, 2016, and 2017. And the results are staggering in each year.

2012

The Patriots had 10 Gronk games and 8 non-Gronk games this season, which ended in a loss without Gronk to the Ravens in the AFC Championship Game. The stats:

  • In the Gronk games, New England had a 0.700 winning percentage, averaged 35.8 (!) points per game, picked up 28.4 first downs and 16.4 passing first downs per game, and the passing offense averaged 7.73 Adjusted Net Yards per Attempt (ANY/A).
  • In the non-Gronk games, New England had a 0.750 winning percentage, averaged 31.6 points per game, picked up 26.5 first downs and 15.8 passing first downs per game, and averaged 6.84 ANY/A.

Notably, that’s a difference of 4.2 points per game and 0.89 ANY/A per game without Gronk. And while the record was slightly worse, it’s worth noting that the three losses came by a combined four points.

2013

The Patriots had 7 Gronk games and 11 non-Gronk games this season, which ended in a loss without Gronk in the AFCCG to the Broncos.  The stats:

  • In the Gronk games, New England had a 0.714 winning percentage, averaged 32.0 points per game (and allowed 27.1 PPG), picked up 26.6 first downs and 16.3 passing first downs per game, and averaged 6.98 ANY/A.
  • In the non-Gronk games, New England had a 0.727 winning percentage, averaged 25.4 points per game (and allowed 17.8 PPG), picked up 21.3 first downs and 12.3 passing first downs per game, and averaged 5.64 ANY/A.

The offense nearly fell apart without Gronk, dropping 6.6 points per game and gaining 5.3 fewer first downs.  The passing offense declined by 1.34 ANY/A. And while I presume this is mostly (all?) due to randomess, this begins a trend of New England allowing significantly fewer points in non-Gronk games. Which is just weird.

2016

The Patriots had 5 Gronk games and 10 non-Gronk games this season — which was perhaps Brady’s best season outside of ’07.  New England won the Super Bowl without Gronkowski.  The stats:

  • In the Gronk games, the Patriots posted a 4-1 record [3]With Gronk unable to haul in the game-tying touchdown catch, or the victim of pass interference, depending on your perspective., averaged 32.0 points per game (and allowed 20.4 PPG), picked up 23.6 first downs and 13.8 passing first downs, and had a ridiculous 9.93 ANY/A average.
  • In the non-Gronk games, the Patriots went 1o-0, averaged 30.4 points per game (and allowed 14.8 PPG), picked up 24.0 first downs and 14.9 passing first downs, and averaged 7.67 ANY/A.

It’s hard to argue with 10-0, and the team gained more first downs without Gronk… but the record was driven in large part by that defense, too.  The Patriots averaged 1.6 more points per game with Gronk and 2.26 ANY/A per game with Gronk.  In the 5 Gronk games, Brady’s stat line was just ridiculous, and the offense scored 20 touchdowns and had just 18 punts and one interception. That was, of course, an unsustainable pace, but it just highlights how dominant Brady and Gronk were in ’16; in the 10 non-Gronk games, the offense had 34 touchdowns and 47 punts. In these 5 games, Gronkowski caught 24 passes for 19 first downs, 529 yards and 3 touchdowns.

2017

The Patriots had 16 Gronk games and 3 non-Gronk games this season, which ended with a loss in the Super Bowl to the Eagles (but don’t blame the Patriots passing attack or Gronkowski, who had 116 yards and 2 touchdowns). The stats:

  • In the Gronk games, the Patriots had a 0.813 winning percentage, averaged 30.4 points per game, picked up 25.8 first downs and 15.7 passing first downs, and averaged 8.22 ANY/A.
  • In the non-Gronk games, the Patriots went 2-1, averaged 21.0 points per game, picked up 19.7 first downs and 13.3 passing first downs, and averaged 5.81 ANY/A.

That sounds like a huge drop — 9.4 points per game and 2.42 ANY/A — but the sample size is small.  Brady played poorly in the two regular season non-Gronk games, an upset loss to Miami and a narrow win over Tampa Bay.   Those were two of his worst games of the season, which probably wasn’t just a coincidence. I don’t want to make much out of a 3-game sample size, but putting aside the magnitude, the direction is consistent with other years.
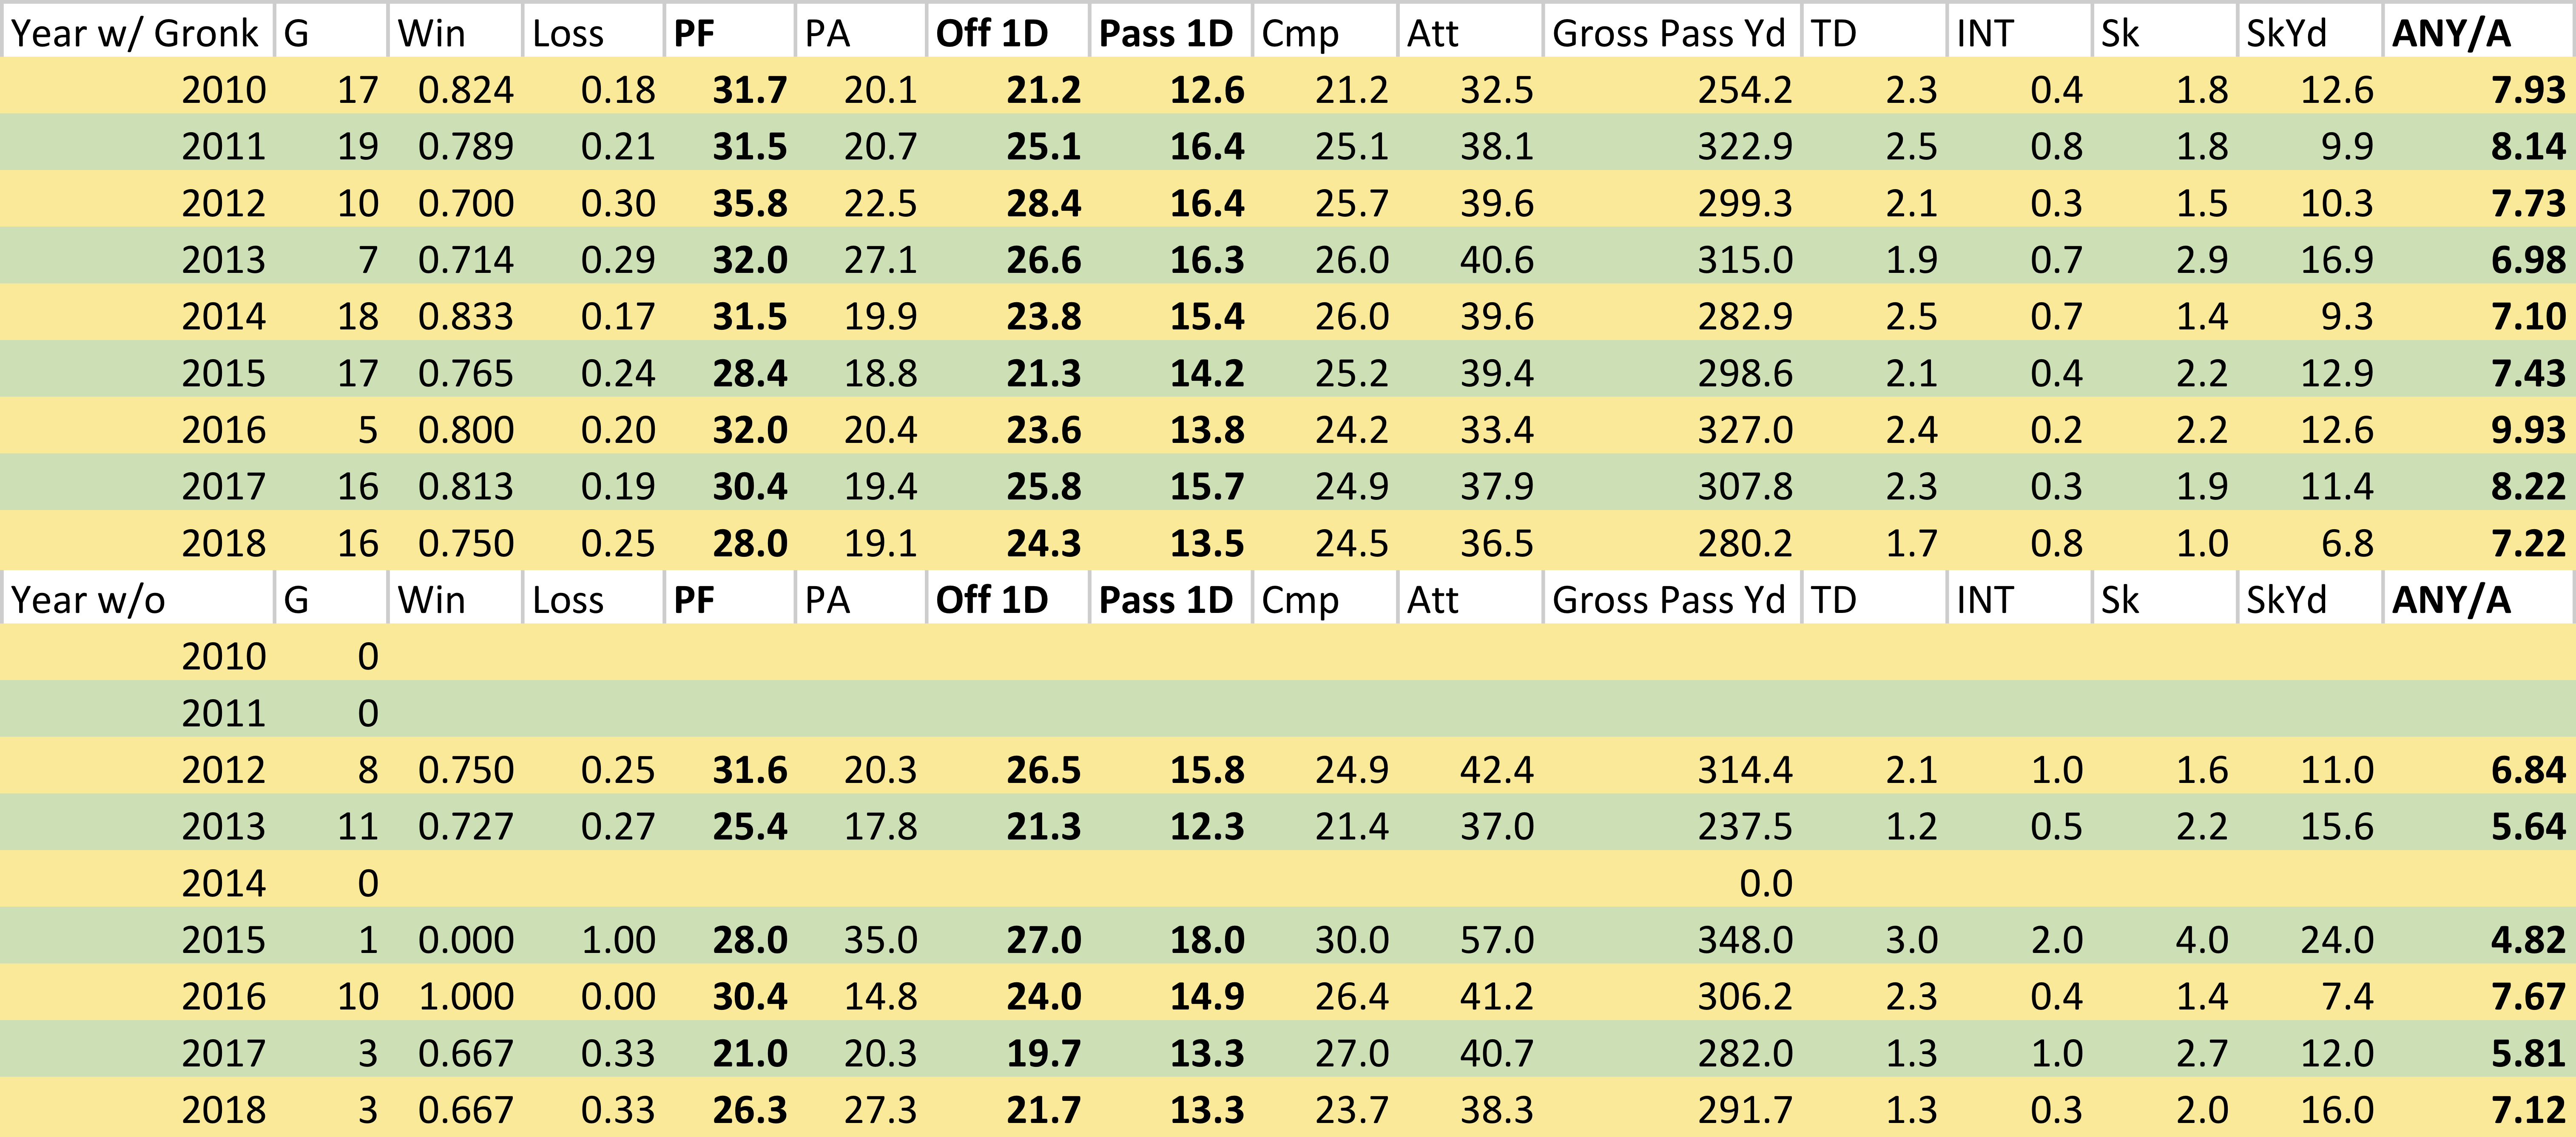
Gronk WOWY Stats

Here are the full stats for Brady and the Patriots offense in each season, in both Gronk games (top rows) and non-Gronk games (bottom rows).

What Is A Gronk Game and What is Not A Gronk Game?

Finally, let me explain how I identified what is a Gronk game and what is not a Gronk game. Let’s work in reverse order:

  • 2018: Gronk missed the games in weeks 8, 10, and 11 due to ankle and back injuries.  While he was not necessarily his former self, he played in at least 67% of the snaps in every other game this season.
  • 2017: Gronk missed 3 games here.  He missed a game on a short week against the Bucs due to a thigh injury, was suspended for the second Dolphins game, and suffered a concussion in the first half against the Jaguars in the AFC Championship Game.  He finished that game with just 1 target and 26 snaps, representing 41% of the team’s snaps.  I am counting this as NOT a Gronk game (which the Patriots won).  Note that in the regular season finale against the Jets, Gronk played most of the game (68% snaps) but functioned solely as a blocker: he did not record a single target. That still counts as a Gronk game, as it was more importantly for the Patriots offense, a Bryce Petty game.
  • 2016: Gronk missed the first two games of the season with a hamstring injury, and played just 11 snaps (blocking on 10 of them) in the week 3 game against Houston.  However, I am going to exclude all of the first four games of the 2016 season for New England, since Brady was suspended; those games are eliminated from this study and don’t count as a Gronk game or a non-Gronk game, since we are analyzing Brady’s WOWY stats. Then in week 12 against the Jets, Gronk suffered a season-ending back injury and played just 7 snaps. New England won, 22-17; this game is counting as NOT a Gronk game. So games 5 through 9 are the only Gronk games this year.
  • 2015: Gronkowski missed one game (against the Eagles) due to a knee injury.
  • 2014: Gronkowski began the year missing the preseason as he recovered from a torn ACL/MCL (more on this below); he wound up playing between 40 and 45% of the Patriots offensive snaps the first two weeks, where New England went 2-0.  I am counting these games as Gronk games (he had 17 combined targets), but just wanted to note the injury.  Gronkowski sat out the week 17 game, which would normally mean that’s a non-Gronk game.  But because the Patriots had clinched the #1 seed before the week 17 game and Brady only played for the first half, so I am excluding that game as a non-Gronk game, too.  That is the fifth and final game in this study I am eliminating entirely (along with the four suspension games for Brady).
  • 2013: Gronkowski suffered a season-ending knee injury on a hit by T.J. Ward early in the 3rd quarter of a week 14 game against the Browns.  Since Gronk played 49% of the snaps and made it into the third quarter, I will still count this as a Gronk game (as opposed to the Jaguars AFCCG).
  • 2012: Gronk broke his forearm late in a win over the Colts in week 11; that game counts as a Gronk game.  However, he barely played (31% of snaps) in his return, a tune-up, week 17 game to get ready for the playoffs, and then re-injured his arm seven snaps into the team’s first playoff game.  He would miss the rest of the season.  Both of those final two games are being counted as non-Gronk games. Therefore, the first 10 games of ’12 were Gronk games, and the last 8 games were non-Gronk games.
  • 2011: No missed games.
  • 2010: No missed games.

As always, please leave your thoughts in the comments.

References

References
1 As always, thanks to Adam for the inspiration and much of the methodology behind this post.
2 Technically there was a second missed game, but it was a week 17 game where Gronkowski sat out to rest and Brady only played a half.
3 With Gronk unable to haul in the game-tying touchdown catch, or the victim of pass interference, depending on your perspective.
{ 0 comments }

Guest Post: QB Game Scores

Today’s guest post comes from one of the longest followers of this blog (and its predecessor), Richie Wohlers. Richie is an accountant from Southern California who is a Dolphins fan despite never being to Florida. As always, we thank our guest posters for contributing.


Inspired by Bill James’s Game Score for pitchers, I’ve been tracking something similar for quarterbacks.

This is just a simple way to look at box score stats for a quarterback to see who had the most statistically impressive games.  This is not taking things into account such as win probabilities, air yards, EPA, opponent quality, etc.  More importantly, there are no era adjustments, so this is biased in favor of modern players. That said, the goal was just to create a single number to back up the “awe” factor we may have seen while watching the game.

Methodology:

There are five components to my game score.  They are each weighted equally, though (as with passer rating) completion percentage ends up getting “double-counted” with yards per attempt.  The categories are: Total Yards, Touchdown Passes, Completion Percentage, Yards per Attempt and Interception Percentage.  Each category is worth 20 points, so a perfect game would be worth 100 points.

The threshold for each category is based on the best performance of all time.  Those thresholds are:

Yards: 554 (Norm Van Brocklin, 1951)

Touchdowns: 7 (6 times, most recently Drew Brees in 2015)

Completion Percentage (min 15 attempts): 96.7% (Drew Brees, 2019)

Yards/Attempt (min 15 attempts): 20.5 (Craig Morton, 1970)

Interception Percentage: Each percentage point deducts two points from a player’s score.  (Drew Brees is the highest-rated QB to throw an interception, when he threw for 511 yards, 7 TD and 2 Int in 2015.  It ranks as the 19th-best game.)

A player’s portion of those records is multiplied by 20.  So when Patrick Mahomes threw for 443 yards last season, that was worth ( 443 / 554 = 0.8 * 20 )  16 points.

The top 10 performances: [continue reading…]

{ 3 comments }

Let’s get it out of the way: playing with Tom Brady and Peyton Manning sure helps. From 2007 to 2013, Wes Welker had the best seven year stretch of his career, and most of that time came with Brady as his quarterback (there was one season with Matt Cassel and the 2013 record-breaking season with Manning). During those seven seasons, Welker’s teams averaged a remarkable 32.3 points per game. In 2014, Welker’s team — still the Broncos — also topped 30 points per game, but the other seasons of Welker’s career were spent on significantly less productive offenses.

Of course, in most of those other seasons, Welker himself wasn’t a significant part of the offense: he was a young backup or a past-his-prime player. I wanted to calculate how many points per game each wide receiver’s offense scored over his career. This is trickier than you’d think: what do you do for years where a player was a backup, or missed time due to injury? For Welker, he played 14 games with the 2004 Dolphins but as a returner and did not catch a pass. Would that team count in his career average?

To solve for these problems, I weighted each season by the percentage of career receiving yards he gained in that season.  Welker gained 9,924 receiving yards in his career.  In 2015 with the Rams, he gained 102 yards, or 1.0% of his career total.  That isn’t much, so the Rams production that year — 17.5 points per game, or 5.31 PPG below average — counts for 1.0% of Welker’s career score.  The 2013 Broncos averaged 37.88 PPG, 14.47 better per game than league average; since Welker gained 7.8% of his career yards that season, the 2013 Broncos stats count for 7.8% of his career total.  Welker’s best year was 2011, when he gained 1,569 yards.  That represented 15.8% of his career total, so the 2011 Patriots — 32.06 points per game, 9.88 points per game above league average — counts for 15.8% of Welker’s career grade.

If you perform this analysis for every season of Welker’s career, his team’s averaged 30.13 points per game once you weight for Welker’s production, which was 8.11 points per game above average. Here’s the math: the final two columns represent the product of multiplying his percentage of career receiving yards in that season by his team’s scoring (both raw and relative to league average): [continue reading…]

{ 0 comments }

Gronk played on very good passing offenses.

Let’s talk about little bit about Kellen Winslow II. Winslow’s life has been marked more by what’s happened off the field than what happened on the field, starting with being the son of a Hall of Famer, continuing with an awful motorcycle accident early in his career, and ending with a conviction for rape and a CTE diagnosis. On the field, Winslow was productive but played during the peak of the tight end era: Tony Gonzalez, Antonio Gates, and Jason Witten were all still in their prime, Rob Gronkowski and Jimmy Graham were setting single-seaosn records, and guys like Vernon Davis and Dallas Clark were productive Pro Bowlers.

Winslow produced solid numbers, but he did so in the worst of circumstances. During this time, his quarterbacks were mostly Josh Freeman and Derek Anderson, along with a season of Charlie Frye, and a few games from Josh Johnson, Brady Quinn, and end-of-career Byron Leftwich. On average, Winslow’s offenses were 0.87 ANY/A below average during the course of his career, weighted by how productive Winslow was each season. Among tight ends with at least 5,000 career receiving yards, that is — by a large measure — the worst group of passing offenses. The second-worst would be Todd Heap: About a quarter of his career came with the early days of Joe Flacco, and another quarter was defined by the Kyle Boller era. He caught passes from end-of-career Steve McNair, Anthony Wright, Jeff Blake, Chris Redman, Elvis Grbac, and also Kevin Kolb and John Skelton in Arizona. On average, Heap’s offenses finished 0.45 ANY/A below average.

Only three other tight ends with 5,000+ career receiving yards played on teams that finished at least 0.20 ANY/A below average: Rich Caster (who had a little bit of prime Joe Namath and then little else), Delanie Walker, and Greg Olsen. If you want to lower the threshold for tight end production, we should all feel badly for Chargers TE Freddie Jones, who played with Ryan Leaf and a string of bad quarterbacks who were either bad, very young, or very old (or two of those three). For his career, Jones’s passing offenses finished 1.46 ANY/A below average. We can also pour one out for Boston Patriots TE Jim Whalen, who was one of the best tight ends of the late ’60s. In 1968, as the Patriots finished with the second-worst passing offense in the AFL — the passing offense was 2.88 ANY/A below average — Whalen somehow was a first-team AP All-Pro. Among all tight ends who have been named first-team All-Pro in a season, that is the worst accompanying passing offense in history. Whalen was a consummate Massachusetts man: he was born and raised in Cambridge, starred at Boston College, and then was drafted and spent the first five years of his career with the Patriots. That said, most of his career was played with bad or out of their prime quarterbacks.

On the other side, Brent Jones had a pretty sweet set-up: he played most of his career with Steve Young or Joe Montana, and his average offense had a Relative ANY/A of +2.00.  Second on the list would be Rob Gronkowski, who of course played with Tom Brady.  And if you lower the minimum threshold, nobody had it easier than Aaron Hernandez, who played his entire, short career during Brady’s prime.

I looked at the careers of over 100 tight ends and calculated how productive their average passing offense was. Regular readers may recall that I previously used a similar methodology to grade wide receivers. Let’s use Vernon Davis as an example.  He’s experienced it all, from the early struggles of Alex Smith to the efficient version, the dark days of Shaun Hill and Troy Smith, but also the good days of Colin Kaepernick and Kirk Cousins. [continue reading…]

{ 1 comment }

How much did passing efficiency decline in 2019 compared to a record-setting 2018? That depends, a bit, on how you measure passing efficiency — in more ways than one.

In 2018, all NFL passers combined to average 6.32 Adjusted Net Yards per Attempt. In 2019, all NFL passers combined to average 6.16 ANY/A, a decline of 2.6%. However, there is another way to measure league average, and that’s by taking an average of the average ANY/A stats for each of the 32 teams.

In 2019, while “the NFL” as a whole had a 6.16 ANY/A average, an average of each of the ANY/A rates for the 32 teams comes to 6.19. If that is confusing to you, think of it this way: when we calculate “the league average” in passing stats, we are giving more weight to the Bucs, Panthers, and Falcons than to the Ravens, Titans, and Vikings. Collectively, those three NFC South teams were responsible for 11.0% of all passing plays in 2019; meanwhile, pass plays from Baltimore, Tennessee, and Minnesota account for only 7.7% of NFL passing plays.

When we think of league average, we almost always mean a weighted average that gives more weight to the teams that pass most frequently. But there’s at least an argument to be made that league average would be better defined by taking an average of the averages. And in this case, in 2019, it would mean a higher average: that’s because the wrong passers threw it more often in 2019.

Last year, the right passers threw it more often: an average of the ANY/A produced by each of the 32 teams was 6.29 (which was lower than the normal average of 6.32, since the weaker passing teams threw less frequently last year). By this measure, passing efficiency declined only 1.6% — from 6.29 to 6.19 — from 2018 to 2019, rather than by 2.6%.

Let’s look at each team in 2019. The X-Axis shows the number of dropbacks: the NFC South teams (other than the Saints) are on the far right, because they passed the most. The Y-Axis shows pass efficiency, as measured by ANY/A.

It’s pretty clear that the “wrong teams” passed most often in 2019; the chart has a slope that is down and to the right. This, of course, is why the “NFL ANY/A” was 6.16 but the “average of the ANY/A for the 32 teams” was 6.19; by giving the Ravens and Titans equal weight to the Bucs and Panthers, you raise the average.

You might think this is how things always are: after all, the whole point behind my Game Scripts work is that teams with the lead pass less often, and trailing teams pass more often. But of course we already discussed that last year, the reverse was true: the right teams passed more often. In fact, there isn’t much of a trend in recent years as to whether or not the better passing teams are more likely or less likely to pass more often.

This final graph is a little wonky, but here goes. It shows the league average ANY/A in each season calculated the normal way minus the average of the ANY/A for all of the teams. So in 2019, you get a negative number (6.16 – 6.19 is -0.03); in 2018, it’s positive. Any time the graph is above 0, it means that the right teams are passing more often. Any time it’s below zero — as in 2019 — it means the wrong teams are passing more often.

What do you think?

{ 0 comments }

On Monday, I looked at the top passers in 2019 after adjusting for strength of schedule. The same process and methodology is used to rank the defenses, so let’s look at that today. And while they had an easy schedule, there’s no denying that the 2019 Patriots had — by a good measure — the best pass defense in the NFL. Quarterbacks throwing against New England gained just 3.41 Adjusted Net Yards per Attempt in 2019, a whopping 2.75 ANY/A better than average. And while that group was 0.31 ANY/A worse than average, it still means the Patriots pass defense was 2.44 ANY/A better than average.

The Bills actually had the easiest SOS in 2019, followed by the Dolphins, Cowboys, Jets, and then Patriots. No surprise there: the AFC East and NFC East had the six easiest opposing passing schedules in 2019. Meanwhile, the Panthers, Chargers, Texans, Cardinals, and Chies all had very difficult passing schedules. In particular, this is noteworthy for Kansas City: after adjusting for SOS, Kansas City’s pass defense ranked 3rd in the NFL in 2019. Derek Carr had his worst and third-worst games of the season against the Chiefs; Tom Brady had his second-worst game of the season against Kansas City; and Philip Rivers had two of his five worst games of the year when facing Kansas City. Lamar Jackson struggled, too: he had a rare game with no passing touchdowns against Kansas City, and averaged just 5.41 net yards per pass attempt.

The full results, below. [continue reading…]

{ 0 comments }

2019 Rearview Adjusted Net Yards per Attempt

Last week, I posted the final 2019 passing numbers; today, I am going to show those numbers after we adjust for strength of schedule, using the methodology described here. As always, an iterative process is used to adjust for strength of schedule: each quarterback’s season is adjusted for the quality of the defenses he’s faced, those defenses are adjusted for the quality of the quarterbacks they faced, and so on, until equilibrium is reached.

Carson Wentz and Sam Darnold had the two easiest schedules this year. Let’s begin with Wentz. Here’s how to read his graph, starting with his best game of the season.  In week 1, Wentz and the Eagles hosted Washington and won, 32-27.  Wentz threw 39 passes for 313 yards with 3 TDs and no interceptions, and 1 sack for no yards.  That gives him 373 Adjusted Net Yards (Passing Yards + 20 * TDs – 45 * INTs – Sack Yards Lost) on 40 DropBacks (Attempts + Sacks).  This game made up 6.2% of all dropbacks Wentz had all season.  He averaged 9.33 ANY/A in this game on 40 dropbacks; assuming the league average ANY/A of 6.16, this means Wentz produced 127 Adjusted Net Yards of Value above average.  However, Washington was a bad pass defense, finishing 0.88 ANY/A below average.  Therefore, Wentz’s actual value for this game was +91, now +127, after adjusting for strength of schedule. [continue reading…]

{ 0 comments }

Kyle Allen and Patrick Mahomes are at opposite ends of the quarterback spectrum. Allen was an undrafted free agent; Mahomes is one of the most talented quarterbacks in league history and was the 2018 NFL MVP.

Allen ranks 32nd out of 34 qualifying quarterbacks in the most basic (in a good way) of passing stats: net yards per attempt.

Mahomes ranks 1st this year in NY/A, after ranking 1st in the same stat last year among quarterbacks who started at least 8 games.  Net yards per attempt is a good stat, and Mahomes is excellent at it because he’s an excellent quarterback (or maybe vice versa).

But you know better than to expect this to be a “Mahomes good Allen bad” post. Because I did a triple take this morning when I noticed that Kyle Allen has thrown for first downs at a higher rate this season than Mahomes.  That seemed impossible, and I had to double check twice just to make sure the data wasn’t wrong.

In general, there is a significant correlation between Net Yards per Attempt (which is passing yards, net of sack yards lost, divided by pass attempts plus sacks) and Passing 1st Down Rate (which is passing first downs divided by pass attempts plus sacks).   Both of these are very good stats to measure quarterback play, and last year, Mahomes led the NFL with a 43.2% passing first down rate.   Passing 1st Down Percentage is a good quick and dirty stat, and one where the best quarterbacks tend to fare very well. It is certainly not biased against a player like Mahomes.  But this year, Mahomes ranks 13th in that metric despite still having a very good NY/A average, while Allen shockingly ranks 11th in the metric.

So we have two pretty good, and easy to calculate passing stats, that in general are very correlated.  How correlated? Take a look at the graph below, which shows the same data as the table above.  And while the logos are for teams, the data  is for individual quarterbacks, not team-level data. So the Jets logo is only Sam Darnold, not the full Jets passing stats in 2019. And for the Redskins, Titans, and Steelers, it’s Dwayne Haskins, Ryan Tannehill, and Mason Rudolph in the chart below.  The Panthers, and to a lesser extent, the Chiefs, stand out as a notable outlier: [continue reading…]

{ 33 comments }

The goal of an NFL game is to win the game. If your opponent scores 17 points, you want to score 18 points, but anything more than 18 points is unnecessary. On the other hand, if you lose a game, all of the points you scored were unnecessary: losing 17-0 counts the same as losing 17-16.

With that logic, most points in an NFL game are “wasted” or unnecessary points. The Bengals started the season 0-11, so all points scored by Cincinnati were wasted during that stretch. In the 12th game, when Cincinnati won 22-6, you could claim that 15 of the 22 points scored were wasted, too. That means 172 of the 179 points scored by the Bengals this year — or 96% — were wasted points. Said differently, Cincinnati could have scored 7 points this year, not 172, and if allocated correctly, have the same record.

For Seattle, it’s a different story. The Seahawks are 10-2 and have scored 329 points; the minimum number of points Seattle could have scored and still achieved a 10-2 record is 240 points, given how many points the team has allowed each week. That means only 27% of the Seahawks points this year have been “wasted” points:

The graph below shows all 32 teams in the NFL this season.  The X-Axis shows points per game; the Y-Axis shows the “wasted” points per game, based on the following formula:

  • In a win, all points scored after 1 point more than your opponent scored are wasted.  In a 20-17 victory, there are 2 wasted points.  In a 30-17 victory, there are 12 wasted points.
  • In a loss, all points scored are wasted points.
  • In a tie, since a tie is half a win, half of the points are wasted (i.e., you could have scored 0 points and had zero wins).

We can also look at this on a percentage basis. As you might suspect, the Bengals have wasted the highest percentage of their team’s points this year, at 96%, while the Seahawks have wasted the lowest percentage, at just 27%.

TeamPts per GameWasted Pts/GPerc
Cincinnati Bengals14.914.396%
Atlanta Falcons21.718.887%
New York Giants19.216.284%
Los Angeles Chargers20.314.973%
Detroit Lions23.317.073%
New England Patriots26.819.372%
Denver Broncos16.511.872%
Jacksonville Jaguars18.312.870%
Dallas Cowboys25.717.669%
Los Angeles Rams23.616.168%
Miami Dolphins16.711.368%
Washington Redskins14.49.868%
Cleveland Browns20.513.867%
Philadelphia Eagles22.815.266%
Tampa Bay Buccaneers28.318.465%
New York Jets17.010.964%
Arizona Cardinals21.313.563%
Baltimore Ravens33.820.862%
Carolina Panthers23.314.361%
Indianapolis Colts21.812.758%
San Francisco 49ers29.116.958%
Pittsburgh Steelers19.711.358%
Kansas City Chiefs29.015.955%
Chicago Bears18.710.053%
Minnesota Vikings26.614.153%
Buffalo Bills21.410.549%
Tennessee Titans23.011.249%
Oakland Raiders19.89.347%
Houston Texans24.410.945%
Green Bay Packers24.110.242%
New Orleans Saints24.87.831%
Seattle Seahawks27.47.427%

In its simplest terms, what we are solving for here is the fewest amount of points a team could have scored and still finished with the same record. And as it turns out, the Seahawks are historic outliers. Since 1970, the most “efficient” team at scoring was the 2016 Raiders. Oakland scored 416 points that season, and in 4 losses, scored 28, 13, 10, and 6 points for a total of 57 points. In the team’s 12 wins, the Raiders average margin of victory was only 6.67, which means only 5.67 points per game were wasted in wins, or 68 total. Overall, this means the Raiders wasted only 125 of the team’s 416 points; said differently, for the 2016 Raiders to go 12-4, given how many points they allowed in each game, the team needed to score at least 291 points. They actually scored 416, so the team only “wasted” 30% of their points. That’s the lowest of any team since 1970.

The table below shows the amount of wasted points by each team from 1970 to 2018.

RkTeamYearGWin%PtsWasted PtsWst Pts/GPerc
1OAK2016160.7504161257.830%
2RAI198290.889260839.231.9%
3TEN1999160.8133921378.634.9%
4PHI1993160.5002931066.636.2%
5PIT2004160.9383721368.536.6%
6GNB2011160.93856020512.836.6%
7IND2009160.8754161549.637%
8TAM198290.556158596.637.3%
9DAL2016160.8134211599.937.8%
10RAI1993160.6253061187.438.6%
11MIA2016160.6253631418.838.8%
12IND2006160.75042716710.439.1%
13CAR2015160.93850019712.339.4%
14HOU1978160.6252831127.039.6%
15TAM2005160.6883001197.439.7%
16DAL2018160.6253391358.439.8%
17SFO1990160.8753531418.839.9%
18CAR2003160.6883251308.140%
19IND2012160.6883571459.140.6%
20PIT2017160.81340616510.340.6%
21STL198290.556135556.140.7%
22IND1999160.81342317310.840.9%
23WAS198290.889190788.741.1%
24CHI1971140.429185765.441.1%
25CIN2003160.5003461438.941.3%
26NWE2013160.75044418511.641.7%
27CLE1980160.6883571499.341.7%
28LAR2018160.81352722013.841.7%
29CHI2010160.6883341408.841.9%
30STL1976140.7143091309.342.1%
31BUF1991160.81345819312.142.1%
32CLE1972140.7142681138.142.2%
33NWE2003160.8753481479.242.2%
34OAK1976140.92935014810.642.3%
35RAM1978160.7503161348.442.4%
36NYJ2013160.5002901237.742.4%
37ATL2010160.81341417611.042.5%
38BAL2010160.7503571529.542.6%
39KAN2016160.75038916610.442.7%
40CIN1981160.75042118011.342.8%
41ATL2017160.6253531519.442.8%
42DEN2015160.7503551529.542.8%
43ATL2004160.6883401469.142.9%
44ARI1996160.4383001298.143%
45HOU2016160.5632791207.543%
46HOU1979160.6883621569.843.1%
47CAR2017160.6883631579.843.3%
48MIA198290.778198869.643.4%
49SDG1987150.5332531107.343.5%
50NOR2009160.81351022313.943.7%
51NYG1994160.5632791227.643.7%
52OAK1974140.85735515611.143.9%
53DEN1985160.68838016810.544.2%
54OAK1980160.68836416110.144.2%
55JAX2005160.75036116010.044.3%
56DAL2007160.81345520212.644.4%
57DEN1986160.68837816810.544.4%
58GNB1989160.62536216110.144.5%
59RAI1984160.68836816410.344.6%
60PIT198290.6672049110.144.6%
61NYJ2010160.68836716410.344.7%
62ATL1998160.87544219812.444.8%
63NYG2016160.6883101398.744.8%
64GNB1970140.429196886.344.9%
65SDG2006160.87549222113.844.9%
66PIT2014160.68843619612.345%
67CLE2007160.62540218111.345%
68PHI2017160.81345720612.945.1%
69DET2016160.5633461569.845.1%
70MIA1985160.75042819312.145.1%
71DEN1996160.81339117711.145.3%
72ATL2012160.81341919011.945.3%
73DAL2014160.75046721213.345.4%
74NYG1986160.87537116910.645.6%
75DEN1998160.87550122914.345.7%
76DET2014160.6883211479.245.8%
77PHI1995160.6253181469.145.9%
78OAK1970140.6433001389.946%
79PHI2010160.62543920212.646%
80NOR2018160.81350423214.546%
81.5DAL2005160.5633251509.446.2%
81.5JAX1996160.5633251509.446.2%
83IND1995160.5633311539.646.2%
84STL1975140.78635616511.846.3%
85NYG1997160.656307142.58.946.4%
86ARI2014160.6883101449.046.5%
87PIT1997160.68837217310.846.5%
88MIA2005160.5633181489.346.5%
89SFO1970140.75035216411.746.6%
90KAN1986160.62535816710.446.6%
91.5ATL1978160.5632401127.046.7%
91.5STL1974140.7142851339.546.7%
93WAS1986160.75036817210.846.7%
94SFO1981160.81335716710.446.8%
95BAL1977140.7142951389.946.8%
96DAL1991160.68834216010.046.8%
97ATL2008160.68839118311.446.8%
98MIN2000160.68839718611.646.9%
99NYG2002160.6253201509.446.9%
100NYJ1986160.62536417110.747%
101NWE2011160.81351324115.147%
102SDG1994160.68838117911.247%
103GNB2002160.75039818711.747%
104CLE1971140.6432851349.647%
105CLE1986160.75039118411.547.1%
106NYG1970140.64330114210.147.2%
107SEA1988160.56333916010.047.2%
108WAS2012160.62543620612.947.2%
109SFO1989160.87544220913.147.3%
110DET1993160.6252981418.847.3%
111PHI2003160.75037417711.147.3%
112SFO2002160.62536717410.947.4%
113WAS1977140.643196936.647.4%
114RAI1990160.75033716010.047.5%
115DEN1991160.7503041459.147.7%
116BUF1995160.62535016710.447.7%
117STL2000160.62554025816.147.8%
119CIN2001160.3752261086.847.8%
119DET1991160.75033916210.147.8%
119PHI1979160.68833916210.147.8%
121TEN2006160.5003241559.747.8%
122NOR1987150.80042220213.547.9%
123STL2003160.75044721413.447.9%
124DEN1984160.81335316910.647.9%
125LAC2018160.75042820512.847.9%
126WAS2008160.5002651277.947.9%
127GNB1995160.68840419412.148%
128GNB1972140.71430414610.448%
129CAR2008160.75041419912.448.1%
130NOR2002160.56343220813.048.1%
131SDG2014160.56334816810.548.3%
132GNB1997160.81342220412.848.3%
133TAM1997160.6252991459.148.5%
134DEN2013160.81360629418.448.5%
135PHI1988160.62537918411.548.5%
136KAN1980160.5003191559.748.6%
137RAM1989160.68842620712.948.6%
138ARI1998160.5633251589.948.6%
139NYJ2001160.6253081509.448.7%
140IND2008160.75037718411.548.8%
141MIN1987150.53333616410.948.8%
142NWE2010160.87551825315.848.8%
143RAI1994160.5633031489.348.8%
144PIT2009160.56336818011.348.9%
145DEN2008160.50037018111.348.9%
146MIN1998160.93855627217.048.9%
147IND2003160.75044721913.749%
148BUF1998160.62540019612.349%
149OAK1977140.78635117212.349%
150DET1994160.56335717510.949%
151ATL1991160.62536117711.149%
152BUF1973140.6432591279.149%
153TEN2002160.68836718011.349%
154DAL1979160.68837118211.449.1%
155ATL1980160.75040519912.449.1%
156KAN1995160.81335817611.049.2%
157MIN2017160.81338218811.849.2%
158JAX1998160.68839219312.149.2%
159BUF1974140.6432641309.349.2%
160ATL2016160.68854026616.649.3%
161SEA1978160.56334517010.649.3%
162SDG2009160.81345422414.049.3%
163KAN1993160.68832816210.149.4%
164SEA2016160.65635417510.949.4%
165NWE1978160.68835817711.149.4%
166IND1990160.4382811398.749.5%
167JAX1997160.68839419512.249.5%
168TEN2007160.6253011499.349.5%
169NYG1990160.81333516610.449.6%
170WAS1987150.73337918812.549.6%
171CIN1986160.62540920312.749.6%
172MIA2001160.68834417110.749.7%
173NWE1996160.68841820813.049.8%
174NYJ1974140.5002791399.949.8%
175WAS1985160.6252971489.349.8%
176SEA2001160.5633011509.449.8%
177IND2015160.50033316610.449.8%
178MIA2008160.68834517210.849.9%
179JAX2010160.50035317611.049.9%
180DAL1981160.75036718311.449.9%
182.5HOU2012160.75041620813.050%
182.5ATL2011160.62540220112.650%
182.5RAI1985160.75035417711.150%
182.5BAL1983160.4382641328.350%
185SEA1983160.56340320212.650.1%
186DAL1977140.85734517312.450.1%
187MIN1996160.5632981509.450.3%
188JAX2009160.4382901469.150.3%
189MIA1994160.62538919612.350.4%
190BUF1988160.75032916610.450.5%
191NYJ2000160.56332116210.150.5%
192ARI2001160.4382951499.350.5%
193SEA1979160.56337819111.950.5%
194PIT1977140.64328314310.250.5%
195OAK1981160.4382731388.650.5%
196PHI2009160.68842921713.650.6%
197NYG2008160.75042721613.550.6%
198KAN2017160.62541521013.150.6%
199GNB2014160.75048624615.450.6%
200DEN2014160.75048224415.350.6%
201BAL1970140.821321162.511.650.6%
202WAS1983160.87554127417.150.6%
203KAN1997160.81337519011.950.7%
204ARI2015160.81348924815.550.7%
205KAN2006160.56333116810.550.8%
206NWE2007161.00058929918.750.8%
207NWE2016160.87544122414.050.8%
208PIT1978160.87535618111.350.8%
209PIT1995160.68840720712.950.9%
210MIN1999160.62539920312.750.9%
211BUF1983160.5002831449.050.9%
212DAL1983160.75047924415.350.9%
213JAX2004160.5632611338.351%
214MIN2015160.68836518611.651%
215HOU2018160.68840220512.851%
216OAK1971140.643344175.512.551%
217PIT2002160.65639019912.451%
218WAS2015160.56338819812.451%
219GNB1983160.50042921913.751%
220BUF1993160.75032916810.551.1%
221MIN1977140.6432311188.451.1%
222DAL1972140.71431916311.651.1%
223CIN1988160.75044822914.351.1%
224DEN2000160.68848524815.551.1%
225RAM1984160.62534617711.151.2%
226.5SFO1997160.81337519212.051.2%
226.5OAK1975140.78637519213.751.2%
228TEN2003160.75043522313.951.3%
229PHI2004160.81338619812.451.3%
230BAL2011160.75037819412.151.3%
231PHI1971140.464221113.58.151.4%
232NWE1985160.68836218611.651.4%
233SDG1995160.56332116510.351.4%
234MIN1994160.62535618311.451.4%
235MIN1997160.56335418211.451.4%
236MIN1976140.82130515711.251.5%
237TEN2017160.56333417210.851.5%
238NYG2011160.56339420312.751.5%
239BUF1980160.68832016510.351.6%
240MIN2005160.5633061589.951.6%
241NWE2004160.87543722614.151.7%
242SDG198290.66728814916.651.7%
243CLE2002160.56334417811.151.7%
244CIN1973140.71428614810.651.7%
245CIN2009160.6253051589.951.8%
246BUF1979160.4382681398.751.9%
247MIN198290.5561879710.851.9%
248TAM2010160.62534117711.151.9%
249MIA1972141.00038520014.351.9%
250SFO2013160.75040621113.252%
251NOR2004160.50034818111.352%
252CHI2001160.81333817611.052.1%
253DET1985160.43830716010.052.1%
254NWE1976140.78637619614.052.1%
255.5PIT2016160.68839920813.052.1%
255.5OAK2001160.62539920813.052.1%
257SDG2004160.75044623314.652.2%
258KAN2003160.81348425315.852.3%
259MIA1974140.78632717112.252.3%
260BUF2017160.5633021589.952.3%
261DET1974140.5002561349.652.3%
262KAN2018160.75056529618.552.4%
263DEN2011160.50030916210.152.4%
264SEA2005160.81345223714.852.4%
265MIA1999160.56332617110.752.5%
266MIA1981160.71934518111.352.5%
267.5MIN2012160.62537919912.452.5%
267.5MIN2008160.62537919912.452.5%
269NYJ1979160.50033717711.152.5%
270ARI2011160.50031216410.352.6%
271NOR1994160.43834818311.452.6%
272RAM1985160.68834017911.252.6%
273MIN1980160.56331716710.452.7%
274DAL1976140.78629615611.152.7%
275GNB2015160.62536819412.152.7%
276CIN2014160.656365192.512.052.7%
277CIN2013160.68843022714.252.8%
278TEN2008160.81337519812.452.8%
279CHI1987150.73335618812.552.8%
280PHI1987150.46733717811.952.8%
281CHI1991160.6882991589.952.8%
282IND2005160.87543923214.552.8%
283GNB2007160.81343523014.452.9%
284IND2007160.81345023814.952.9%
285SDG1996160.50031016410.352.9%
286CLE1979160.56335919011.952.9%
287.5SFO2014160.50030616210.152.9%
287.5IND2013160.68839120712.952.9%
289CLE1988160.62530416110.153%
290.5DEN1983160.56330216010.053%
290.5KAN1971140.75030216011.453%
292GNB2013160.53141722113.853%
293MIA1980160.5002661418.853%
294TEN2016160.56338120212.653%
295IND1988160.56335418811.853.1%
296NWE1998160.56333717911.253.1%
297SFO1988160.62536919612.353.1%
298PIT2001160.81335218711.753.1%
299DAL1975140.71435018613.353.1%
300WAS2016160.531396210.513.253.2%
301SFO2011160.81338020212.653.2%
302NYJ2006160.62531616810.553.2%
303RAI1983160.75044223514.753.2%
304CIN2011160.56334418311.453.2%
305PHI1989160.68834218211.453.2%
306RAI1986160.50032317210.853.3%
307BAL2006160.81335318811.853.3%
308SFO1984160.93847525315.853.3%
309NWE1994160.62535118711.753.3%
310.5MIA2013160.50031716910.653.3%
310.5IND1996160.56331716910.653.3%
312.5HOU1987150.60034518412.353.3%
312.5CHI1977140.6432551369.753.3%
314.5NOR2000160.62535418911.853.4%
314.5HOU1974140.5002361269.053.4%
316NYG1980160.2502491338.353.4%
317SEA2006160.56333517911.253.4%
318SFO1998160.75047925616.053.4%
319CIN198290.77823212413.853.4%
320ARI2007160.50040421613.553.5%
321MIA1992160.68834018211.453.5%
322.5SDG2013160.56339621213.353.5%
322.5KAN1996160.5632971599.953.5%
324.5NWE2015160.75046524915.653.5%
324.5DEN1980160.50031016610.453.5%
326IND2010160.62543523314.653.6%
327HOU1975140.71429315711.253.6%
328BUF1996160.62531917110.753.6%
329NOR2010160.68838420612.953.6%
330ATL2015160.50033918211.453.7%
331CIN2015160.75041922514.153.7%
332CHI2000160.3132161167.353.7%
333SEA1995160.50036319512.253.7%
334NOR2011160.81354729418.453.7%
335CIN1975140.78634018313.153.8%
336NYJ2008160.56340521813.653.8%
337.5GNB2001160.75039021013.153.8%
337.5PIT1992160.68829916110.153.8%
339ARI2009160.62537520212.653.9%
340MIA1990160.75033618111.353.9%
341SFO2007160.3132191187.453.9%
342CLE1978160.50033418011.353.9%
343HOU1980160.6882951599.953.9%
344DEN2005160.81339521313.353.9%
345PHI2014160.62547425616.054%
346CIN1996160.50037220112.654%
347MIN1979160.4382591408.854.1%
348NWE2002160.56338120612.954.1%
349PHI2000160.68835119011.954.1%
350.5GNB2016160.62543223414.654.2%
350.5GNB1998160.68840822113.854.2%
352SFO1987150.86745924916.654.2%
353PHI1996160.62536319712.354.3%
354GNB2012160.68843323514.754.3%
355MIA1997160.56333918411.554.3%
356OAK1978160.56331116910.654.3%
357GNB1992160.5632761509.454.3%
358PHI1991160.6252851559.754.4%
359CIN2005160.68842122914.354.4%
360STL2001160.87550327417.154.5%
361HOU1989160.56336519912.454.5%
362PHI2013160.62544224115.154.5%
363CHI2006160.81342723314.654.6%
364ARI2017160.50029516110.154.6%
365MIA1984160.87551328017.554.6%
366GNB1976140.3572181198.554.6%
367CHI2013160.50044524315.254.6%
368IND1992160.5632161187.454.6%
369DEN1979160.6252891589.954.7%
370NWE2017160.81345825115.754.8%
371NOR1983160.50031917510.954.9%
372OAK2015160.43835919712.354.9%
373CHI1990160.68834819111.954.9%
374RAM1980160.68842423314.655%
375ATL1995160.56336219912.455%
376STL2015160.4382801549.655%
377DET1972140.607339186.513.355%
378KAN1972140.57128715811.355.1%
379.5STL2002160.43831617410.955.1%
379.5BAL2002160.43831617410.955.1%
381MIN1973140.85729616311.655.1%
382CLE1989160.59433418411.555.1%
383CHI1986160.87535219412.155.1%
384.5MIA2018160.43831917611.055.2%
384.5CIN2017160.43829016010.055.2%
386CAR2013160.75036620212.655.2%
387BUF1981160.62531117210.855.3%
388WAS1978160.5002731519.455.3%
389DAL1994160.75041422914.355.3%
390DAL2012160.50037620813.055.3%
391BUF1992160.68838121113.255.4%
392DAL1995160.75043524115.155.4%
393OAK2011160.50035919912.455.4%
394SFO1992160.87543123914.955.5%
395CHI2008160.56337520813.055.5%
396DEN1977140.85727415210.955.5%
397NWE2018160.68843624215.155.5%
398NWE2001160.68837120612.955.5%
399.5NWE2014160.75046826016.355.6%
399.5CLE1973140.5712341309.355.6%
401BUF1990160.81342823814.955.6%
402STL1983160.53137420813.055.6%
403GNB2017160.43832017811.155.6%
404SFO1994160.81350528117.655.6%
405NOR2016160.43846926116.355.7%
406WAS1976140.71429116211.655.7%
407BUF2002160.50037921113.255.7%
408PIT2011160.75032518111.355.7%
409ATL1986160.4692801569.855.7%
410DEN2012160.81348126816.855.7%
411.5IND2004160.75052229118.255.7%
411.5NYG1989160.75034819412.155.7%
413DEN1981160.62532117911.255.8%
414BAL2012160.62539822213.955.8%
415NYG2000160.75032818311.455.8%
416GNB1978160.5312491398.755.8%
417GNB1981160.50032418111.355.9%
418BUF2000160.50031517611.055.9%
419IND2002160.62534919512.255.9%
420GNB2004160.62542423714.855.9%
421PIT1974140.750305170.512.255.9%
422DET2011160.62547426516.655.9%
423PIT1983160.62535519912.456.1%
424DEN1987150.700379212.514.256.1%
425KAN1988160.281254142.58.956.1%
426NOR2015160.43840822914.356.1%
427NYG1984160.56329916810.556.2%
428DEN1973140.57135419914.256.2%
429WAS1972140.78633618913.556.3%
430NOR2013160.68841423314.656.3%
431WAS1975140.57132518313.156.3%
432BAL1976140.78641723516.856.4%
433KAN1984160.50031417711.156.4%
434MIN2009160.75047026516.656.4%
435DAL2003160.62528916310.256.4%
436SDG2002160.50033318811.856.5%
437NOR2017160.68844825315.856.5%
438DAL1992160.81340923114.456.5%
439NYG1975140.3572161228.756.5%
440SFO1996160.75039822514.156.5%
441SEA2018160.62542824215.156.5%
442CLE1976140.64326715110.856.6%
443OAK1972140.750365206.514.856.6%
444DAL1985160.62535720212.656.6%
445NYJ2015160.62538721913.756.6%
446NYG1993160.68828816310.256.6%
447NWE2006160.75038521813.656.6%
448NWE1984160.56336220512.856.6%
449.5CAR2006160.5002701539.656.7%
449.5TAM1999160.6882701539.656.7%
451IND1994160.50030717410.956.7%
452WAS1971140.679276156.511.256.7%
453KAN1994160.56331918111.356.7%
454NYJ2004160.62533318911.856.8%
455WAS1981160.50034719712.356.8%
456TAM2008160.56336120512.856.8%
457SEA1999160.56333819212.056.8%
458.5NYJ1999160.50030817510.956.8%
458.5DAL1984160.56330817510.956.8%
460DET1999160.50032218311.456.8%
461CHI1995160.56339222313.956.9%
462OAK2002160.68845025616.056.9%
463DAL1990160.4382441398.757%
464NOR1992160.75033018811.857%
465ARI2013160.62537921613.557%
466NYG1971140.2862281309.357%
467JAX1999160.87539622614.157.1%
468NYG2005160.68842224115.157.1%
469GNB2006160.50030117210.857.1%
470KAN1990160.68836921113.257.2%
471TEN2000160.81334619812.457.2%
472MIN1981160.43832518611.657.2%
473WAS1989160.62538622113.857.3%
474SEA1989160.4382411388.657.3%
475MIN1983160.50031618111.357.3%
476PHI1990160.62539622714.257.3%
477DAL1987150.46734019513.057.4%
478PIT1989160.5632651529.557.4%
479OAK2009160.3131971137.157.4%
480PIT2015160.62542324315.257.4%
481KAN1991160.62532218511.657.5%
482RAM1973140.85738822315.957.5%
483PHI2018160.56336721113.257.5%
484PHI2006160.62539822914.357.5%
485PIT1987150.53328516410.957.5%
486OAK2000160.75047927617.357.6%
487SFO1983160.62543224915.657.6%
488HOU1996160.50034519912.457.7%
489NOR1988160.62531218011.357.7%
490SFO2001160.75040923614.857.7%
491.5CIN1997160.43835520512.857.7%
491.5HOU1985160.31328416410.357.7%
493WAS1979160.62534820112.657.8%
494STL2006160.50036721213.357.8%
495MIN2004160.50040523414.657.8%
496CIN1980160.3752441418.857.8%
497RAM1974140.71426315210.957.8%
498OAK2017160.37530117410.957.8%
499NWE1991160.3752111227.657.8%
500CLE2014160.43829917310.857.9%
501KAN1989160.53131818411.557.9%
502MIA2003160.62531118011.357.9%
503CIN2018160.37536821313.357.9%
504CLE2001160.43828516510.357.9%
505PHI1992160.68835420512.857.9%
506SDG1992160.68833519412.157.9%
507PIT1994160.75031618311.457.9%
508NYG1988160.62535920813.057.9%
509WAS1997160.531327189.511.858%
510TAM1990160.3752641539.658%
511DEN2016160.56333319312.158%
512STL2004160.50031918511.658%
513NYG1991160.50028116310.258%
514DAL2008160.56336221013.158%
515DET1995160.62543625315.858%
516GNB2000160.56335320512.858.1%
517MIA1983160.75038922614.158.1%
518DEN1974140.536302175.512.558.1%
519CHI198290.333141829.158.2%
520TEN1998160.50033019212.058.2%
521WAS2001160.5002561499.358.2%
522BAL1975140.71439523016.458.2%
523MIA1970140.71429717312.458.2%
524SEA2013160.81341724315.258.3%
525PIT2018160.594428249.515.658.3%
526DET2000160.56330717911.258.3%
527NWE2005160.62537922113.858.3%
528CAR2005160.68839122814.358.3%
529KAN2005160.62540323514.758.3%
530CHI2011160.50035320612.958.4%
531ARI1999160.3752451438.958.4%
532DAL1980160.75045426516.658.4%
533MIN1974140.71431018112.958.4%
534ATL1971140.53627416011.458.4%
535DEN1992160.5002621539.658.4%
536CIN1977140.5712381399.958.4%
537PHO1988160.43834420112.658.4%
538TEN2011160.56332519011.958.5%
539TEN2012160.37533019312.158.5%
540KAN2011160.4382121247.858.5%
541PIT2008160.75034720312.758.5%
542HOU2009160.56338822714.258.5%
543BUF1994160.43834019912.458.5%
544STL1995160.43830918111.358.6%
545CAR1996160.75036721513.458.6%
546STL1984160.56342324815.558.6%
547DET2015160.43835821013.158.7%
548SFO2012160.71939723314.658.7%
549ARI1994160.5002351388.658.7%
550NYJ1988160.531372218.513.758.7%
551MIA1993160.56334920512.858.7%
552IND2000160.62542925215.858.7%
553SEA1986160.62536621513.458.7%
554SEA2004160.56337121813.658.8%
555ATL2001160.43829117110.758.8%
556CAR2007160.4382671579.858.8%
557HOU1991160.68838622714.258.8%
558SDG1980160.68841824615.458.9%
559NOR2001160.43833319612.358.9%
560SEA1997160.50036521513.458.9%
561WAS1999160.62544326116.358.9%
562.5BUF2008160.43833619812.458.9%
562.5DEN2002160.56339223114.458.9%
564CHI2012160.62537522113.858.9%
565LAR2017160.68847828217.659%
566RAM1983160.56336121313.359%
567OAK1998160.50028817010.659%
568DEN1975140.42925415010.759.1%
569BAL2001160.62530317911.259.1%
570CIN2012160.62539123114.459.1%
571PHI1985160.43828616910.659.1%
572DAL1971140.78640624017.159.1%
573IND2018160.62543325616.059.1%
574CHI2018160.75042124915.659.1%
575ATL1983160.43837021913.759.2%
576KAN1992160.62534820612.959.2%
577NWE2012160.75055733020.659.2%
578MIN1989160.62535120813.059.3%
579NWE2008160.68841024315.259.3%
580GNB198290.61122613414.959.3%
581TAM2016160.56335421013.159.3%
582TAM1979160.62527316210.159.3%
583TEN2018160.56331018411.559.4%
584PIT1980160.56335220913.159.4%
585PHI2015160.43837722414.059.4%
586WAS1988160.43834520512.859.4%
587SEA2002160.43835521113.259.4%
588NWE198290.556143859.459.4%
589SEA1990160.56330618211.459.5%
590.5BUF2007160.4382521509.459.5%
590.5BUF1975140.57142025017.959.5%
592DET1971140.53634120314.559.5%
593KAN2010160.62536621813.659.6%
594MIN2018160.531360214.513.459.6%
595MIA1996160.50033920212.659.6%
596TEN2009160.50035421113.259.6%
597.5CHI2005160.6882601559.759.6%
597.5PIT1979160.75041624815.559.6%
599SDG1981160.62547828517.859.6%
600SFO1986160.65637422313.959.6%
601CHI2009160.43832719512.259.6%
602SFO1980160.37532019111.959.7%
603CIN1990160.56336021513.459.7%
604TAM1996160.3752211328.359.7%
605SDG1988160.3752311388.659.7%
606DET2013160.43839523614.859.7%
607DAL1996160.62528617110.759.8%
608MIN1972140.50030118012.959.8%
609TEN2001160.43833620112.659.8%
610IND2014160.68845827417.159.8%
611.5DEN2004160.62538122814.359.8%
611.5DEN2003160.62538122814.359.8%
613NWE1999160.50029917911.259.9%
614NYJ2002160.56335921513.459.9%
615CIN2004160.50037422414.059.9%
616SDG1974140.3572121279.159.9%
617CLE1985160.50028717210.859.9%
618STL1987150.46736221714.559.9%
619SDG1985160.50046728017.560%
620BAL2013160.50032019212.060%
621NYG2007160.62537322414.060.1%
622SDG1983160.37535821513.460.1%
623NWE1971140.42923814310.260.1%
624WAS1984160.68842625616.060.1%
625DAL1993160.75037622614.160.1%
626KAN1970140.571272163.511.760.1%
627MIN1991160.50030118111.360.1%
628NYG2012160.56342925816.160.1%
629GNB1990160.37527116310.260.1%
630MIN1992160.68837422514.160.2%
631WAS2005160.62535921613.560.2%
632SEA1985160.50034921013.160.2%
633TAM2001160.56332419512.260.2%
634DEN1989160.68836221813.660.2%
635.5SEA1996160.43831719111.960.3%
635.5NOR1993160.50031719111.960.3%
637.5DEN2001160.50034020512.860.3%
637.5STL1977140.50027216411.760.3%
639BUF1999160.68832019312.160.3%
640NWE1980160.62544126616.660.3%
641MIA2000160.68832319512.260.4%
642RAM1971140.60731318913.560.4%
643DAL2009160.68836121813.660.4%
644STL1985160.31327816810.560.4%
645NYJ1987150.40033420213.560.5%
646GNB1999160.50035721613.560.5%
647NYJ1991160.50031419011.960.5%
648STL2012160.46929918111.360.5%
649NYJ1998160.75041625215.860.6%
650JAX2007160.68841124915.660.6%
651DEN2007160.43832019412.160.6%
652WAS1990160.62538123114.460.6%
653MIN2006160.37528217110.760.6%
654ATL1979160.37530018211.460.7%
655NWE1986160.68841225015.660.7%
656RAM1979160.56332319612.360.7%
657KAN2015160.68840524615.460.7%
658KAN1999160.56339023714.860.8%
659CAR2012160.43835721713.660.8%
660WAS1991160.87548529518.460.8%
661NYJ1984160.43833220212.660.8%
662BAL2004160.56331719312.160.9%
663CAR2018160.43837622914.360.9%
664SEA2014160.75039424015.060.9%
665SEA1987150.60037122615.160.9%
666HOU2008160.50036622313.960.9%
667MIA1973140.85734320914.960.9%
668.5SDG2005160.56341825515.961%
668.5SEA1984160.75041825515.961%
670PIT2010160.75037522914.361.1%
671NYJ1985160.68839324015.061.1%
672KAN2004160.43848329518.461.1%
673NYJ2016160.31327516810.561.1%
674OAK1979160.56336522313.961.1%
675MIA2009160.43836022013.861.1%
676RAM1986160.62530918911.861.2%
677NWE1988160.5632501539.661.2%
678SEA2017160.56336622414.061.2%
679MIN1978160.53129418011.361.2%
680MIN2014160.43832519912.461.2%
681NOR2006160.62541325315.861.3%
682RAI1989160.50031519312.161.3%
683NYJ1978160.50035922013.861.3%
684SFO1971140.64330018413.161.3%
685.5BAL1998160.37526916510.361.3%
685.5ATL1972140.50026916511.861.3%
687TAM2000160.62538823814.961.3%
688MIA1975140.71435721915.661.3%
689WAS2007160.56333420512.861.4%
690MIN1995160.50041225315.861.4%
691NYJ1981160.65635521813.661.4%
692DAL2004160.37529318011.361.4%
693SDG1993160.50032219812.461.5%
694CLE1993160.43830418711.761.5%
695PHI2001160.68834321113.261.5%
696IND2016160.50041125315.861.6%
697BUF1997160.3752551579.861.6%
698CHI1985160.93845628117.661.6%
699CHI1994160.56327116710.461.6%
700NYJ1983160.43831319312.161.7%
701SDG1978160.56335521913.761.7%
702RAM1981160.37530318711.761.7%
703ATL198290.55618311312.661.7%
704TAM1994160.3752511559.761.8%
705.5TAM1995160.4382381479.261.8%
705.5CLE1992160.43827216810.561.8%
707PHI1973140.393310191.513.761.8%
708HOU1988160.62542426216.461.8%
709KAN1974140.35723314410.361.8%
710MIN1975140.85737723316.661.8%
711GNB2018160.406376232.514.561.8%
712SDG1970140.464282174.512.561.9%
713MIA2017160.37528117410.961.9%
714SFO2017160.37533120512.861.9%
715DET2017160.56341025415.962%
716ATL2006160.43829218111.362%
717CAR1999160.50042126116.362%
718NOR1997160.3752371479.262%
719DET1978160.43829018011.362.1%
720WAS1996160.56336422614.162.1%
721CIN1976140.71433520814.962.1%
722KAN2013160.68843026716.762.1%
723.5BUF1987150.46727016811.262.2%
723.5TAM1981160.56331519612.362.2%
725NWE1995160.37529418311.462.2%
726WAS1995160.37532620312.762.3%
727HOU1981160.43828117510.962.3%
728STL2010160.43828918011.362.3%
729DEN1997160.75047229418.462.3%
730ARI2008160.56342726616.662.3%
731OAK1999160.50039024315.262.3%
732NWE1997160.62536923014.462.3%
733IND1987150.60030018712.562.3%
734BAL2008160.68838524015.062.3%
735NYJ1997160.56334821713.662.4%
736SFO1995160.68845728517.862.4%
737NOR1990160.50027417110.762.4%
738SDG1999160.50026916810.562.5%
739BAL2000160.75033320813.062.5%
741HOU1992160.62535222013.862.5%
741DET1989160.43831219512.262.5%
741SDG1976140.42924815511.162.5%
743.5CAR2009160.50031519712.362.5%
743.5STL1981160.43831519712.362.5%
745CHI2007160.43833420913.162.6%
746GNB1985160.50033721113.262.6%
747PIT1972140.78634321515.462.7%
748TAM1984160.37533521013.162.7%
749NYG2010160.62539424715.462.7%
750NYG1998160.50028718011.362.7%
751MIA1979160.62534121413.462.8%
752CLE2018160.469359225.514.162.8%
753CIN1984160.50033921313.362.8%
754OAK1973140.679292183.513.162.8%
755.5DET1975140.50024515411.062.9%
755.5MIA1971140.75031519814.162.9%
757CLE1983160.56335622414.062.9%
758NOR1989160.56338624315.263%
759BUF2014160.56334321613.563%
760MIN2003160.56341626216.463%
761WAS2000160.50028117711.163%
762MIN2016160.50032720612.963%
763MIA2010160.43827317210.863%
764HOU1993160.75036823214.563%
765.5PIT2012160.50033621213.363.1%
765.5PHI2007160.50033621213.363.1%
767SEA2012160.68841226016.363.1%
768OAK2004160.31332020212.663.1%
769PHI2002160.75041526216.463.1%
770DAL2002160.3132171378.663.1%
771CHI1988160.75031219712.363.1%
772BAL2003160.62539124715.463.2%
773NYG1999160.43829918911.863.2%
774PIT2005160.68838924615.463.2%
775RAM1976140.75035122215.963.2%
776SDG1979160.75041126016.363.3%
777KAN1981160.56334321713.663.3%
778PIT1984160.56338724515.363.3%
779MIA1988160.37531920212.663.3%
780NOR2014160.43840125415.963.3%
781KAN2000160.43835522514.163.4%
782PIT1973140.71434722015.763.4%
783RAI1991160.56329818911.863.4%
784ATL2002160.59440225515.963.4%
785MIA1989160.50033121013.163.4%
786PIT1998160.43826316710.463.5%
787DEN1993160.56337323714.863.5%
788DAL1978160.75038424415.363.5%
789NOR198290.444129829.163.6%
790MIN1970140.85733521315.263.6%
791MIN2002160.37539024815.563.6%
792PHI1999160.31327217310.863.6%
793CHI1981160.37525316110.163.6%
794NYJ1971140.4292121359.663.7%
795NYG2009160.50040225616.063.7%
796MIN2010160.37528117911.263.7%
797SFO2008160.43833921613.563.7%
798CIN1985160.43844128117.663.7%
799KAN2014160.56335322514.163.7%
800ATL1997160.43832020412.863.8%
801BAL2018160.62538924815.563.8%
802NOR1984160.43829819011.963.8%
803ATL2018160.43841426416.563.8%
804KAN1976140.35729018513.263.8%
805CHI1975140.2861911228.763.9%
806BAL1999160.50032420712.963.9%
807CIN1995160.43834922313.963.9%
808MIN1993160.56327717711.163.9%
809NOR1971140.35726617012.163.9%
810BAL1980160.43835522714.263.9%
811DAL2011160.50036923614.864%
812CHI1999160.37527217410.964%
813DAL1974140.57129719013.664%
814SDG2012160.43835022414.064%
815BAL1978160.3132391539.664%
816PHI1997160.40631720312.764%
817SDG2011160.50040626016.364%
818BUF2004160.56339525315.864.1%
819CHI1979160.62530619612.364.1%
820TAM1989160.31332020512.864.1%
821PIT1975140.85737323917.164.1%
822SFO2006160.43829819111.964.1%
823PIT2013160.50037924315.264.1%
824MIN1985160.43834622213.964.2%
825CAR2000160.43831019912.464.2%
826SDG2008160.50043928217.664.2%
827HOU2014160.56337223914.964.2%
828SDG1998160.3132411559.764.3%
829.5CAR2002160.43825816610.464.3%
829.5PHO1989160.31325816610.464.3%
831MIA1987150.53336223315.564.4%
832WAS1974140.71432020614.764.4%
833SDG1977140.50022214310.264.4%
834DAL2013160.50043928317.764.5%
835MIN1971140.78624515811.364.5%
836WAS2002160.43830719812.464.5%
837STL1978160.37524816010.064.5%
838TAM2012160.43838925115.764.5%
839CHI1993160.4382341519.464.5%
840MIA1977140.71431320214.464.5%
841SEA2003160.62540426116.364.6%
842PIT1993160.56330819912.464.6%
843SEA2007160.62539325415.964.6%
844.5DET2007160.43834622414.064.7%
844.5TAM2002160.75034622414.064.7%
846NOR1978160.43828118211.464.8%
847NYG2006160.50035523014.464.8%
848PHI1978160.56327017510.964.8%
849OAK2018160.25029018811.864.8%
850RAM1992160.37531320312.764.9%
851SFO1991160.62539325515.964.9%
852SFO1993160.62547330719.264.9%
853HOU2007160.50037924615.464.9%
854RAM1970140.67932521115.164.9%
855GNB1977140.286134876.264.9%
856MIN2007160.50036523714.864.9%
857STL2013160.43834822614.164.9%
858NYG1972140.57133121515.465%
859ATL2005160.50035122814.365%
860NYG2001160.43829419111.965%
861KAN1985160.37531720612.965%
862.5KAN2001160.37532020813.065%
862.5CLE1994160.68834022113.865%
864CIN1999160.25028318411.565%
865BAL1997160.40632621213.365%
866MIA1998160.62532120913.165.1%
867NYJ1972140.50036723917.165.1%
868KAN1998160.43832721313.365.1%
869NYJ1994160.37526417210.865.2%
870GNB2003160.62544228818.065.2%
871BUF1972140.321257167.512.065.2%
872.5DEN2006160.56331920813.065.2%
872.5NOR1995160.43831920813.065.2%
874STL1973140.321286186.513.365.2%
875CLE1981160.31327618011.365.2%
876NOR2008160.50046330218.965.2%
877ATL2007160.25025916910.665.3%
878BAL2016160.50034322414.065.3%
879NYG2018160.31336924115.165.3%
880CAR2004160.43835523214.565.4%
881PHI1980160.75038425115.765.4%
882CHI2004160.3132311519.465.4%
883CHI2003160.43828318511.665.4%
884CLE1970140.50028618713.465.4%
885ARI2010160.31328918911.865.4%
886MIN2013160.34439125616.065.5%
887DAL2010160.37539425816.165.5%
888PHI2005160.37531020312.765.5%
889TAM2015160.37534222414.065.5%
890MIN2001160.31329019011.965.5%
891JAX2013160.25024716210.165.6%
892DEN1978160.62528218511.665.6%
893NYJ1989160.25025316610.465.6%
894PHI1984160.406278182.511.465.6%
895NWE1989160.31329719512.265.7%
896CIN1970140.57131220514.665.7%
897.5GNB2010160.62538825515.965.7%
897.5DEN1995160.50038825515.965.7%
899ATL1973140.64331820914.965.7%
900KAN2002160.50046730719.265.7%
901DET198290.44418111913.265.7%
902BAL2014160.62540926916.865.8%
903PIT1988160.31333622113.865.8%
904NWE1977140.64327818313.165.8%
905NYG2003160.25024316010.065.8%
906PIT1971140.42924616211.665.9%
907.5NOR2003160.50034022414.065.9%
907.5GNB1993160.56334022414.065.9%
909HOU1990160.56340526716.765.9%
910ATL1999160.31328518811.866%
911DEN1976140.64331520814.966%
912WAS1993160.2502301529.566.1%
913GNB1973140.429202133.59.566.1%
914SEA1998160.50037224615.466.1%
915DAL1998160.62538125215.866.1%
916CLE1987150.66739025817.266.2%
917BUF1989160.56340927116.966.3%
918SEA1977140.35728218713.466.3%
919STL1996160.37530320112.666.3%
920RAM1975140.85731220714.866.3%
921SFO2015160.3132381589.966.4%
922NYG198290.44416410912.166.5%
923GNB1987150.367255169.511.366.5%
924DAL1999160.50035223414.666.5%
925BUF2015160.50037925215.866.5%
926CAR2014160.469339225.514.166.5%
927PHI1983160.3132331559.766.5%
928ARI1995160.25027518311.466.5%
929PHI1994160.43830820512.866.6%
930TAM1998160.50031420913.166.6%
931NYJ2011160.50037725115.766.6%
933SEA2011160.43832121413.466.7%
933ARI2000160.1882101408.866.7%
933DET1977140.4291831228.766.7%
935.5SDG2007160.68841227517.266.7%
935.5ATL1970140.357206137.59.866.7%
937SDG1984160.43839426316.466.8%
938SEA1981160.37532221513.466.8%
939IND1989160.50029819912.466.8%
940NYG1981160.56329519712.366.8%
941PIT1991160.43829219512.266.8%
942.5PHI1986160.34425617110.766.8%
942.5CHI1970140.42925617112.266.8%
944CLE2006160.2502381599.966.8%
945CLE2005160.3752321559.766.8%
946STL1972140.3211931299.266.8%
947DEN1999160.37531421013.166.9%
948JAX2008160.31330220212.666.9%
949WAS2018160.43828118811.866.9%
950CLE1977140.42926918012.966.9%
951HOU2010160.37539026116.366.9%
952MIA1978160.68837224915.666.9%
953STL2005160.37536324315.266.9%
954NYG2013160.43829419712.367%
955DET1997160.56337925415.967%
956LAC2017160.56335523814.967%
957BAL2015160.31332822013.867.1%
958WAS1973140.71432521815.667.1%
959CLE2010160.31327118211.467.2%
960DEN2018160.37532922113.867.2%
961ARI2006160.31331421113.267.2%
962DAL2017160.56335423814.967.2%
963NYJ2012160.37528118911.867.3%
964DET1990160.37537325115.767.3%
965IND2001160.37541327817.467.3%
966PHI1974140.50024216311.667.4%
967NWE1979160.56341127717.367.4%
968SEA2010160.43831020913.167.4%
969DEN1994160.43834723414.667.4%
970PIT1996160.62534423214.567.4%
971NYJ2017160.31329820112.667.4%
972HOU2011160.62538125716.167.5%
973CHI2015160.37533522614.167.5%
974MIA2014160.50038826216.467.5%
975.5GNB1994160.56338225816.167.5%
975.5NYJ1977140.2141911299.267.5%
977WAS2017160.43834223114.467.5%
978STL1997160.31329920212.667.6%
979SDG2010160.56344129818.667.6%
980WAS2003160.31328719412.167.6%
981WAS1992160.56330020312.767.7%
982WAS1998160.37531921613.567.7%
983MIN1988160.68840627517.267.7%
984OAK2010160.50041027817.467.8%
985NWE1987150.53332021714.567.8%
986SFO1985160.62541127917.467.9%
987DAL1970140.71429920314.567.9%
988BAL1979160.31327118411.567.9%
989PIT2000160.56332121813.667.9%
990WAS2004160.37524016310.267.9%
991NYG1979160.37523716110.167.9%
992PIT2006160.50035324015.068%
993DET1983160.56334723614.868%
994MIA1976140.42926317912.868.1%
995KAN1979160.43823816210.168.1%
996KAN1975140.35728219213.768.1%
997MIA1995160.56339827116.968.1%
999CLE2008160.2502321589.968.1%
999OAK1995160.50034823714.868.1%
999HOU1995160.43834823714.868.1%
1001NOR2012160.43846131419.668.1%
1002MIA1986160.50043029318.368.1%
1003DET2003160.31327018411.568.1%
1004NYJ1992160.2502201509.468.2%
1005CHI1996160.43828319312.168.2%
1006SFO2005160.25023916310.268.2%
1007GNB1996160.81345631119.468.2%
1008DAL2006160.56342529018.168.2%
1009DEN198290.22214810111.268.2%
1010TAM1980160.34427118511.668.3%
1011STL1986160.2812181499.368.3%
1012SDG1972140.321264180.512.968.4%
1013KAN1973140.57123115811.368.4%
1014BUF2018160.37526918411.568.4%
1015CIN2007160.43838026016.368.4%
1016NWE2000160.31327618911.868.5%
1017ATL2014160.37538126116.368.5%
1018OAK2003160.25027018511.668.5%
1019NOR1977140.21423215911.468.5%
1020BUF2011160.37537225515.968.5%
1021ATL2009160.56336324915.668.6%
1022NOR1981160.2502071428.968.6%
1023SFO1973140.35726218012.968.7%
1024DET1984160.281283194.512.268.7%
1025MIA2012160.43828819812.468.8%
1026TEN1997160.50033322914.368.8%
1027SDG1989160.37526618311.468.8%
1028IND2017160.25026318111.368.8%
1029NOR2007160.43837926116.368.9%
1030DET1970140.71434723917.168.9%
1031CIN1974140.50028319513.968.9%
1032NWE1983160.50027418911.869%
1033BUF2006160.43830020712.969%
1034MIA2002160.56337826116.369%
1035TEN2013160.43836225015.669.1%
1036CAR2016160.37536925515.969.1%
1037DAL1973140.71438226418.969.1%
1038DET1980160.56333423114.469.2%
1039NOR1979160.50037025616.069.2%
1040STL1999160.81352636422.869.2%
1041RAI1988160.43832522514.169.2%
1042HOU2006160.37526718511.669.3%
1043SEA198290.444127889.869.3%
1044ATL1993160.37531621913.769.3%
1045NYG1995160.31329020112.669.3%
1046BUF2013160.37533923514.769.3%
1047.5SDG2015160.25032022213.969.4%
1047.5SEA2000160.37532022213.969.4%
1049BUF2009160.37525817911.269.4%
1050CIN2016160.406325225.514.169.4%
1051ATL2013160.25035324515.369.4%
1052HOU2003160.31325517711.169.4%
1053CHI1992160.31329520512.869.5%
1054NWE2009160.62542729718.669.6%
1055ARI2012160.31325017410.969.6%
1056ARI1997160.25028319712.369.6%
1057PHI198290.33319113314.869.6%
1058MIA2015160.37531021613.569.7%
1059RAM1987150.40031722114.769.7%
1060GNB1984160.50039027217.069.7%
1061NWE1993160.31323816610.469.7%
1062CLE2009160.31324517110.769.8%
1063GNB1979160.31324617210.869.9%
1064ATL1981160.43842629818.670%
1065MIA1991160.50034324015.070%
1066SFO1972140.60735324717.670%
1067PIT2007160.62539327517.270%
1068NYG2015160.37542029418.470%
1069WAS2006160.31330721513.470%
1070SDG1991160.25027419212.070.1%
1071DEN1990160.31333123214.570.1%
1072PHI1981160.62536825816.170.1%
1073WAS1980160.37526118311.470.1%
1074NYG1985160.62539928017.570.2%
1075HOU1977140.57129921015.070.2%
1076.5CIN2000160.2501851308.170.3%
1076.5RAM1988160.62540728617.970.3%
1078ATL1994160.43831722313.970.3%
1079TAM2007160.56333423514.770.4%
1080CHI1974140.2861521077.670.4%
1081SDG1971140.42931121915.670.4%
1082ARI2004160.37528420012.570.4%
1083CIN1983160.43834624415.370.5%
1084DET1981160.50039728017.570.5%
1085CIN1972140.57129921115.170.6%
1086TAM2006160.2502111499.370.6%
1087CIN1994160.18827619512.270.7%
1088CLE198290.4441409911.070.7%
1089PHI2008160.594416294.518.470.8%
1090NWE1972140.2141921369.770.8%
1091TAM1993160.31323716810.570.9%
1092ATL1976140.2861721228.770.9%
1093GNB2009160.68846132720.470.9%
1094DET2004160.37529621013.170.9%
1095TAM2018160.31339628117.671%
1096OAK2007160.25028320112.671%
1097PHI1972140.1791451037.471%
1098ARI2016160.46941829718.671.1%
1099PHI2012160.25028019912.471.1%
1100OAK2008160.31326318711.771.1%
1101NOR1973140.3571631168.371.2%
1102PIT1990160.56329220813.071.2%
1103NYG1977140.3571811299.271.3%
1104CAR1995160.43828920612.971.3%
1105SFO198290.33320914916.671.3%
1106BUF1970140.250204145.510.471.3%
1107CHI1983160.50031122213.971.4%
1108NYJ198290.66724517519.471.4%
1109DEN2009160.50032623314.671.5%
1110ATL1984160.25028120112.671.5%
1111CHI1976140.50025318112.971.5%
1112NWE1974140.50034824917.871.6%
1113JAX2002160.37532823514.771.6%
1114TAM1988160.31326118711.771.6%
1115GNB1986160.25025418211.471.7%
1116ARI2005160.31331122313.971.7%
1117JAX2003160.31327619812.471.7%
1118NYJ2018160.25033323914.971.8%
1119HOU2004160.43830922213.971.8%
1120WAS2010160.37530221713.671.9%
1121BAL1971140.71431322516.171.9%
1122NYG1992160.37530622013.871.9%
1123CIN1992160.31327419712.371.9%
1124TEN2015160.18829921513.471.9%
1125HOU2015160.56333924415.372%
1126CIN1998160.18826819312.172%
1127IND1986160.18822916510.372.1%
1128JAX2015160.31337627116.972.1%
1129NOR1985160.31329421213.372.1%
1130BAL2009160.56339128217.672.1%
1131SFO2010160.37530522013.872.1%
1132RAM1990160.31334524915.672.2%
1133NYJ1990160.37529521313.372.2%
1134.5OAK1997160.25032423414.672.2%
1134.5SFO1976140.57127019513.972.2%
1136DAL1986160.43834625015.672.3%
1137NYG2004160.37530321913.772.3%
1138CHI1984160.62532523514.772.3%
1139PIT1986160.37530722213.972.3%
1140PIT2003160.37530021713.672.3%
1141MIN1986160.56339828818.072.4%
1142DET2010160.37536226216.472.4%
1143PHI1970140.250241174.512.572.4%
1144ATL1990160.31334825215.872.4%
1145NOR1991160.68834124715.472.4%
1146SEA1994160.37528720813.072.5%
1147DEN1988160.50032723714.872.5%
1148NYG1987150.40028020313.572.5%
1149HOU1970140.250217157.511.372.6%
1150NYJ1993160.50027019612.372.6%
1151TAM1978160.31324117510.972.6%
1152DEN1972140.35732523616.972.6%
1153NYG2014160.37538027617.372.6%
1154OAK1996160.43834024715.472.6%
1155CIN2006160.50037327116.972.7%
1156BUF2012160.37534425015.672.7%
1157PHO1990160.31326819512.272.8%
1158MIN1984160.18827620112.672.8%
1159ARI2003160.25022516410.372.9%
1160ATL2003160.31329921813.672.9%
1161.5TAM2013160.25028821013.172.9%
1161.5SFO2003160.43838428017.572.9%
1163TEN2004160.31334425115.773%
1164STL1998160.25028520813.073%
1165BUF2005160.31327119812.473.1%
1166SDG2016160.31341030018.873.2%
1167DET2005160.31325418611.673.2%
1168NWE1973140.35725818913.573.3%
1169WAS2011160.31328821113.273.3%
1170DET1976140.42926219213.773.3%
1171.5TEN2010160.37535626116.373.3%
1171.5PIT1981160.50035626116.373.3%
1173GNB1971140.35727420114.473.4%
1174ATL2000160.25025218511.673.4%
1175TAM2017160.31333524615.473.4%
1176BUF2016160.43839929318.373.4%
1177.5KAN2007160.25022616610.473.5%
1177.5DAL198290.66722616618.473.5%
1179MIA2006160.37526019111.973.5%
1180HOU1971140.321251184.513.273.5%
1181NYJ2007160.25026819712.373.5%
1182STL1970140.60732523917.173.5%
1183STL1971140.32123117012.173.6%
1184IND1984160.25023917611.073.6%
1185.5BAL2007160.31327520312.773.8%
1185.5JAX1995160.25027520312.773.8%
1187DEN2010160.25034425415.973.8%
1188NYJ2003160.37528320913.173.9%
1189RAM1991160.18823417310.873.9%
1190CAR1997160.43826519612.374%
1191CHI2014160.31331923614.874%
1192SEA2015160.62542331319.674%
1193ATL1992160.37532724215.174%
1194LAR2016160.25022416610.474.1%
1195DEN1970140.393253187.513.474.1%
1196ATL1987150.20020515210.174.1%
1197TAM2011160.25028721313.374.2%
1198.5GNB1974140.42921015611.174.3%
1198.5PIT1970140.35721015611.174.3%
1200CLE1975140.21421816211.674.3%
1201DAL1997160.37530422614.174.3%
1202CLE2013160.25030822914.374.4%
1203DAL2001160.31324618311.474.4%
1204HOU1986160.31327420412.874.5%
1205GNB1980160.34423117210.874.5%
1206OAK2012160.25029021613.574.5%
1207CLE2000160.1881611207.574.5%
1208.5DAL2015160.25027520512.874.5%
1208.5MIA2004160.25027520512.874.5%
1210ATL1988160.31324418211.474.6%
1211CAR2011160.37540630318.974.6%
1212DET2018160.37532424215.174.7%
1213NOR1976140.28625318913.574.7%
1214DET1973140.464271202.514.574.7%
1215DET1986160.31327720712.974.7%
1216CIN1987150.26728521314.274.7%
1217CIN1989160.50040430218.974.8%
1218BAL1973140.28622616912.174.8%
1219JAX2017160.62541731219.574.8%
1220GNB2008160.37541931419.674.9%
1221KAN198290.33317613214.775%
1222CHI2002160.25028121113.275.1%
1223BAL2005160.37526519912.475.1%
1224HOU2002160.25021316010.075.1%
1225OAK2005160.25029021813.675.2%
1226BAL2017160.56339529718.675.2%
1227CLE1984160.31325018811.875.2%
1228PHI2016160.43836727617.375.2%
1229SFO1974140.42922617012.175.2%
1230CHI1980160.43830422914.375.3%
1231CHI1973140.21419514710.575.4%
1232.5NYJ2005160.25024018111.375.4%
1232.5HOU1984160.18824018111.375.4%
1234WAS1970140.42929722416.075.4%
1235CLE1991160.37529322113.875.4%
1236RAM1972140.464291219.515.775.4%
1237CLE1995160.31328921813.675.4%
1238WAS2013160.18833425215.875.4%
1239KAN1987150.26727320613.775.5%
1240DET1998160.31330623114.475.5%
1241PHI2011160.50039629918.775.5%
1242PHO1991160.2501961489.375.5%
1243ARI2002160.31326219812.475.6%
1244GNB1975140.28622617112.275.7%
1245MIA2011160.37532924915.675.7%
1246BUF2003160.37524318411.575.7%
1247PHO1993160.43832624715.475.8%
1248CLE2012160.31330222914.375.8%
1249JAX2018160.31324518611.675.9%
1250IND1985160.31332024315.275.9%
1251NYJ1975140.21425819614.076%
1252ATL1989160.18827921213.376%
1253SFO1975140.35725519413.976.1%
1254WAS2014160.25030122914.376.1%
1255CHI1998160.25027621013.176.1%
1256CLE2011160.25021816610.476.1%
1257KAN1983160.37538629418.476.2%
1258STL1979160.31330723414.676.2%
1259TAM1987150.26728621814.576.2%
1260CIN2008160.281204155.59.776.2%
1261OAK2014160.18825319312.176.3%
1262BUF2010160.25028321613.576.3%
1263DET2012160.25037228417.876.3%
1264PHI1998160.1881611237.776.4%
1265ARI2018160.18822517210.876.4%
1266SEA1991160.43827621113.276.4%
1267RAM1977140.71430223116.576.5%
1268WAS1994160.18832024515.376.6%
1269CIN1978160.25025219312.176.6%
1270BUF198290.44415011512.876.7%
1271SDG2003160.25031324015.076.7%
1272NYJ2014160.25028321713.676.7%
1273PIT1985160.43837929118.276.8%
1274SDG2001160.31333225515.976.8%
1275NYJ1980160.25030223214.576.8%
1276KAN2009160.25029422614.176.9%
1277ATL1985160.25028221713.677%
1278.5JAX2011160.31324318711.777%
1278.5PHO1992160.25024318711.777%
1280HOU1976140.35722217112.277%
1281NOR1974140.3571661289.177.1%
1282SEA1993160.37528021613.577.1%
1283DEN2017160.31328922313.977.2%
1284NYJ1970140.28625519714.177.3%
1285DET1988160.25022017010.677.3%
1286NYJ2009160.56334826916.877.3%
1287NOR1970140.1791721339.577.3%
1288RAM1993160.31322117110.777.4%
1289TAM2009160.18824418911.877.5%
1290SDG1990160.37531524415.377.5%
1291MIN1990160.37535127217.077.5%
1292CLE2003160.31325419712.377.6%
1293SFO2004160.12525920112.677.6%
1294NYG1976140.2141701329.477.6%
1295.5CHI2017160.31326420512.877.7%
1295.5NYG1978160.37526420512.877.7%
1297TAM1977140.143103805.777.7%
1298DET1987150.26726920913.977.7%
1299KAN2012160.12521116410.377.7%
1300SFO1977140.35722017112.277.7%
1301NOR1986160.43828822414.077.8%
1302DET1996160.31330223514.777.8%
1303DAL2000160.31329422914.377.9%
1304.5TEN2005160.25029923314.677.9%
1304.5STL1980160.31329923314.677.9%
1306OAK2013160.25032225115.778%
1307BUF1978160.31330223614.878.1%
1308ATL1977140.50017914010.078.2%
1309CAR1998160.25033626316.478.3%
1310TAM1992160.31326720913.178.3%
1311SFO1999160.25029523114.478.3%
1312.5STL2007160.18826320612.978.3%
1312.5CHI1997160.25026320612.978.3%
1314DET1992160.31327321413.478.4%
1315CHI1989160.37535828117.678.5%
1316DET2006160.18830524015.078.7%
1317RAI1987150.33330123715.878.7%
1318JAX2000160.43836728918.178.7%
1319NYJ1973140.28624018913.578.8%
1320SEA2009160.31328022113.878.9%
1321SDG1997160.25026621013.178.9%
1322TAM2004160.31330123814.979.1%
1323TAM1986160.12523918911.879.1%
1324CIN1991160.18826320813.079.1%
1325NOR2005160.18823518611.679.1%
1326GNB2005160.25029823614.879.2%
1327SFO2018160.25034227116.979.2%
1328ATL1974140.214111886.379.3%
1329NYG1996160.37524219212.079.3%
1330IND1998160.18831024615.479.4%
1331SFO2000160.37538830819.379.4%
1332PHI1976140.2861651319.479.4%
1333CLE2015160.18827822113.879.5%
1334BAL1996160.25037129518.479.5%
1335BAL1972140.35723518713.479.6%
1336DAL1988160.18826521113.279.6%
1337STL2014160.37532425816.179.6%
1338WAS2009160.25026621213.379.7%
1339DET2009160.12526220913.179.8%
1340JAX2006160.50037129618.579.8%
1341PIT1999160.37531725315.879.8%
1342SDG1975140.14318915110.879.9%
1343TAM1991160.1881991599.979.9%
1344RAI1992160.43824919912.479.9%
1345CIN1979160.25033727016.980.1%
1346JAX2016160.18831825515.980.2%
1347CHI1978160.43825320312.780.2%
1348CLE1990160.18822818311.480.3%
1349BAL1981160.12525920813.080.3%
1350IND1991160.0631431157.280.4%
1351HOU2013160.12527622213.980.4%
1352PHI1975140.28622518112.980.4%
1353SFO2009160.50033026616.680.6%
1354NOR1998160.37530524615.480.7%
1355HOU2017160.25033827317.180.8%
1356NWE1992160.12520516610.481%
1357CHI1972140.321225182.513.081.1%
1358NOR1996160.18822918611.681.2%
1359DEN1971140.32120316511.881.3%
1360NWE1975140.21425821015.081.4%
1361CLE2004160.25027622514.181.5%
1362JAX2014160.18824920312.781.5%
1363BUF1986160.25028723414.681.5%
1364NYJ1976140.2141691389.981.7%
1365.5GNB1988160.25024019612.381.7%
1365.5ATL1975140.28624019614.081.7%
1367CLE1974140.28625120514.681.7%
1368STL2011160.1251931589.981.9%
1369SEA2008160.25029424115.182%
1370CIN2010160.25032226416.582%
1371RAM198290.22220016418.282%
1372NYG1974140.14319516011.482.1%
1373NYG1973140.179226185.513.382.1%
1374PHI1977140.35722018112.982.3%
1375.5MIN2011160.18834028017.582.4%
1375.5CIN1993160.1881871549.682.4%
1377TAM2003160.43830124815.582.4%
1378IND1997160.18831325816.182.4%
1379BOS1970140.1431491238.882.6%
1380BUF2001160.18826521913.782.6%
1381.5CAR2010160.12519616210.182.7%
1381.5JAX2001160.37529424315.282.7%
1383NOR1975140.1431651379.883%
1384IND1993160.2501891579.883.1%
1385BUF1977140.2141601339.583.1%
1386NYJ1995160.18823319412.183.3%
1387DET2002160.18830625515.983.3%
1388NOR1999160.18826021713.683.5%
1389SDG1973140.17918815711.283.5%
1390KAN1978160.25024320312.783.5%
1391RAM1994160.25028623914.983.6%
1392ATL1996160.18830925916.283.8%
1393HOU198290.11113611412.783.8%
1394HOU1983160.12528824215.184%
1395TAM1983160.12524120312.784.2%
1396BAL1974140.14319016111.584.7%
1397CLE1999160.12521718411.584.8%
1398PIT1976140.71434229020.784.8%
1399SEA1980160.25029124715.484.9%
1400SEA1992160.1251401197.485%
1401JAX2012160.12525521713.685.1%
1402CIN1971140.28628424317.485.6%
1403NOR1972140.17921518413.185.6%
1404OAK2006160.1251681449.085.7%
1405HOU2005160.12526022313.985.8%
1406STL2008160.12523219912.485.8%
1407HOU1973140.07119917112.285.9%
1408DET2001160.12527023414.686.7%
1409NYG2017160.18824621413.487%
1410HOU1972140.07116414310.287.2%
1411IND2011160.12524321213.387.2%
1412GNB1991160.25027323914.987.5%
1413KAN1977140.14322519714.187.6%
1414TAM2014160.12527724415.388.1%
1415CHI2016160.18827924615.488.2%
1416KAN2008160.12529125716.188.3%
1417BUF1976140.14324521715.588.6%
1418DET1979160.12521919412.188.6%
1419BUF1971140.07118416311.688.6%
1420SDG1986160.25033529718.688.7%
1421HOU1994160.12522620112.688.9%
1422SEA1976140.14322920414.689.1%
1423NYG1983160.21926723814.989.1%
1424TEN2014160.12525422814.389.8%
1425NWE1981160.12532229318.391%
1426BAL198290.05611310311.491.2%
1427NWE1990160.06318116610.491.7%
1428BUF1984160.12525023014.492%
1429NYJ1996160.06327925716.192.1%
1430SFO1979160.12530828417.892.2%
1431SFO1978160.12521920212.692.2%
1432SFO2016160.12530928617.992.6%
1433NOR1980160.06329127016.992.8%
1434CLE2016160.06326424615.493.2%
1435CIN2002160.12527926116.393.5%
1436MIA2007160.06326725015.693.6%
1437SDG2000160.06326925215.893.7%
1438STL2009160.06317516410.393.7%
1439TAM1985160.12529427617.393.9%
1440CAR2001160.06325323914.994.5%
1441BUF1985160.12520018911.894.5%
1442DAL1989160.06320420012.598%
1444CLE2017160.00023423414.6100%
1444DET2008160.00026826816.8100%
1444TAM1976140.0001251258.9100%

If the Seahawks can keep this up, they will wind up being the most efficient team at distributing their points across games for any team since 1970.

{ 0 comments }

Justin Tucker continues to be the best kicker in the NFL. He missed his first kick today, from 40 yards away, which was shocking. And that’s the point of today’s post: Tucker missing a 40-yard field goal is shocking.

His last 7 misses were from 65, 53, 48, 43, 46, 62, and 58 yards away. He had made 56 consecutive field goals from 40 yards and in, until the miss today against Houston. The graph below shows the result of every regular season field goal in Tucker’s career, from his first game in 2012 through week 10 of the 2019 season. [continue reading…]

{ 0 comments }

Previously:

In 1974, the Bengals — the Paul Brown/Bill Walsh/Ken Anderson Bengals — were running the West Coast Offense to perfection. Anderson completed a whopping 64.9% of his passes that season, setting a post-WWII record. But in the team’s final game of the season, with Anderson injured, the team turned to unheralded Wayne Clark at quarterback. Unfortunately, the schedule makers had the team’s final game in Pittsburgh, against the famed ’74 Steelers defense.

The Bengals were blown out, of course, and lost 27-3. Cincinnati trailed by at least 17 points at halftime, after three quarters, and at the end of the game. Naturally, this is a Game Script that would call for a lot of passes, but here’s the twist: the Bengals ran 41 times and passed just 8 times! Clark completed only 3 of those passes for 23 yards, with 2 of them going to TE Bruce Coslet — yes, that Bruce Coslet — for 24 yards; the third completion was a 1-yard loss to the running back.

Running 40 times in a game where you trail by 17 after the 2nd, 3rd, and 4th quarters should sound weird to you. In fact, this Bengals game was the only time since the merger that all those factors were met. I say was, because that was the case until Sunday, when the modern Bengals pulled off the same trick.

Cincinnati rushed 40 times, and Joe Mixon had 30 carries, in a game where the Bengals trailed 14-0 after the 1st quarter, 28-10 at halftime, and 49-10 after three quarters. How do you call 40 rushing plays in a game where you are getting blown out? One answer is that Cincinnati was starting Ryan Finley for the first time in his career, although Finley did not play all that poorly. The other answer is that the Bengals just didn’t care.

My favorite drive was with 5 minutes left in the 3rd quarter. Cincinnati took over at its own 25, trailing 42-10. Yes, down by 32 with 20 minutes to go is not a good situation, but most teams would at least try to put some points on the board. Here’s what happened.

Play 1: Mixon run left tackle for 0 yards.
Play 2: Pass to Mixon 1 yard ahead of the line of scrimmage; Mixon gains 13 yards of YAC.
Play 3: Mixon run right tackle for 3 yards.
Play 4: Mixon run left guard for 1 yard.
Play 5: 3rd-and-6, Finley pass, sack, fumble, returned for touchdown.

Maybe the Bengals knew what they were doing calling all those running plays.

The table below shows the week 10 Game Scripts, headlined by the Ravens +21.6 Game Script. [continue reading…]

{ 0 comments }

Pass Identities of NFL Defenses Through 8 Weeks

Yesterday, we looked at the pass identities of each offense. Today, we will use the exact same methodology to examine NFL defenses. We would expect defenses to have less control over their pass identity than offenses, because of the obvious fact that it’s the offense that gets to choose whether to pass or run. But that doesn’t mean there aren’t some interesting outliers.

Let’s begin with the Houston Texans, who have a basically neutral team. The Texans blew out the Falcons by 21 points, but otherwise have been in all one-score games. In fact, despite a 5-3 record, the Texans actually have a slightly negative Game Script of -0.6. So you would think opposing teams would pass a normal amount against them. You would be wrong: Houston opponents have passed on 66% of all plays this year, the second-highest rate in the NFL behind only the Patriots (against whom opponents are forced to pass from the opening gun).

Why? Well, the Texans have a pretty bad pass defense and a pretty good run defense. Given that in general it’s smarter to pass than to run, and the Texans offense is pretty explosive, you can see why teams tend to pass against Houston. To particularly egregious examples: the Chiefs passed on 77% of plays, and the Chargers 74%, in their games against Houston. In both games, the Texans had a -2.4 Game Script. In both games, Houston trailed 10-0, but their opponents threw on 3 out of every 4 plays. That says a lot about the Texans secondary, and maybe also fear of the Houston offense.

Conversely, we have the San Francisco 49ers. Despite having the second best Game Script in the NFL and an undefeated 7-0 mark, teams have passed on only 60.1% of all plays against San Francisco this year (through 8 weeks, at least; this was written prior to the Thursday Night Game). Teams appear afraid of throwing against the 49ers, and it appears with good reason: the team’s pass defense has been dominant.

The graph below shows each pass defense this season. The X-axis shows Game Script, and the Y-Axis shows pass ratio by that team’s opponents. I have shaded the Texans and 49ers data points, along with the Jets. It’s not all that interesting because of how bad the Jets have been, but the Jets actually have the strongest pass identity of any defense this season, even more than Houston. More on them in a moment. [continue reading…]

{ 0 comments }

Pass Identities of NFL Offenses Through 8 Weeks

The graph below shows the Game Script (X-Axis) and Pass Ratio (Y-Axis) for every game this season. For new readers, a team’s Game Script is simply its average margin of lead (or deficit) over every second of a game. Pass ratio is simply passing plays (pass attempts plus sacks) divided by all offensive plays (pass attempts + sacks + rushing attempts).

As you can see, there’s a clear relationship between the two variables: on average, the better the Game Script, the lower the Pass Ratio.

We can also create season ratings of Game Scripts and Pass Ratios for each team. Let’s use the Patriots and Eagles as examples.

New England has had an average Game Script across its 8 games of +13.1. This year, New England’s pass ratio in those 8 games is 58.2%. Philadelphia has had an average Game Script of -2.2, and a pass ratio of 55.0%. It might strike you as odd to see that New England has a higher pass ratio — i.e., it’s passed more frequently — than Philadelphia. It should! That’s because New England has the strongest passing identity in the NFL, while the Eagles have the strongest rushing identity in the NFL.

The Patriots have, by far, the best average Game Script this season; all else being equal, you might expect New England to therefore have the lowest pass ratio in the NFL. Instead, the team is barely below average, ranking 19th in percentage of passing plays. Philadelphia has the 25th-best Game Script this year, as the Eagles had a -4.4 Game Script against Atlanta, a -4.9 GS against Detroit, a -9.9 vs. Minnesota and a -14.8 against Dallas. And yet the Eagles have just the 25th-best highest passing ratio in the league! That’s very run-heavy, as noted yesterday.

The graph below shows the Game Script (X-Axis) and Pass Ratio (Y-Axis) of each offense this season. I have shaded in team colors the Patriots and Eagles data points: [continue reading…]

{ 0 comments }

The Patriots Pass Defense Is Impossible

We are never going to see this level of statistical dominance by a pass defense again.

That’s a pretty bold statement from a pretty conservative blog focused on football history. But 1 passing TD allowed and 18 interceptions in a 7-game stretch?

That will never happen again, and frankly, we may not ever see anything all that close to it happen again. In 2018, the NFL finally exceeded a 2-to-1 ratio of passing touchdowns to interceptions, and the long-term trend is clear: more touchdown passes, fewer interceptions. This season, the 31 pass defenses in the NFL outside of Foxboro have allowed 319 passing touchdowns and forced 155 interceptions, a 2.06-to-1.00 ratio. But the Patriots have forced opposing passers into a 1-to-18 ratio. Include New England’s pass defense, and the NFL’s TD/INT ratio drops to 1.85-to-1.00.

That. Is. Absurd.

Yes, the quarterbacks have been bad. Really bad in some cases (Luke Falk, Josh Rosen), but it also includes games from Ben Roethlisberger, Sam Darnold (coming off a dominant performance), and occasionally competent passers like Case Keenum, Josh Allen, Daniel Jones, and Ryan Fitzpatrick. But it doesn’t matter: if you would have asked me could the best defense in the NFL produce a 1-to-18 ratio against the worst quarterbacks in the NFL for a 7-game span, I would have said no.

This is obviously unsustainable but it is so far to the right tail of comprehensible that you just have to look at the stat line in awe. And know that something like this will never happen again. New England’s defense has posted a passer rating of 35.6; if you throw an incomplete pass on every plat, that’s a 39.6 passer rating! New England is allowing less than 1.0 ANY/A over 7 games! If a running back had 1,000 yards on his first 100 carries of the season, that would be unsustainable, too, but it wouldn’t make it any less remarkable. It might make it more remarkable, because this transcends any notion of what we would think possible.

The graph below shows the TD% (on the X-Axis) and INT% (on the Y-Axis) for each pass defense this year. To make “up and to the right” the good part of the graph, I have plotted the TD% in reverse order. As you can see, the Patriots pass defense stands alone. [continue reading…]

{ 0 comments }

Leonard Fournette and Yards per Carry

Leonard Fournette is averaging 5.0 yards per carry this season, a year after producing an anemic 3.3 average in 2018. After Fournette’s latest performance against the Bengals, his career average gain has once again bounced north of four yards. This prompted our friend Adam Harstad to note on Twitter that all those who were down Fournette because of his low yards per carry average could now rest easy since his YPC is once again above 4.0.

The graph below shows Fournette’s career yards per carry average after every game of his 28-game career.

[continue reading…]

{ 0 comments }

One of my favorite articles was written back in 2012, and the idea began during my law school days.

One of my law school professors was very quirky, even by law school professor standards. His preferred examination method was multiple choice, but with a twist. After grading each exam, he would then divide the students into quarters based on their test score. He would then re-examine each question, and measure how the top quarter of students performed on each question relative to the bottom quarter. Any question that more bottom-quarter students answered correctly than top-quarter students would be thrown out, and the exam would be re-graded. As he delicately put out, ‘if the wrong students are getting the question right, and the right students are getting the question wrong, it’s a bad question.’

NFL passing records are falling for a variety of reasons these days, including rules changes and league policies that make the passing game more effective. But there’s another reason: for the first time in awhile, the right people are throwing the most passes in the league. And there’s no better example of that than Drew Brees. Since coming to the Saints in 2006, he’s ranked 1st or 2nd in pass attempts four times, and ranked in the top three in net yards per attempt four times. But even since ’06, we’ve seen the passing game evolve, as the best quarterbacks are now the most likely ones to finish near the top of the leaderboard in pass attempts. In 2010, Peyton Manning had his first 600-attempt season… when he threw 679 passes for the Colts. Tom Brady threw 611 passes last year for the 13-3 Patriots, making New England one of just three teams to threw 600 pass attempts and win 13 or more games in a season. The other two teams? The ’09 Colts and the ’11 Saints.

In this early 1970s, the best passing teams often didn’t throw very often. In 1972, the top four teams in ANY/A — the Dolphins, Redskins, Giants, and Jets — all ranked in the bottom half of the NFL in pass attempts. And as I wrote in a 2014 update, there is a way to measure whether the best passing teams in the NFL are also the most frequent passing teams:

[W]hen we say the average completion percentage in the NFL is 61.2%, this is generally assumed to reflect the fact that in 2013, there were 18,136 passes thrown in the NFL, and 11,102 of them were completed.

An alternative method of measuring completion percentage in the NFL is take the average completion percentage of each of the 32 teams. That number won’t be very different, but it won’t be identical, either. The difference, of course, is that this method places the same weight on each team’s passing attack when determining the league average. The former, more common method, means that the Cleveland Browns make up 3.755% of all NFL pass attempts and the San Francisco 49ers are responsible for only 2.299% of the league-average passing numbers. The latter method puts all teams at 3.125% of NFL average.

Believe it or not, that background presents an interesting way to look at how the NFL has become more of a passing league.

For example, let’s look at the 1972 season. Miami led the NFL in points scored and in rushing attempts, while ranking 24th out of 26 teams in pass attempts. Does this mean the Dolphins weren’t a good passing team? Of course not; in fact, Miami had the highest Adjusted Net Yards per Attempt average of any team that season! That year, only two teams threw over 400 passes: New England and New Orleans. And both teams were below-average in ANY/A, with the Patriots ranking in the bottom three.

In 1972, the average pass in the NFL gained 4.28 Adjusted Net Yards. But an average of each team’s ANY/A average was 4.34, because good passing teams like Miami and Washington passed less frequently than bad passing teams like New England and New Orleans. The league-wide average was only 98.5% of the “average of the averages” average; whenever that number is less than 100%, we can conclude that the better passing teams are passing less frequently.

The graph below shows the passing data for the 32 teams in the NFL in 2018. The X-Axis shows each team’s Adjusted Net Yards per Attempt average; the Y-Axis shows each team’s number of dropbacks (pass attempts plus sacks). In a league where the teams with the best quality of passing attacks also have the most quantity of pass plays, the data will generally fit a line that slopes up and to the right. That’s not quite the case here, but there is a positive relationship between the two variables. Yes, the Saints were very efficient but didn’t pass very often, but the Chiefs led the NFL in ANY/A and were 12th in passing dropbacks, while the Falcons were 3rd in ANY/A and 5th in dropbacks. And the bottom three teams in dropbacks — the Jets, Bills, and Cardinals — all ranked in the bottom 10 in ANY/A.

In 2018, the NFL as a league averaged 6.32 ANY/A. However, if you average the ANY/A averages of each of the 32 teams, you get an average of 6.29. This means the average ANY/A was equal to 100.5% of the “average of the averages” ANY/A; that result only exceeds 100% when the better passing teams pass more frequently than the weaker passing teams. Twenty years earlier, in 1998, the league as a whole averaged 5.31 ANY/A, but an average of each team’s ANY/A would give you a result of 5.34. That’s because by assigning the same weight to each passing offense, you would have a higher result in 1998 than if you weighted efficiency by pass attempts because in 1998, weaker passing teams passed more often than stronger passing teams.

The graph below shows the relationship between these two variables. In short, it shows for each season since 1970, the league-wide ANY/A average divided by the ANY/A average for each of the teams in the league that year. A result of more than 100% means the better passing teams passed more often than the weaker passing teams.

Pretty neat, right? And at least in 2018, the better passing teams passed more often than the weaker passing teams.

{ 1 comment }

Running Back Heat Maps – 2018 Season

Regular readers are familiar with my running back heat maps, but let’s use Ezekiel Elliott and Saquon Barkley as examples.

Last season, Elliott and Barkley finished first and second in rushing yards and rushing attempts. Elliott averaged a very strong 4.73 yards per carry, but Barkley had a sparkling 5.01 YPC average. However, there is more than meets the eye.

Elliott rushed for positive yards on 83% of his carries; that’s pretty good, because the average among all running backs with at least 100 carries was 81%. Meanwhile, Barkley rushed for positive yards on only 77% of his carries. Elliott rushed for at least 2 yards on 71% of his carries; Barkley did it on just 61% of his carries. Gaining at least 3 yards? Elliott did that 55% of the time, while Barkley did it just 48% of the time. This trend holds true for awhile: Elliott picked up at least 4, 5, and 6 yards on 45%, 35%, and 29% of his carries; for Barkley, those rates were 38%, 30%, and 25%, respectively.

At least 7 yards? Elliott did that on 24% of his carries, while Barkley only rushed for 7+ yards 18% of the time. It gets a little closer at 8 and 9 yards, but Elliott still wins, 18% to 16% and 16% to 15%.

How about at least 10 yards? The Cowboys star gained 10 or more yards on 13% of his rushes; Barkley did it on 12% of his carries. How about 15+ yards? Elliott hit that mark on 8.2% of his carries, while the Giants start did it on 7.7% of his rushes. So how in the world did Barkley finish the season with a higher yards per carry average? Because Elliott rushed for 20+ yards on just 4% of his carries, while Barkley did it on 6% of his carries. More importantly, Elliott’s longest run was 41 yards, while Barkley had runs of 46, 50, 51, 52, 68, 68, and 78. That’s how, despite Elliott pretty much “winning” at each distance, he lost the YPC battle. Even if Elliott had big runs more often, Barkley’s big runs were really big runs. [continue reading…]

{ 0 comments }

2019 Salary Cap Info and Concentration Index

The New York Giants have a very top-heavy salary cap structure. The team’s top five 2019 salary cap hits belong to Eli Manning, Nate Solder, Janoris Jenkins, Alec Ogletree, and Kevin Zeitler, and total a whopping $76.7 million. Meanwhile, the Giants players with the 6th through 51st largest cap hits total just $71.5 million. That’s absurdly top-heavy (and comes after moving on from Damon Harrison, Olivier Vernon and Odell Beckham over the last few months). The Giants organization has really embraced a “star and duds” approach.

Consider the Buffalo Bills, whose top-5 largest 2019 cap hits belong to Star Lotulelei, Mitch Morse, Jerry Hughes, LeSean McCoy, and Trent Murphy and total $50.6M. The rest of the top 51 salary cap hits on the roster total $107.5M. The Bills do not have a single player with a 2019 salary cap hit of $11.8M or greater; meanwhile, every other team in the NFL has at least two such players.

The Giants and Bills are at the extreme ends of salary cap/roster construction. One way to measure how concentrated (or not concentrated) a team’s salary cap is by using the Concentration Index, described here. In short, we do the following steps:

1) Calculate the 2019 salary cap hit of the top 51 players on each team’s roster. Thanks to Over The Cap, I was able to collect this information.

2) For each player on each team, calculate the percentage of team salary cap dollars spent on that player. For example, Kirk Cousins of the Vikings has a 2019 cap hit of $29M, and the Vikings top 51 players have a cap hit of $184M. Therefore, Cousins is taking up 15.8% of Minnesota’s 2019 cap spend.

3) Square the result for each player (so Cousins’s 15.8% becomes 2.5%), and then sum those results for each player on each team to get team grades.

By squaring the results, you give more weight to players taking up a larger percentage of their team’s pie. Matthew Stafford ($29.5M cap charge) has both the highest 2019 Cap charge in the league and since the Lions top 51 players only have cap hits totaling $160M, has the highest percentage of team cap charge at 18.4%. When you square that result, you get 3.4%. Meanwhile, for Buffalo, Lotulelei’s $11.5M charge represents 7.3% of Buffalo’s top 51 largest cap hits, and then drops to just 0.5% when you square the result.

When you sum those squared results for each team, the Giants stand out as the team with the largest concentration of salary cap dollars in the fewest players, at 7.0%. Meanwhile, the Bills have dispersed their salary cap dollars in the widest manner, at just 3.7%.

Another interesting team is Cleveland. The Browns are similar to Buffalo, and have spread their salary cap dollars around: their concentration index is just 4.2%, the second lowest in the league. But Cleveland also has spent the most 2019 salary cap dollars on its top 51 players, at a whopping $192M! Think about what that means: the Browns are paying a ton of money to their players in the aggregate, but spreading it around a lot. That must mean that Cleveland is paying a lot of people good money, and well, that’s exactly what’s happening. The Browns are paying 14 players at least $6.6M in 2019 cap dollars. No other team has more than 11 such players.

The graph below shows the results of today’s post. The X-Axis shows the 2019 salary cap dollars each team has spent on its top 51 players (no dead money is included). The Y-Axis shows the concentration index for each team for these 51 players. As you can see, the Giants (highly concentrated) are at the top of the chart, the Bills are at the bottom, the Browns are at the far right (lots of $$ spent), and the Dolphins (little $$ spent) are at the far left.

[continue reading…]

{ 0 comments }

The Opposite Trends of Field Goals and Turnovers

There are only a few statistics that have clear long-term trends. And two of them happen to intersect in a notable way.

The NFL used to have significantly more turnovers. Both fumbles lost and interceptions thrown have been declining since the merger, and for the decades before then, too.

Another trend: field goal accuracy has gone up, consistently, for generations. Field goal attempts rose for much of history until 1974 — when the goal posts were moved 10 yards from the front of the end zone to the back — and then began rising again. As a result, made field goals have increased significantly.

There have been varying numbers of teams and games on team’s schedules throughout history, so the best way to think of some statistics is on a per team basis. To avoid too many decimals, let’s look at things on a per-100 team game basis for the remainder of this post.

In 1950, teams made 51 field goals per 100 team games, or just over half a field goal per game (they attempted about 1.2). Also in 1950: teams averaged 373 turnovers per 100 team games! In other words, in a given game, if you picked a random play, it was over 7 times as likely to be a turnover than a successful field goal.

In 1960 (NFL data only), teams made 104 field goals per 100 team games, and committed 286 turnovers. So now a turnover was 2.74 times as likely as a field goal.

In 1970, teams made 131 field goals and committed 243 turnovers per team game, making turnovers 1.85 times as likely as successful field goal tries.

By 1980, we were back down to 107 field goals (remember, the goal posts were now 10 yards back) and 232 turnovers per 100 team games, for a ratio of 2.17 turnovers to every field goal.

In 1990, teams made 132 field goals per team game and had 199 turnovers, the first season where teams averaged fewer than two turnovers per game. This was a ratio of 1.51 to 1.

In 2000, teams kicked 147 field goals per team and and had 188 turnovers, meaning there was only 1.28 turnovers for every successful field goal.

In 2008, teams made 165 field goals per team game and committed just 155 turnovers, the first season where there were more field goals made than turnovers forced.

And last year, in 2017, teams averaged 169 field goals per team game and only 138 turnovers, for a rate of 0.82 turnovers per field goal, the single lowest rate in NFL history.

But despite all the words I just wrote, one picture is worth more than all of them. The graph below shows the turnovers committed and field goals made per 100 team games.

Pretty crazy, eh? Entertainment is subjective, of course, but declining turnover rates and increasing field goal rates do not seem like steps in the direction of a more entertaining game.

{ 1 comment }

On Sunday, I noted that roughly 2/3s of all touchdown passes now come from inside of the red zone. That number is, of course, even higher when we look at all offensive touchdowns. The graph below shows the percentage of passing and rushing touchdowns that came from within the red zone in every year since 1950. Prior to 1970, less than 70% of all touchdowns came from within the red zone; since then, it’s been at about 75%. What’s interesting is that while there is an obvious increase over the course of pro football history, the rate has been relatively steady over the last five decades:

[continue reading…]

{ 11 comments }

2017 AV-Adjusted Team Age: Overall

On Monday, we looked at the AV-adjusted average age of each team’s offense in 2017.

On Tuesday, we did the same for defense.

Today, let’s look at the average age of each team overall in 2017. For reference, here are last year’s results. You won’t be surprised to see Cleveland grade out as the youngest team in 2017 by over a full year. The Browns also failed to win a game, so youth didn’t work out for that team.

But the second-youngest team in football was the Jacksonville Jaguars, who nearly won the AFC. The Jaguars held a lead in the AFC Championship Game, before losing to the third-oldest team in the NFL… the Patriots.

The table below shows the average age of each team last season. [continue reading…]

{ 0 comments }

2017 AV-Adjusted Team Age: Defense

Yesterday, we looked at the age-adjusted offenses from 2017. Today we do the same for defenses, just like we did last year. Here’s how I opened that column:

Being young isn’t by itself a virtue: the Browns ranked in the bottom 5 in points allowed, yards allowed, net yards per attempt allowed, net yards per rush allowed, turnovers forced, and first downs allowed. But Cleveland was, by far, the youngest defense in the NFL last season.

In 2016, the Browns defense had an average AV-adjusted age of just 25.2; the Falcons were the second-youngest defense at 25.8. In 2017, the Falcons again had an average AV-adjusted defense that was just 25.8 years old. But the Browns? That number dropped to just 24.5! The Browns defense was even younger than the Browns offense, and was by far the youngest unit in all of football: [continue reading…]

{ 0 comments }
Previous Posts