
In the modern NFL, the passing game — and the passing offense — is king. With completion percentages, passing yards, and passing touchdowns continuing to hit all-time highs, and interceptions reaching all-time lows, it’s easy to only focus on each team’s passing game. But you may have missed not one, but two of the greatest defensive record-breaking seasons of all time.
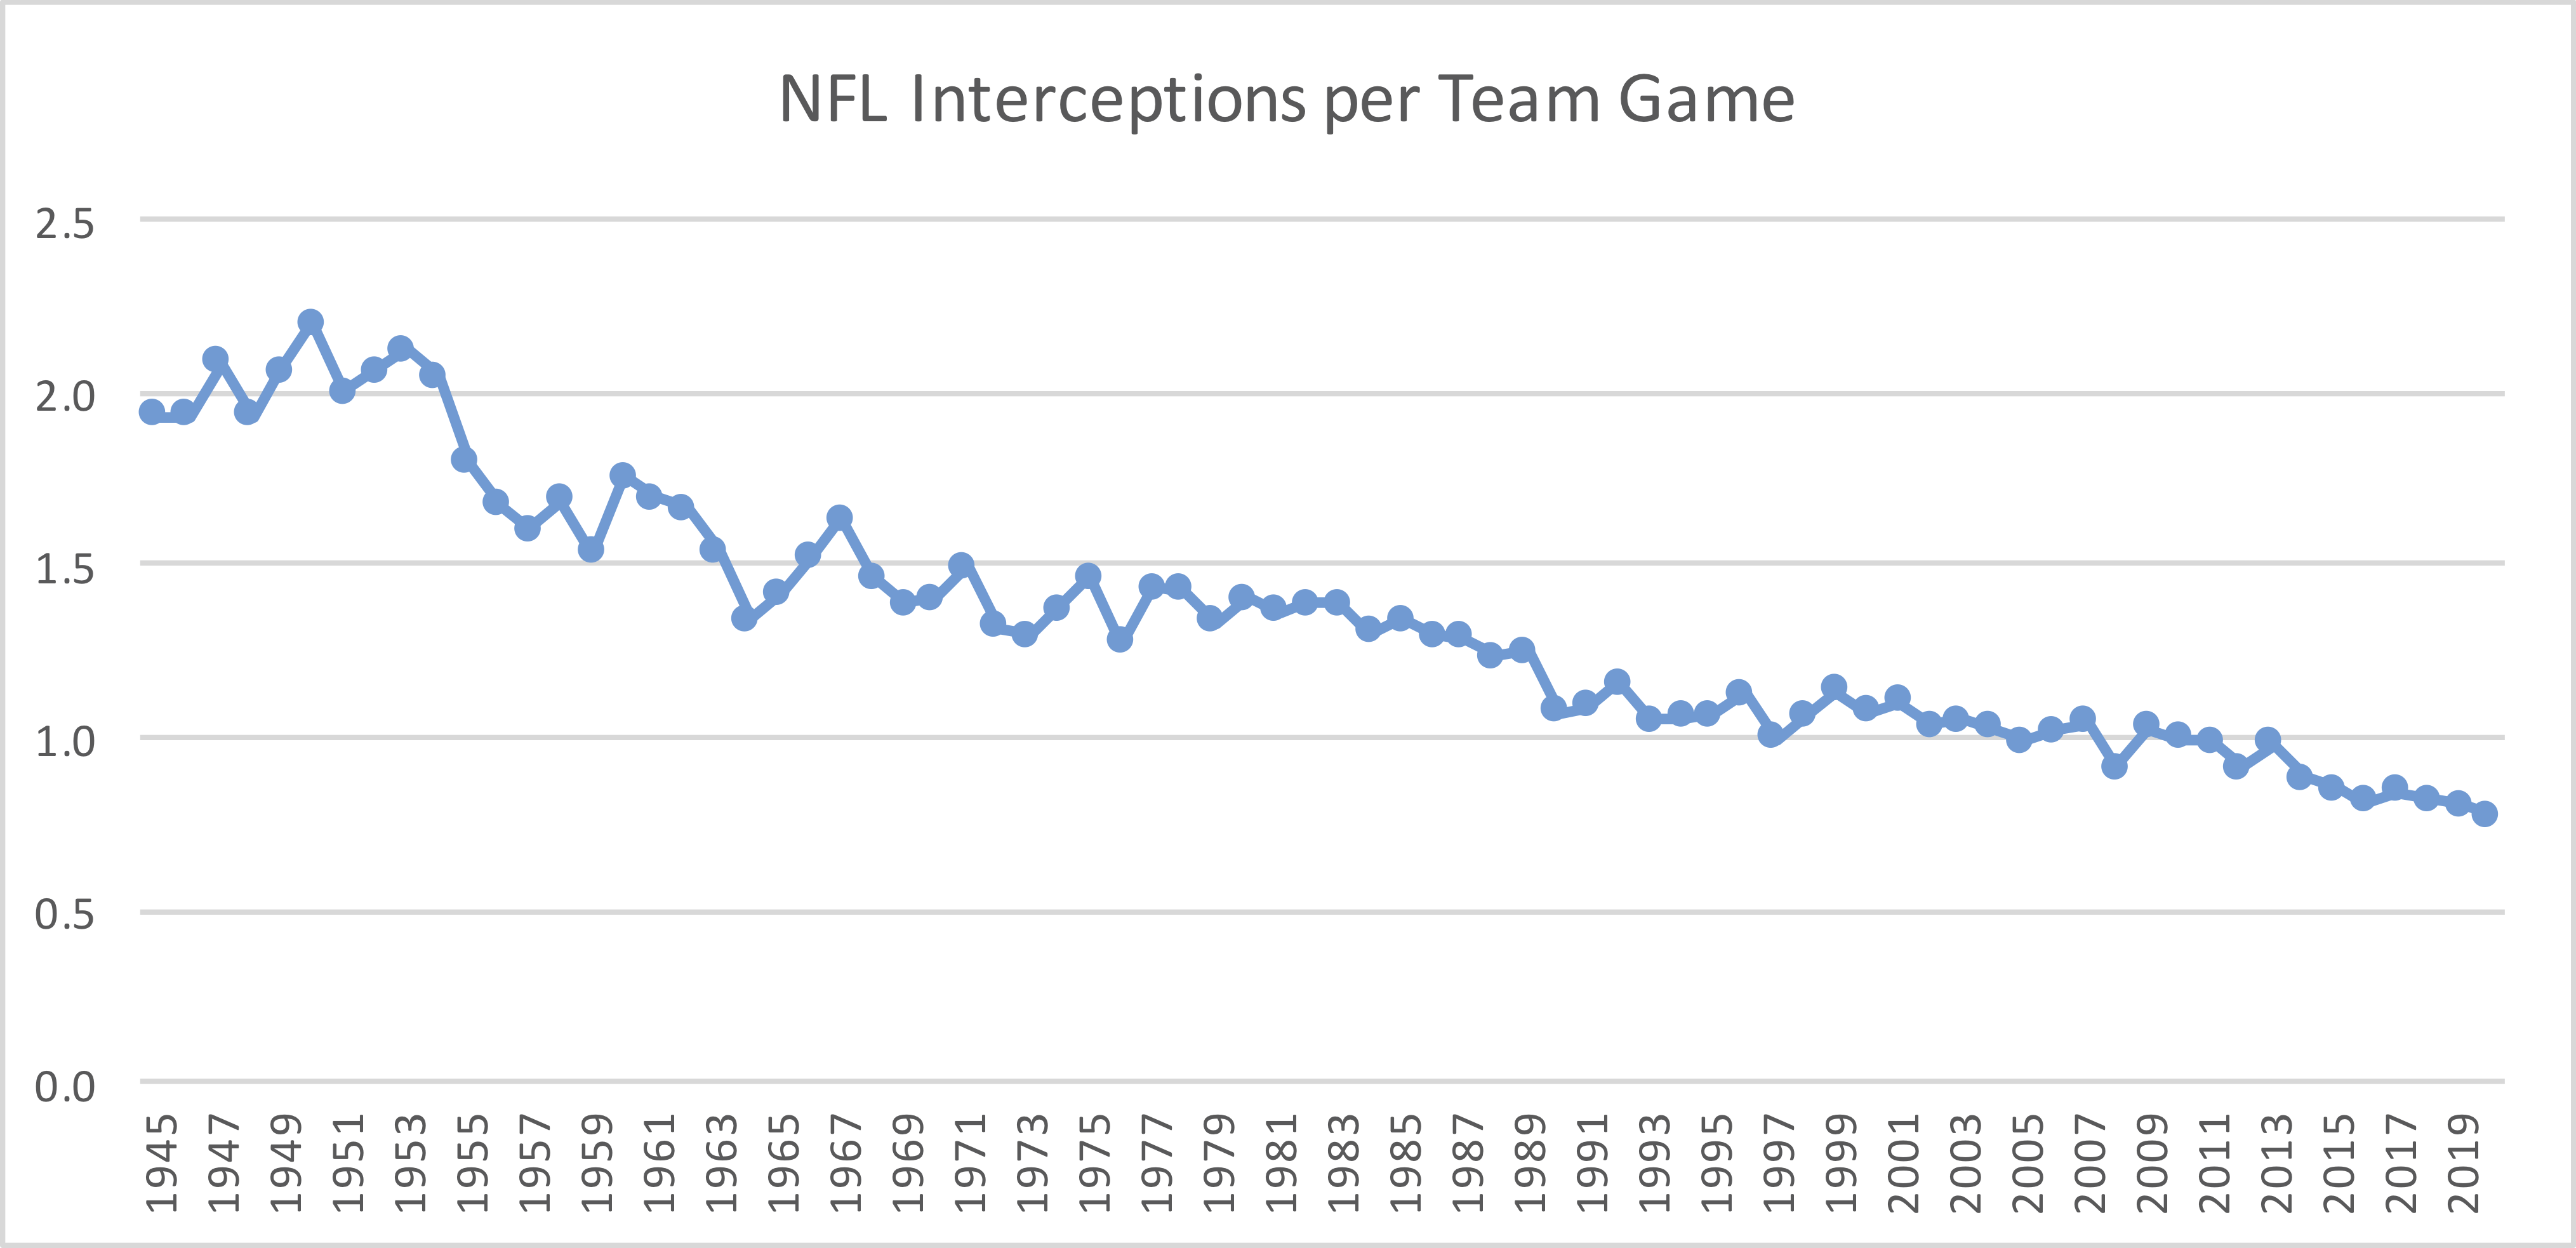
The NFL record by a defensive player for interceptions in a season is 14, set by Dick “Night Train” Lane in 1952. A bad faith argument sometimes notes how remarkable it was that Lane did that in a 12-game season, ignoring the fact that interceptions were more than three times more likely per pass attempt back in the early ’50s. And while pass attempts are going up, because the interception rate has dropped so significantly, the amount of interceptions in each game has significantly decreased over time:
When Lane intercepted 14 passes, the NFL average interception rate was 7.4% and his Rams faced 360 pass attempts. To try and make life fair across eras and teams (some defenses face lots of pass attempts, some face far fewer), let’s use a set of “baseline” numbers of a 3.5% league interception rate and a defense facing 500 passes. For Lane, this means we multiply 14 by (3.5% divided by 7.4%) and multiply that result by (500 divided by 360); that means Lane would have 9.2 interceptions in a more neutral environment. That is still a great number, but it’s not the best ever.
For a long time, the best mark belonged to Bill Dudley in 1946. Playing for the Steelers, Dudley had 10 interceptions when his team faced only 162 pass attempts! Of course, the average INT rate in 1946 was 9.1%, so that makes things just a bit less impressive. For Dudley, if we multiply 10 by (3.5% / 9.1%) x (500 / 162), we get an adjusted result of 11.9 interceptions. In other words, what Dudley did was slightly more impressive than Lane, even with 4 fewer interceptions, in large part because Dudley’s team faced less than half as many pass attempts!
One neat thing to keep in mind: you may not love my “baseline” numbers of 3.5% interception rate and 500 pass attempts. But changing those numbers does not change the order of the top seasons, just the magnitude. So even with different numbers, Dudley’s season will always top Lane’s.
In 2005, Ty Law had what looked to be the best interception season ever. Playing for the Jets, he picked off 10 passes at a time when the league average rate was just 3.1%, and New York faced only 463 passes. Law’s 10 interceptions pro-rated to 12.3 adjusted interceptions (10 x (3.5% / 3.1%) x (500 / 463) = 12.3). That mark stood the test of time for well over a decade, and it didn’t seem like it was going to be seriously challenged anytime soon. In 2019, Patriots cornerback Stephon Gilmore — en route to winning the AP DPOY award — led the NFL in adjusted interceptions with just 8.53. [1]He picked off 6 passes, tied with two other players for the lead league, but his Patriots faced only 536 passes, the lowest number of any player with six interceptions. The math: 6 x (3.5% / 2.3%) x (500 / 536) = 8.53 adjusted interceptions.
But in 2020, another pair of AFC East players did the unthinkable. In New England, Gilmore’s teammate J.C. Jackson intercepted 9 passes, with 3 coming in the 5 games Gilmore missed. That is a remarkable number, particularly since the Patriots faced only 494 pass attempts and the league average interception rate in 2020 was a minuscule 2.2%. Jackson had an adjusted interception total of 14.54, easily passing Law’s 2005 mark. Here’s another way to think about it how remarkable it was: there were only 395 interceptions in 2020, so Jackson actually was responsible for 1 in every 44 interceptions thrown in the NFL last season; in 2005, there were 506 interceptions thrown, so Law was responsible for 1 in every 51 interceptions. [2]In 1952, there were 297 interceptions, so Lane was responsible for 1 in every 21 interceptions thrown. But remember: there were only 12 teams back then, and getting 1 in every 21 interceptions in a … Continue reading
Jackson’s season should have been celebrated as one of the great defensive performances in modern history. Unfortunately, it was not only largely ignored, it wasn’t even the best defensive performance by a cornerback in his own division. Miami’s Xavien Howard had 10 interceptions last year! [3]So Howard was the man behind 1 in every 39.5 interceptions last year! The Dolphins faced more passes (545) than New England, but not enough to offset the extra pick; Howard had 14.65 adjusted interceptions — (10 x (3.5% / 2.2%) x (500 / 545) = 14.65) — making it the best season in NFL history by this methodology.
Here are the top 300 defensive interception performances in pro football history. As always, the table is fully sortable. And while Howard and Jackson didn’t quite have the McGwire/Sosa buzz during the season, that’s only because the modern game makes interceptions so difficult. Because after adjusting for difficulty level, I am not sure if anyone has ever done it any better.
| Rk | Name | Year | Team | INT | Opp Att | Lg INT Rate | Mult | Adjusted INTs |
|---|---|---|---|---|---|---|---|---|
| 1 | Xavien Howard | 2020 | MIA | 10 | 545 | 2.2% | 146.5% | 14.65 |
| 2 | J.C. Jackson | 2020 | NWE | 9 | 494 | 2.2% | 161.6% | 14.54 |
| 3 | Ty Law | 2005 | NYJ | 10 | 463 | 3.1% | 123% | 12.30 |
| 4 | Bill Dudley | 1946 | PIT | 10 | 162 | 9.1% | 119.3% | 11.93 |
| 5 | Deltha O'Neal | 2005 | CIN | 10 | 519 | 3.1% | 109.7% | 10.97 |
| 6 | Jack Butler | 1957 | PIT | 10 | 234 | 6.9% | 108.1% | 10.81 |
| 7 | Nnamdi Asomugha | 2006 | OAK | 8 | 410 | 3.2% | 134.5% | 10.76 |
| 8 | Aeneas Williams | 1994 | ARI | 9 | 465 | 3.1% | 119.5% | 10.76 |
| 9 | Paul Krause | 1964 | WAS | 12 | 406 | 4.8% | 89.4% | 10.73 |
| 10 | Asante Samuel | 2006 | NWE | 10 | 518 | 3.2% | 106.5% | 10.65 |
| 11 | Ed Reed | 2008 | BAL | 9 | 528 | 2.8% | 117.8% | 10.6 |
| 12 | Dan Sandifer | 1948 | WAS | 13 | 289 | 7.4% | 81.3% | 10.57 |
| 13 | Ronde Barber | 2001 | TAM | 10 | 493 | 3.4% | 105.4% | 10.54 |
| 14 | Champ Bailey | 2006 | DEN | 10 | 538 | 3.2% | 102.5% | 10.25 |
| 15 | Xavien Howard | 2018 | MIA | 7 | 508 | 2.4% | 145.3% | 10.17 |
| 16 | Tim Jennings | 2012 | CHI | 9 | 592 | 2.6% | 112.4% | 10.11 |
| 17 | Antonio Cromartie | 2007 | SDG | 10 | 555 | 3.1% | 100.6% | 10.06 |
| 18 | Jimmy Patton | 1958 | NYG | 11 | 311 | 6.2% | 91.5% | 10.06 |
| 19 | Darius Slay | 2017 | DET | 8 | 570 | 2.5% | 124.9% | 9.99 |
| 20 | Stevie Brown | 2012 | NYG | 8 | 534 | 2.6% | 124.6% | 9.96 |
| 21 | Mark Carrier | 1990 | CHI | 10 | 495 | 3.6% | 99.5% | 9.95 |
| 22 | Darryl Williams | 1997 | SEA | 8 | 462 | 3% | 124.4% | 9.95 |
| 23 | Emmitt Thomas | 1974 | KAN | 12 | 408 | 5.2% | 82.4% | 9.89 |
| 24 | Lem Barney | 1967 | DET | 10 | 312 | 5.7% | 98.9% | 9.89 |
| 25 | Jairus Byrd | 2009 | BUF | 9 | 519 | 3.1% | 109.4% | 9.85 |
| 26 | Mike Reinfeldt | 1979 | HOU | 12 | 465 | 4.6% | 81.8% | 9.82 |
| 27 | Ed Reed | 2004 | BAL | 9 | 501 | 3.2% | 109% | 9.81 |
| 28 | Tony Greene | 1974 | BUF | 9 | 311 | 5.2% | 108.1% | 9.73 |
| 29 | Marcus Peters | 2015 | KAN | 8 | 607 | 2.4% | 121% | 9.68 |
| 30 | Richard Sherman | 2013 | SEA | 8 | 524 | 2.8% | 120.7% | 9.65 |
| 31 | Everson Walls | 1982 | DAL | 7 | 289 | 4.4% | 137.6% | 9.63 |
| 32 | Darren Sharper | 2005 | MIN | 9 | 533 | 3.1% | 106.8% | 9.61 |
| 33 | Ryan McNeil | 1997 | STL | 9 | 543 | 3% | 105.8% | 9.52 |
| 34 | Sammy Baugh | 1943 | WAS | 11 | 193 | 10.5% | 86.3% | 9.49 |
| 35 | Lester Hayes | 1980 | OAK | 13 | 524 | 4.6% | 73% | 9.49 |
| 36 | Charles Woodson | 2009 | GNB | 9 | 540 | 3.1% | 105.1% | 9.46 |
| 37 | Richard Sherman | 2012 | SEA | 8 | 564 | 2.6% | 117.9% | 9.43 |
| 38 | Anthony Henry | 2001 | CLE | 10 | 552 | 3.4% | 94.1% | 9.41 |
| 39 | Kevin Byard | 2017 | TEN | 8 | 605 | 2.5% | 117.6% | 9.41 |
| 40 | Tony Parrish | 2003 | SFO | 9 | 514 | 3.3% | 104.4% | 9.39 |
| 41 | Patrick Peterson | 2012 | ARI | 7 | 497 | 2.6% | 133.8% | 9.37 |
| 42 | Pat Fischer | 1964 | STL | 10 | 389 | 4.8% | 93.4% | 9.34 |
| 43 | Casey Hayward | 2016 | SDG | 7 | 580 | 2.3% | 133% | 9.31 |
| 44 | Bill Bradley | 1972 | PHI | 9 | 318 | 5.3% | 103.3% | 9.3 |
| 45 | Night Train Lane | 1952 | RAM | 14 | 360 | 7.4% | 65.9% | 9.22 |
| 46 | Lindon Crow | 1956 | CRD | 11 | 287 | 7.3% | 83.4% | 9.17 |
| 47 | Monte Jackson | 1976 | RAM | 10 | 397 | 4.8% | 91% | 9.1 |
| 48 | Paul Krause | 1975 | MIN | 10 | 360 | 5.3% | 91% | 9.1 |
| 49 | Mel Blount | 1975 | PIT | 11 | 396 | 5.3% | 82.7% | 9.1 |
| 50 | Reggie Nelson | 2015 | CIN | 8 | 646 | 2.4% | 113.7% | 9.1 |
| 51 | Brian Russell | 2003 | MIN | 9 | 531 | 3.3% | 101% | 9.09 |
| 52 | Deltha O'Neal | 2001 | DEN | 9 | 515 | 3.4% | 100.9% | 9.08 |
| 53 | Mark McMillian | 1997 | KAN | 8 | 507 | 3% | 113.3% | 9.07 |
| 54 | Bobby Dillon | 1955 | GNB | 9 | 259 | 6.8% | 100% | 9 |
| 55 | Brian Kelly | 2002 | TAM | 8 | 510 | 3.1% | 112.4% | 8.99 |
| 56 | Dave Baker | 1960 | SFO | 10 | 293 | 6.7% | 89.7% | 8.97 |
| 57 | Ken Riley | 1976 | CIN | 9 | 364 | 4.8% | 99.2% | 8.93 |
| 58 | Ray Brown | 1974 | ATL | 8 | 302 | 5.2% | 111.4% | 8.91 |
| 59 | Darren Sharper | 2009 | NOR | 9 | 574 | 3.1% | 98.9% | 8.9 |
| 60 | Scott Case | 1988 | ATL | 10 | 504 | 3.9% | 88.7% | 8.87 |
| 61 | Quintin Demps | 2016 | HOU | 6 | 522 | 2.3% | 147.8% | 8.87 |
| 62 | Howard Hartley | 1951 | PIT | 10 | 266 | 7.4% | 88.7% | 8.87 |
| 63 | Damontae Kazee | 2018 | ATL | 7 | 585 | 2.4% | 126.2% | 8.83 |
| 64 | Eric Weddle | 2011 | SDG | 7 | 478 | 2.9% | 126% | 8.82 |
| 65 | Willie Williams | 1968 | NYG | 10 | 364 | 5.5% | 88.2% | 8.82 |
| 66 | Asante Samuel | 2009 | PHI | 9 | 580 | 3.1% | 97.9% | 8.81 |
| 67 | Everson Walls | 1981 | DAL | 11 | 511 | 4.3% | 79.7% | 8.77 |
| 68 | Jerry Norton | 1960 | STL | 10 | 300 | 6.7% | 87.6% | 8.76 |
| 69 | Mark Lee | 1986 | GNB | 9 | 448 | 4% | 97.3% | 8.76 |
| 70 | Thom Darden | 1974 | CLE | 8 | 308 | 5.2% | 109.2% | 8.74 |
| 71 | Jack Christiansen | 1957 | DET | 10 | 290 | 6.9% | 87.2% | 8.72 |
| 72 | Darren Sharper | 2000 | GNB | 9 | 557 | 3.3% | 96.6% | 8.69 |
| 73 | Tony Greene | 1977 | BUF | 9 | 316 | 5.7% | 96.4% | 8.68 |
| 74 | Trumaine Johnson | 2015 | STL | 7 | 597 | 2.4% | 123% | 8.61 |
| 75 | Bibbles Bawel | 1955 | PHI | 9 | 272 | 6.8% | 95.3% | 8.57 |
| 76 | Richard Johnson | 1990 | HOU | 8 | 460 | 3.6% | 107.1% | 8.57 |
| 77 | Charles Woodson | 2006 | GNB | 8 | 515 | 3.2% | 107.1% | 8.57 |
| 78 | Dick Westmoreland | 1967 | MIA | 10 | 349 | 5.9% | 85.7% | 8.57 |
| 79 | O.J. Atogwe | 2007 | STL | 8 | 523 | 3.1% | 106.8% | 8.54 |
| 80 | Stephon Gilmore | 2019 | NWE | 6 | 536 | 2.3% | 142.2% | 8.53 |
| 81 | Eric Turner | 1994 | CLE | 9 | 587 | 3.1% | 94.7% | 8.52 |
| 82 | Walt Harris | 2006 | SFO | 8 | 518 | 3.2% | 106.5% | 8.52 |
| 83 | Bobby Boyd | 1964 | BAL | 9 | 385 | 4.8% | 94.3% | 8.49 |
| 84 | Otto Schnellbacher | 1948 | NYY | 11 | 341 | 6.7% | 77% | 8.47 |
| 85 | Keith Lyle | 1997 | STL | 8 | 543 | 3% | 105.8% | 8.47 |
| 86 | Sam Madison | 1998 | MIA | 8 | 504 | 3.3% | 105.7% | 8.45 |
| 87 | Terrell Buckley | 1998 | MIA | 8 | 504 | 3.3% | 105.7% | 8.45 |
| 88 | Rashean Mathis | 2006 | JAX | 8 | 523 | 3.2% | 105.5% | 8.44 |
| 89 | Kwamie Lassiter | 2001 | ARI | 9 | 556 | 3.4% | 93.4% | 8.41 |
| 90 | Ty Law | 1998 | NWE | 9 | 570 | 3.3% | 93.4% | 8.41 |
| 91 | Charles Woodson | 2008 | GNB | 7 | 518 | 2.8% | 120.1% | 8.4 |
| 92 | Nick Collins | 2008 | GNB | 7 | 518 | 2.8% | 120.1% | 8.4 |
| 93 | Tory James | 2004 | CIN | 8 | 520 | 3.2% | 105% | 8.4 |
| 94 | Goose Gonsoulin | 1960 | DEN | 11 | 387 | 5.9% | 76.4% | 8.4 |
| 95 | Kyle Fuller | 2018 | CHI | 7 | 615 | 2.4% | 120% | 8.4 |
| 96 | A.J. Bouye | 2017 | JAX | 6 | 509 | 2.5% | 139.8% | 8.39 |
| 97 | Tom Keane | 1953 | BAL | 11 | 321 | 7.2% | 76% | 8.36 |
| 98 | Don Burroughs | 1960 | PHI | 9 | 283 | 6.7% | 92.8% | 8.36 |
| 99 | Nate Odomes | 1993 | BUF | 9 | 582 | 3.3% | 92.4% | 8.32 |
| 100 | Keith Lyle | 1996 | STL | 9 | 558 | 3.4% | 92.4% | 8.31 |
| 101 | Orlando Thomas | 1995 | MIN | 9 | 620 | 3.1% | 92.1% | 8.29 |
| 102 | Nathan Vasher | 2005 | CHI | 8 | 550 | 3.1% | 103.5% | 8.28 |
| 103 | Jack Christiansen | 1953 | DET | 12 | 354 | 7.2% | 68.9% | 8.27 |
| 104 | Fred Glick | 1963 | HOU | 12 | 424 | 6% | 68.9% | 8.27 |
| 105 | Tre'Davious White | 2019 | BUF | 6 | 553 | 2.3% | 137.8% | 8.27 |
| 106 | Rod Woodson | 1993 | PIT | 8 | 521 | 3.3% | 103.2% | 8.26 |
| 107 | Kenny Easley | 1984 | SEA | 10 | 521 | 4.1% | 82.4% | 8.24 |
| 108 | Johnny Robinson | 1970 | KAN | 10 | 408 | 5.2% | 82.4% | 8.24 |
| 109 | Ron Bolton | 1973 | NWE | 6 | 240 | 5.3% | 137.2% | 8.23 |
| 110 | Kwamie Lassiter | 1998 | ARI | 8 | 518 | 3.3% | 102.8% | 8.22 |
| 111 | Glover Quin | 2014 | DET | 7 | 592 | 2.5% | 117.4% | 8.22 |
| 112 | Tyrone Braxton | 1996 | DEN | 9 | 566 | 3.4% | 91.1% | 8.2 |
| 113 | Bill Bradley | 1971 | PHI | 11 | 407 | 5.8% | 74.4% | 8.18 |
| 114 | Dick Anderson | 1973 | MIA | 8 | 322 | 5.3% | 102.3% | 8.18 |
| 115 | Don Doll | 1949 | DET | 11 | 312 | 7.5% | 74.4% | 8.18 |
| 116 | Joey Browner | 1990 | MIN | 7 | 422 | 3.6% | 116.8% | 8.17 |
| 117 | Troy Polamalu | 2008 | PIT | 7 | 533 | 2.8% | 116.7% | 8.17 |
| 118 | Joe Lavender | 1976 | WAS | 8 | 354 | 4.8% | 102.1% | 8.16 |
| 119 | Lem Barney | 1969 | DET | 8 | 350 | 4.9% | 102% | 8.16 |
| 120 | Dick LeBeau | 1970 | DET | 9 | 371 | 5.2% | 90.6% | 8.15 |
| 121 | Doug Evans | 2001 | CAR | 8 | 510 | 3.4% | 101.9% | 8.15 |
| 122 | Eugene Robinson | 1993 | SEA | 9 | 595 | 3.3% | 90.4% | 8.14 |
| 123 | Will Sherman | 1955 | RAM | 11 | 351 | 6.8% | 73.8% | 8.12 |
| 124 | John Harris | 1981 | SEA | 10 | 502 | 4.3% | 81.2% | 8.12 |
| 125 | Corey Chavous | 2003 | MIN | 8 | 531 | 3.3% | 101% | 8.08 |
| 126 | Samari Rolle | 2000 | TEN | 7 | 466 | 3.3% | 115.4% | 8.08 |
| 127 | James Hunter | 1976 | DET | 7 | 313 | 4.8% | 115.4% | 8.08 |
| 128 | Dexter McCleon | 2000 | STL | 8 | 534 | 3.3% | 100.7% | 8.06 |
| 129 | Rod Woodson | 2002 | OAK | 8 | 570 | 3.1% | 100.5% | 8.04 |
| 130 | William Thomas | 1995 | PHI | 7 | 499 | 3.1% | 114.4% | 8.01 |
| 131 | Rosey Taylor | 1963 | CHI | 9 | 353 | 5.6% | 88.9% | 8 |
| 132 | Ed Reed | 2007 | BAL | 7 | 490 | 3.1% | 114% | 7.98 |
| 133 | Norb Hecker | 1956 | WAS | 8 | 240 | 7.3% | 99.7% | 7.98 |
| 134 | Lyle Blackwood | 1977 | BAL | 10 | 382 | 5.7% | 79.8% | 7.98 |
| 135 | Ed Reed | 2010 | BAL | 8 | 596 | 3% | 99.2% | 7.94 |
| 136 | Tom Janik | 1967 | BUF | 10 | 377 | 5.9% | 79.3% | 7.93 |
| 137 | Kurt Coleman | 2015 | CAR | 7 | 650 | 2.4% | 113% | 7.91 |
| 138 | Willie Clay | 1995 | DET | 8 | 580 | 3.1% | 98.4% | 7.87 |
| 139 | Nate Wright | 1976 | MIN | 7 | 323 | 4.8% | 111.8% | 7.83 |
| 140 | Ronnie Lott | 1991 | RAI | 8 | 513 | 3.5% | 97.5% | 7.8 |
| 141 | Mel Renfro | 1969 | DAL | 10 | 458 | 4.9% | 78% | 7.8 |
| 142 | Ryan McNeil | 2001 | SDG | 8 | 535 | 3.4% | 97.1% | 7.77 |
| 143 | Marcus Peters | 2016 | KAN | 6 | 598 | 2.3% | 129% | 7.74 |
| 144 | Asante Samuel | 2010 | PHI | 7 | 536 | 3% | 110.3% | 7.72 |
| 145 | Jimmy Allen | 1981 | DET | 9 | 475 | 4.3% | 85.8% | 7.72 |
| 146 | Ken Houston | 1971 | HOU | 9 | 354 | 5.8% | 85.5% | 7.7 |
| 147 | Bobby Boyd | 1965 | BAL | 9 | 400 | 5.1% | 85.4% | 7.69 |
| 148 | Dick Lynch | 1963 | NYG | 9 | 368 | 5.6% | 85.3% | 7.67 |
| 149 | Jack Butler | 1958 | PIT | 9 | 334 | 6.2% | 85.2% | 7.67 |
| 150 | Tom Keane | 1952 | DTX | 10 | 310 | 7.4% | 76.5% | 7.65 |
| 151 | Deron Cherry | 1988 | KAN | 7 | 410 | 3.9% | 109.1% | 7.63 |
| 152 | Thomas Howard | 2007 | OAK | 6 | 439 | 3.1% | 127.2% | 7.63 |
| 153 | Anthony Harris | 2019 | MIN | 6 | 601 | 2.3% | 126.8% | 7.61 |
| 154 | Larry Wilson | 1966 | STL | 10 | 443 | 5.2% | 75.9% | 7.59 |
| 155 | Frank Reagan | 1947 | NYG | 10 | 276 | 8.4% | 75.9% | 7.59 |
| 156 | Michael Griffin | 2008 | TEN | 7 | 575 | 2.8% | 108.2% | 7.57 |
| 157 | Darren Sharper | 2002 | GNB | 7 | 531 | 3.1% | 107.9% | 7.56 |
| 158 | Chris Gamble | 2005 | CAR | 7 | 528 | 3.1% | 107.8% | 7.55 |
| 159 | Stephon Gilmore | 2016 | BUF | 5 | 511 | 2.3% | 151% | 7.55 |
| 160 | Sam Madison | 1999 | MIA | 7 | 484 | 3.4% | 107.8% | 7.55 |
| 161 | Willie Williams | 1995 | PIT | 7 | 531 | 3.1% | 107.5% | 7.52 |
| 162 | Dave Whitsell | 1967 | NOR | 10 | 410 | 5.7% | 75.2% | 7.52 |
| 163 | Erik McMillan | 1988 | NYJ | 8 | 476 | 3.9% | 93.9% | 7.52 |
| 164 | Eric Weddle | 2017 | BAL | 6 | 569 | 2.5% | 125.1% | 7.5 |
| 165 | Felix Wright | 1989 | CLE | 9 | 540 | 3.9% | 83.1% | 7.48 |
| 166 | Marcus Coleman | 2003 | HOU | 7 | 502 | 3.3% | 106.9% | 7.48 |
| 167 | Barry Wilburn | 1987 | WAS | 9 | 527 | 4% | 83% | 7.47 |
| 168 | Gill Byrd | 1990 | SDG | 7 | 462 | 3.6% | 106.7% | 7.47 |
| 169 | Deion Sanders | 1993 | ATL | 7 | 505 | 3.3% | 106.5% | 7.46 |
| 170 | Carl Lee | 1988 | MIN | 8 | 480 | 3.9% | 93.2% | 7.45 |
| 171 | David Fulcher | 1989 | CIN | 8 | 482 | 3.9% | 93.1% | 7.45 |
| 172 | Ray Buchanan | 1994 | IND | 8 | 598 | 3.1% | 93% | 7.44 |
| 173 | Champ Bailey | 2005 | DEN | 8 | 613 | 3.1% | 92.9% | 7.43 |
| 174 | Aeneas Williams | 1995 | ARI | 6 | 461 | 3.1% | 123.8% | 7.43 |
| 175 | Minkah Fitzpatrick | 2019 | PIT | 5 | 514 | 2.3% | 148.3% | 7.41 |
| 176 | Joe Haden | 2019 | PIT | 5 | 514 | 2.3% | 148.3% | 7.41 |
| 177 | Don Paul | 1956 | CLE | 7 | 226 | 7.3% | 105.9% | 7.41 |
| 178 | Milt Davis | 1957 | BAL | 10 | 342 | 6.9% | 74% | 7.4 |
| 179 | Eugene Robinson | 1992 | SEA | 7 | 428 | 3.9% | 105.6% | 7.39 |
| 180 | Ronnie Lippett | 1986 | NWE | 8 | 473 | 4% | 92.1% | 7.37 |
| 181 | Jerry Davis | 1950 | CRD | 9 | 269 | 8% | 81.7% | 7.35 |
| 182 | Dominique Rodgers-Cromartie | 2016 | NYG | 6 | 630 | 2.3% | 122.5% | 7.35 |
| 183 | Mike Wagner | 1973 | PIT | 8 | 359 | 5.3% | 91.7% | 7.34 |
| 184 | Marcus Williams | 2015 | NYJ | 6 | 601 | 2.4% | 122.2% | 7.33 |
| 185 | Wayne Haddix | 1990 | TAM | 7 | 471 | 3.6% | 104.6% | 7.32 |
| 186 | Bob Jeter | 1967 | GNB | 8 | 337 | 5.7% | 91.5% | 7.32 |
| 187 | Gary Barbaro | 1977 | KAN | 8 | 333 | 5.7% | 91.5% | 7.32 |
| 188 | Darren Perry | 1994 | PIT | 7 | 532 | 3.1% | 104.5% | 7.31 |
| 189 | Gary Barbaro | 1980 | KAN | 10 | 523 | 4.6% | 73.1% | 7.31 |
| 190 | Willie Wood | 1962 | GNB | 9 | 355 | 6.1% | 81.2% | 7.31 |
| 191 | Lemar Parrish | 1979 | WAS | 9 | 470 | 4.6% | 80.9% | 7.29 |
| 192 | Dick Anderson | 1968 | MIA | 8 | 342 | 5.6% | 91% | 7.28 |
| 193 | Rod Perry | 1976 | RAM | 8 | 397 | 4.8% | 91% | 7.28 |
| 194 | Bob Nussbaumer | 1949 | CRD | 12 | 383 | 7.5% | 60.6% | 7.27 |
| 195 | Tony Parrish | 2002 | SFO | 7 | 552 | 3.1% | 103.8% | 7.27 |
| 196 | Bobby Dillon | 1957 | GNB | 9 | 314 | 6.9% | 80.6% | 7.25 |
| 197 | John Symank | 1957 | GNB | 9 | 314 | 6.9% | 80.6% | 7.25 |
| 198 | Thomas DeCoud | 2012 | ATL | 6 | 551 | 2.6% | 120.7% | 7.24 |
| 199 | Jake Scott | 1974 | MIA | 8 | 372 | 5.2% | 90.4% | 7.23 |
| 200 | Dean Derby | 1959 | PIT | 7 | 285 | 6% | 103.2% | 7.22 |
| 201 | Ashley Ambrose | 1996 | CIN | 8 | 571 | 3.4% | 90.3% | 7.22 |
| 202 | Ronnie Lott | 1986 | SFO | 10 | 604 | 4% | 72.2% | 7.22 |
| 203 | Spec Sanders | 1950 | NYY | 13 | 396 | 8% | 55.5% | 7.21 |
| 204 | Eddie Jackson | 2018 | CHI | 6 | 615 | 2.4% | 120% | 7.2 |
| 205 | Dennis Thurman | 1981 | DAL | 9 | 511 | 4.3% | 79.7% | 7.18 |
| 206 | Donnell Woolford | 1992 | CHI | 7 | 442 | 3.9% | 102.3% | 7.16 |
| 207 | Ray Ramsey | 1953 | CRD | 10 | 341 | 7.2% | 71.6% | 7.16 |
| 208 | Brig Owens | 1968 | WAS | 8 | 359 | 5.5% | 89.4% | 7.15 |
| 209 | Mike Sensibaugh | 1972 | KAN | 8 | 368 | 5.3% | 89.3% | 7.14 |
| 210 | Maurice Hurst | 1994 | NWE | 7 | 545 | 3.1% | 102% | 7.14 |
| 211 | Dwight Hicks | 1981 | SFO | 9 | 514 | 4.3% | 79.3% | 7.13 |
| 212 | Paul Krause | 1968 | MIN | 7 | 315 | 5.5% | 101.9% | 7.13 |
| 213 | Reggie Nelson | 2016 | OAK | 5 | 541 | 2.3% | 142.6% | 7.13 |
| 214 | Audray McMillian | 1992 | MIN | 8 | 508 | 3.9% | 89% | 7.12 |
| 215 | Richie Petitbon | 1963 | CHI | 8 | 353 | 5.6% | 88.9% | 7.11 |
| 216 | Devin McCourty | 2019 | NWE | 5 | 536 | 2.3% | 142.2% | 7.11 |
| 217 | J.C. Jackson | 2019 | NWE | 5 | 536 | 2.3% | 142.2% | 7.11 |
| 218 | Tashaun Gipson | 2014 | CLE | 6 | 587 | 2.5% | 118.4% | 7.11 |
| 219 | Brian Walker | 2000 | MIA | 7 | 530 | 3.3% | 101.5% | 7.1 |
| 220 | Patrick Surtain | 2003 | MIA | 7 | 529 | 3.3% | 101.4% | 7.1 |
| 221 | Night Train Lane | 1954 | CRD | 10 | 356 | 6.9% | 70.8% | 7.08 |
| 222 | Ed Reed | 2003 | BAL | 7 | 531 | 3.3% | 101% | 7.07 |
| 223 | Tom Colella | 1946 | CLE | 10 | 299 | 8.3% | 70.6% | 7.06 |
| 224 | Issiac Holt | 1986 | MIN | 8 | 494 | 4% | 88.2% | 7.06 |
| 225 | Spider Lockhart | 1968 | NYG | 8 | 364 | 5.5% | 88.2% | 7.05 |
| 226 | Don McNeal | 1982 | MIA | 4 | 226 | 4.4% | 176% | 7.04 |
| 227 | Bobby Dillon | 1953 | GNB | 9 | 312 | 7.2% | 78.2% | 7.04 |
| 228 | Xavier Rhodes | 2016 | MIN | 5 | 548 | 2.3% | 140.8% | 7.04 |
| 229 | Casey Hayward | 2012 | GNB | 6 | 568 | 2.6% | 117.1% | 7.03 |
| 230 | Aeneas Williams | 1997 | ARI | 6 | 491 | 3% | 117% | 7.02 |
| 231 | W.K. Hicks | 1970 | NYJ | 8 | 383 | 5.2% | 87.8% | 7.02 |
| 232 | Dre' Bly | 2005 | DET | 6 | 487 | 3.1% | 116.9% | 7.02 |
| 233 | Tom Flynn | 1984 | GNB | 9 | 551 | 4.1% | 77.9% | 7.01 |
| 234 | O.J. Atogwe | 2008 | STL | 5 | 444 | 2.8% | 140.1% | 7 |
| 235 | Joe Haden | 2010 | CLE | 6 | 507 | 3% | 116.6% | 7 |
| 236 | Mark Kelso | 1988 | BUF | 7 | 448 | 3.9% | 99.8% | 6.99 |
| 237 | Troy Polamalu | 2010 | PIT | 7 | 593 | 3% | 99.7% | 6.98 |
| 238 | Herm Edwards | 1982 | PHI | 5 | 285 | 4.4% | 139.6% | 6.98 |
| 239 | Kevin King | 2019 | GNB | 5 | 546 | 2.3% | 139.6% | 6.98 |
| 240 | Dave Grayson | 1968 | OAK | 10 | 446 | 5.6% | 69.8% | 6.98 |
| 241 | Jordan Hicks | 2016 | PHI | 5 | 553 | 2.3% | 139.5% | 6.98 |
| 242 | Brandon McDonald | 2008 | CLE | 5 | 446 | 2.8% | 139.4% | 6.97 |
| 243 | Don Doll | 1953 | WAS | 10 | 350 | 7.2% | 69.7% | 6.97 |
| 244 | Eric Allen | 1993 | PHI | 6 | 463 | 3.3% | 116.2% | 6.97 |
| 245 | Bobby Bryant | 1969 | MIN | 8 | 410 | 4.9% | 87.1% | 6.97 |
| 246 | Dainard Paulson | 1964 | NYJ | 12 | 473 | 6.4% | 58.1% | 6.97 |
| 247 | Henry Jones | 1992 | BUF | 8 | 520 | 3.9% | 86.9% | 6.96 |
| 248 | Dick LeBeau | 1965 | DET | 7 | 344 | 5.1% | 99.3% | 6.95 |
| 249 | Darryll Lewis | 1994 | HOU | 5 | 400 | 3.1% | 139% | 6.95 |
| 250 | Nate Clements | 2002 | BUF | 6 | 495 | 3.1% | 115.8% | 6.95 |
| 251 | Kermit Alexander | 1968 | SFO | 9 | 416 | 5.5% | 77.1% | 6.94 |
| 252 | Levi Johnson | 1976 | DET | 6 | 313 | 4.8% | 115.4% | 6.93 |
| 253 | Kurt Schulz | 2000 | DET | 7 | 544 | 3.3% | 98.9% | 6.92 |
| 254 | Don Doll | 1950 | DET | 12 | 381 | 8% | 57.7% | 6.92 |
| 255 | Frank Seno | 1947 | BOS | 10 | 303 | 8.4% | 69.1% | 6.91 |
| 256 | Dale Carter | 1992 | KAN | 7 | 458 | 3.9% | 98.7% | 6.91 |
| 257 | Bobby Watkins | 1982 | DET | 5 | 288 | 4.4% | 138.1% | 6.91 |
| 258 | Terry McDaniel | 1994 | RAI | 7 | 564 | 3.1% | 98.6% | 6.9 |
| 259 | Sammy Knight | 2001 | NOR | 6 | 452 | 3.4% | 114.9% | 6.9 |
| 260 | Deron Cherry | 1986 | KAN | 9 | 569 | 4% | 76.6% | 6.89 |
| 261 | Phillip Buchanon | 2003 | OAK | 6 | 467 | 3.3% | 114.9% | 6.89 |
| 262 | Otis Smith | 1995 | NYJ | 6 | 497 | 3.1% | 114.8% | 6.89 |
| 263 | Marcus Trufant | 2007 | SEA | 7 | 568 | 3.1% | 98.3% | 6.88 |
| 264 | Irv Comp | 1943 | GNB | 10 | 242 | 10.5% | 68.8% | 6.88 |
| 265 | Otto Schnellbacher | 1951 | NYG | 11 | 377 | 7.4% | 62.6% | 6.88 |
| 266 | Everson Walls | 1985 | DAL | 9 | 549 | 4.2% | 76.4% | 6.87 |
| 267 | Woodley Lewis | 1950 | RAM | 12 | 385 | 8% | 57.1% | 6.85 |
| 268 | Don Bishop | 1961 | DAL | 8 | 326 | 6.3% | 85.6% | 6.85 |
| 269 | Lemar Parrish | 1980 | WAS | 7 | 392 | 4.6% | 97.6% | 6.83 |
| 270 | Ken Stone | 1978 | STL | 9 | 428 | 5.4% | 75.7% | 6.81 |
| 271 | W.K. Hicks | 1965 | HOU | 9 | 416 | 5.6% | 75.7% | 6.81 |
| 272 | Aqib Talib | 2010 | TAM | 6 | 521 | 3% | 113.5% | 6.81 |
| 273 | Dave Waymer | 1986 | NOR | 9 | 576 | 4% | 75.7% | 6.81 |
| 274 | Kyle Arrington | 2011 | NWE | 7 | 619 | 2.9% | 97.3% | 6.81 |
| 275 | Greg Jackson | 1994 | PHI | 6 | 490 | 3.1% | 113.4% | 6.81 |
| 276 | Bob Forte | 1947 | GNB | 9 | 277 | 8.4% | 75.6% | 6.8 |
| 277 | Frank Reagan | 1948 | NYG | 9 | 311 | 7.4% | 75.6% | 6.8 |
| 278 | Darrelle Revis | 2009 | NYJ | 6 | 501 | 3.1% | 113.3% | 6.8 |
| 279 | Jim Cason | 1949 | SFO | 9 | 318 | 7.3% | 75.5% | 6.8 |
| 280 | Tre Boston | 2017 | LAC | 5 | 524 | 2.5% | 135.8% | 6.79 |
| 281 | Eric Allen | 1989 | PHI | 8 | 529 | 3.9% | 84.9% | 6.79 |
| 282 | Pat Fischer | 1963 | STL | 8 | 370 | 5.6% | 84.8% | 6.78 |
| 283 | Darius Leonard | 2019 | IND | 5 | 562 | 2.3% | 135.6% | 6.78 |
| 284 | Cedric Brown | 1981 | TAM | 9 | 541 | 4.3% | 75.3% | 6.78 |
| 285 | Devin McCourty | 2010 | NWE | 7 | 611 | 3% | 96.8% | 6.78 |
| 286 | Reshad Jones | 2015 | MIA | 5 | 542 | 2.4% | 135.5% | 6.78 |
| 287 | Merton Hanks | 1997 | SFO | 6 | 509 | 3% | 112.9% | 6.77 |
| 288 | Tommy James | 1950 | CLE | 9 | 292 | 8% | 75.3% | 6.77 |
| 289 | Darren Carrington | 1993 | SDG | 7 | 556 | 3.3% | 96.7% | 6.77 |
| 290 | Ray Buchanan | 1998 | ATL | 7 | 551 | 3.3% | 96.6% | 6.77 |
| 291 | Ha Ha Clinton-Dix | 2016 | GNB | 5 | 571 | 2.3% | 135.1% | 6.76 |
| 292 | Mario Clark | 1977 | BUF | 7 | 316 | 5.7% | 96.4% | 6.75 |
| 293 | Rolland Lawrence | 1975 | ATL | 9 | 437 | 5.3% | 74.9% | 6.74 |
| 294 | Mel Renfro | 1964 | DAL | 7 | 377 | 4.8% | 96.3% | 6.74 |
| 295 | Nate Clements | 2004 | BUF | 6 | 486 | 3.2% | 112.4% | 6.74 |
| 296 | Tommy Morrow | 1962 | OAK | 10 | 371 | 7% | 67.4% | 6.74 |
| 297 | Tramon Williams | 2010 | GNB | 6 | 527 | 3% | 112.2% | 6.73 |
| 298 | Charlie Ford | 1972 | CHI | 7 | 342 | 5.3% | 96.1% | 6.72 |
| 299 | Jimmy Hitchcock | 1998 | MIN | 7 | 555 | 3.3% | 96% | 6.72 |
| 300 | Emlen Tunnell | 1957 | NYG | 6 | 226 | 6.9% | 111.9% | 6.72 |
As always, please leave your thoughts in the comments.
References
| ↑1 | He picked off 6 passes, tied with two other players for the lead league, but his Patriots faced only 536 passes, the lowest number of any player with six interceptions. |
|---|---|
| ↑2 | In 1952, there were 297 interceptions, so Lane was responsible for 1 in every 21 interceptions thrown. But remember: there were only 12 teams back then, and getting 1 in every 21 interceptions in a 12-team league is less impressive than 1 in every 44 interceptions in a 32-team league. |
| ↑3 | So Howard was the man behind 1 in every 39.5 interceptions last year! |