To pick six, or not to pick six.
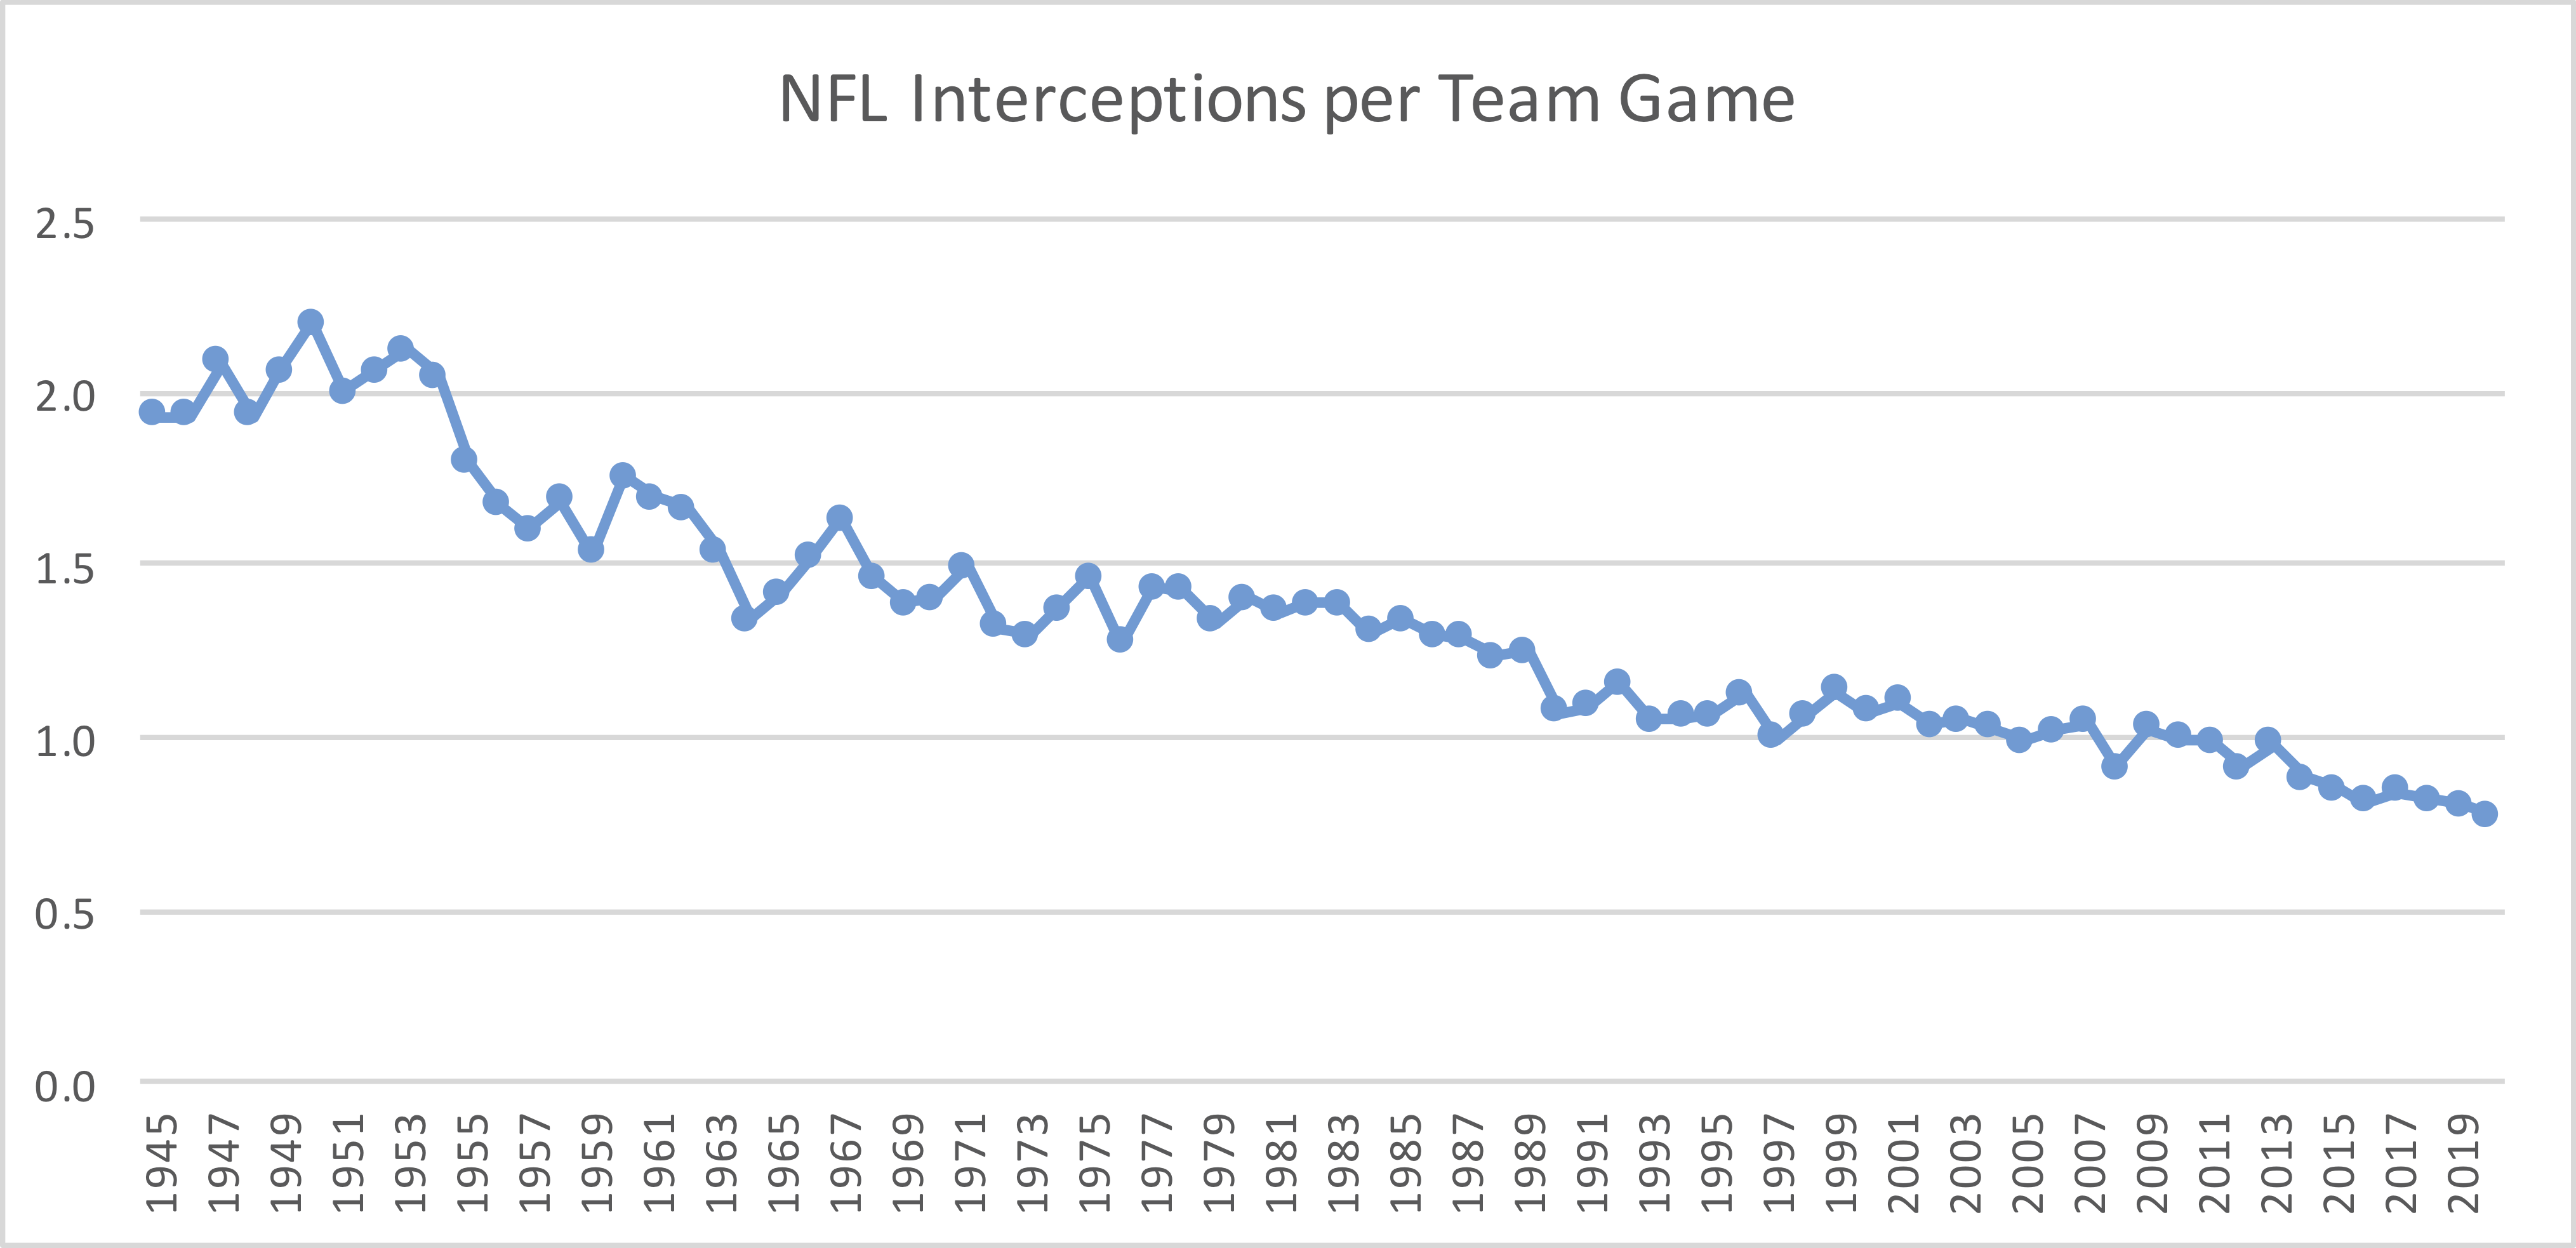
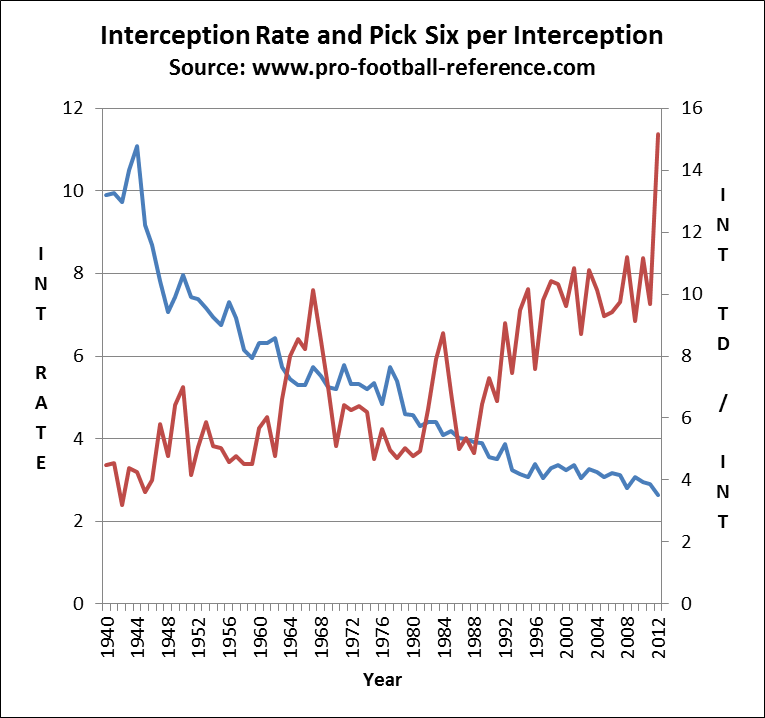
Three years ago to the day, I crunched the numbers to see which quarterbacks had thrown the most pick sixes thrown in NFL history. With three more years of data, a robust play-by-play database, and, ya know, Matt Schaub, I figured it was time for an update. In case you haven’t noticed, Schaub became the first player to ever throw pick sixes (picks six?) in four straight games, and then on Sunday, T.J. Yates got the Texans into the record books as Houston had an interception returned for a touchdown in five straight games. But I thought it would be fun to look at the career leaders in pick sixes (and remind you that I discussed the rising rate of interception scores in the offseason).
Nobody has exact pick six data available, but we can do a reasonably job of answering the question of who has had the most passes returned for touchdowns in league history. That’s because we have:
- Scoring logs for all scores, showing all interceptions returned for a touchdown, dating back to 1940
- Play-by-play logs for all players dating back to 1999. So we have all the information we need from that point through week six of the 2013 season.
- Individual game logs for all players, showing all interceptions thrown dating back to 1960.
For all pick sixes thrown since 1999, we have the precise data. For any game from 1960 to 1998, we can do a very good job approximating who threw the pick-six. Most of the time, only one quarterback will throw an interception in any given team game. Fifty years from now, if you look at this box score from week six, you will be able to know for sure that Peyton Manning threw the interception that Paul Posluszny returned for a touchdown. The Broncos threw just one interception, and it was by Manning, so Manning must have thrown the pick-six. It doesn’t matter if the team has thrown five interceptions, as long as all were thrown by the same guy, such as Keith Null against the Titans in 2009.
The problem games are the ones where multiple players, usually quarterbacks, threw interceptions. For example, the record for defensive interception returns for touchdowns in a game is four, set by the Seattle Seahawks in 1984 against Kansas City. If you look at the boxscore, you’ll see that Todd Blackledge threw three interceptions, Bill Kenney threw two, and Sandy Osiecki added a sixth. So what do we do? Award Blackledge 2 pick sixes, Kenney 1.33, and Osiecky 0.67; obviously this isn’t perfect, but over the course of a player’s career, I think this will work well as an approximation. Because I’m running low on time, I’m going to just ignore pre-1960 data, although you could piece it together at the old link since obviously nothing has changed.
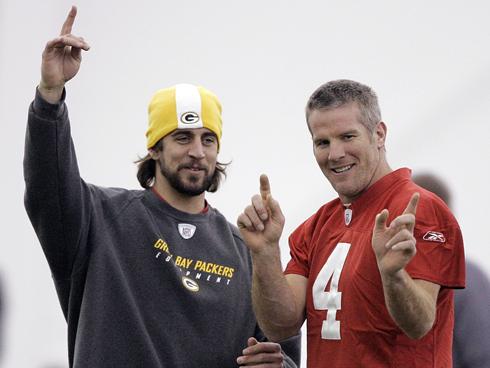
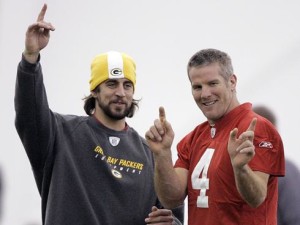
The table below includes all players who threw at least five pick sixes since 1960. It includes all postseason data, and unsurprisingly, Brett Favre is the career leader. He threw 10,960 career passes (including the playoffs), so he only threw a pick six on 0.32% of his passes (the leader in that category is Chris Redman, who threw a pick six once every 100 passes). Favre threw 366 career interceptions (again, including the playoffs), so he threw a pick six on “only” 9.6% of his interceptions. If you’re curious, Aaron Rodgers has thrown just one pick six in his entire career. That gives him a rate 0.032 pick sixes per pass attempt, the lowest among all passes with 1500 attempts since 1960.
[continue reading…]

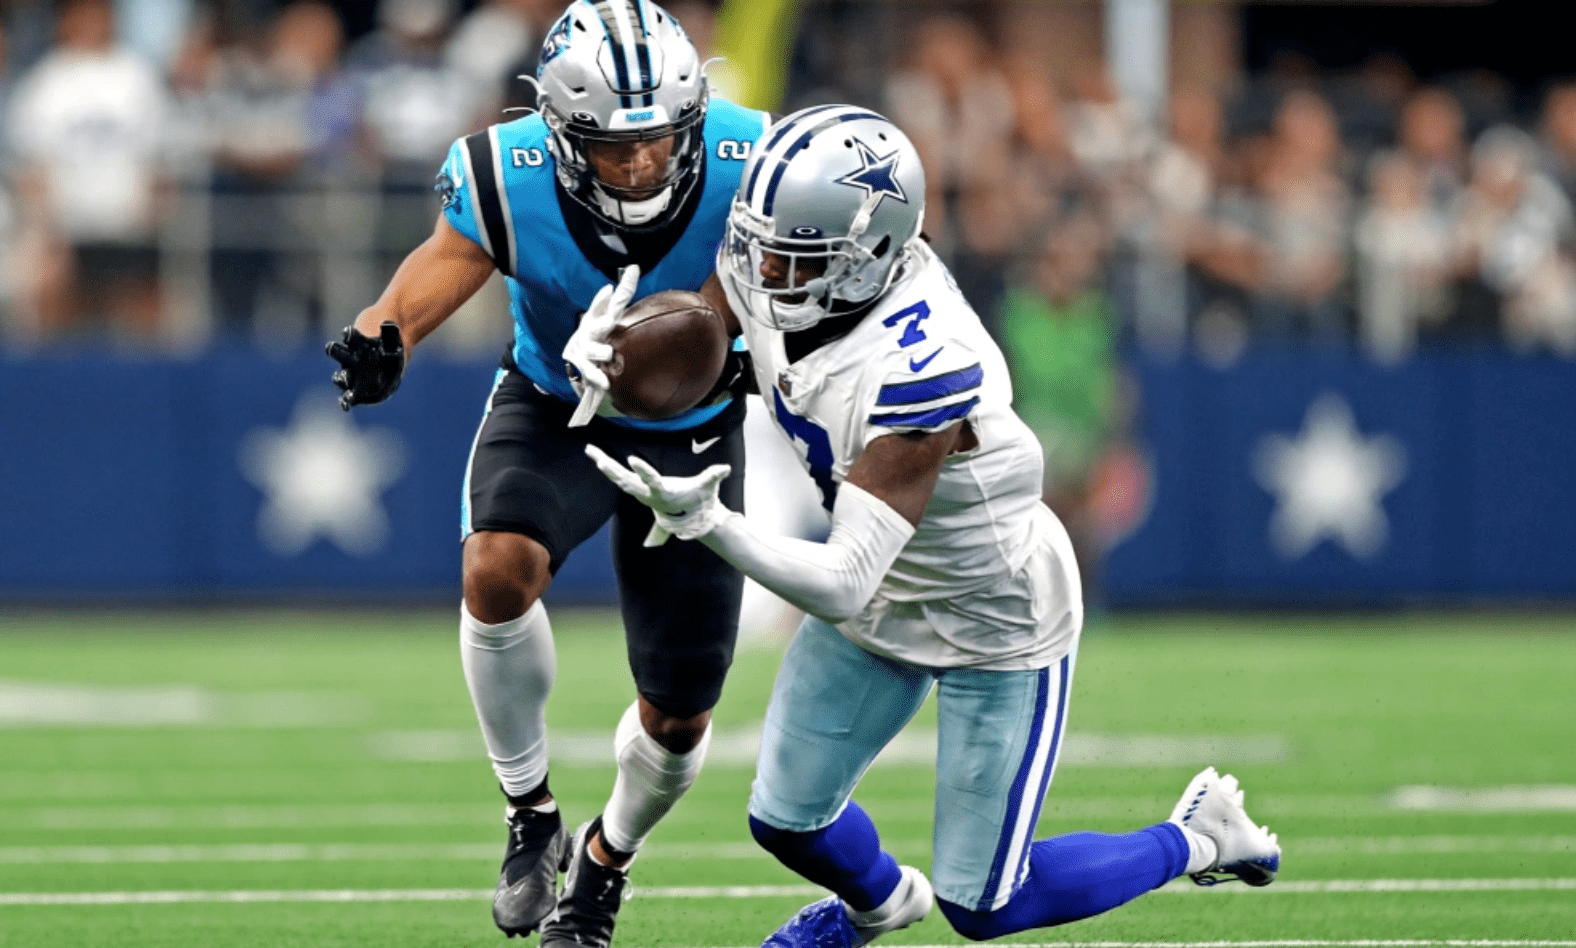 Cowboys cornerback Trevon Diggs has recorded 11 interceptions through 15 team games this season. That’s already the most in the NFL by any player since 40 years ago, when another Dallas corner — Everson Walls — also had eleven picks. Last year, I wrote about Xavien Howard and J.C. Jackson, the two AFC East cornerbacks who were doing something pretty remarkable. Both players had absurdly high interception numbers given the context of the modern game, which involves adjusting for era.