≡ Menu

Cincinnati added not only a familiar weapon, but one with a great name.

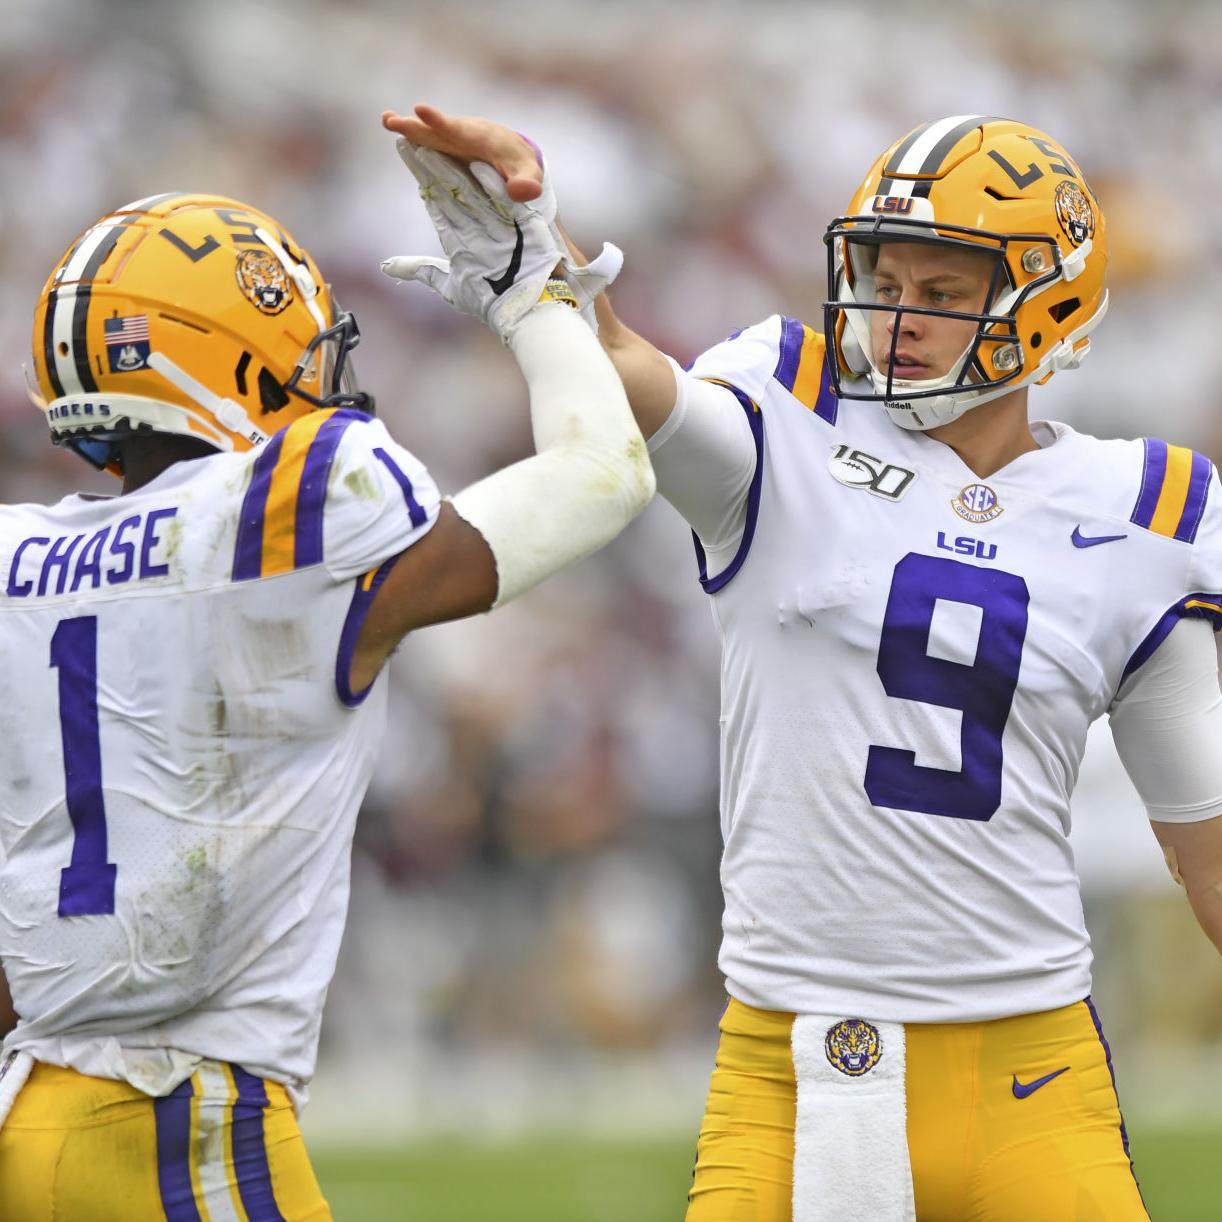
One of the most unique parts of the 2021 NFL Draft was the reuniting of college teammates in the passing game. The Cincinnati Bengals drafted LSU quarterback Joe Burrow first overall last season; holding the 5th overall selection this year, Burrow was rumored to be pushing his organization to draft his former teammate, Tigers WR Ja’Marr Chase. The Bengals did in fact pull the trigger on Chase, making them the extremely rare combination of quarterback and receiver to get drafted out of the same college and to the same team in the first round in back to back years.

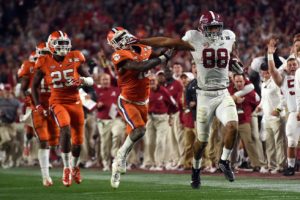
But it didn’t stop there.  With the very next pick, Miami drafted Alabama WR Jaylen Waddle, a year after drafting Crimson Tide quarterback Tua Tagovailoa with the fifth overall pick.  But it didn’t stop there: Alabama WR DeVonta Smith was selected by the Eagles with the 10th overall pick, and that reunites him with Jalen Hurts, the Eagles starting quarterback and a member of the 2017 and 2018 Crimson Tide teams. [continue reading…]

{ 12 comments }

Five players from LSU and four players from Alabama were drafted in the first round of the 2020 NFL Draft last night, the latest in a long line of draft dominance from two of the powerhouses of college football. In addition, another 6 players from the SEC had their names called during the first round: two from Georgia, two from Auburn, and one from both Florida and South Carolina. That gave the conference a record 15 players selected in the first round of the 2020 NFL Draft.

The previous record for players from one conference getting selected in first round of an NFL Draft was 12, set by the ACC in 2006 and matched by the SEC in both 2013 and 2017. [1]If you wanted to be cheekyy, and I would expect nothing less out of you, the schools in the current SEC also had 13 players drafted in 2011… when there were 10 players from the SEC drafted in … Continue reading For as long as I can remember — and, assuredly, for longer than that — SEC fans have boasted about the football talent within its conference. At times, the reputation has exceeded the results. But in recent years, there’s no question that the draft has become dominated by the conference. How much more dominant is the SEC at the top of the NFL Draft relative to prior years? [continue reading…]

References

References
1 If you wanted to be cheekyy, and I would expect nothing less out of you, the schools in the current SEC also had 13 players drafted in 2011… when there were 10 players from the SEC drafted in the first round, along with three others from Texas A&M and Missouri, Big 12 schools that now play in the SEC. One could also play this game with the Big 10 and the 1963 NFL draft, when among the first 32 players were 9 players from Big 10 schools, plus four more from Penn State and Maryland.
{ 0 comments }

Through 14 games this season, Alabama outscored its opponents by 31.5 points per game. Last night, in the most shocking national championship game I can remember, Clemson dominated Alabama in historic fashion. The Tigers beat Alabama 44-16, a 28-point margin of victory against a Nick Saban Alabama team that in 12 seasons had never lost a game by more than 14 points.

No team in NFL history has outscored opponents by 20 points per game and then lost a playoff game by 20+ points. The closest comparisons:

  • The 1967 Raiders outscored opponents by 16.8 points per game. Oakland defeated Houston 40-7, to up its average points differential per game to 17.9 through 15 games. Then, in the Super Bowl against the Packers, Oakland lost by 19 points, 33-14.
  • The 1969 Vikings outscored opponents by 17.6 points per game.  After a couple of close playoff wins, Minnesota lost Super Bowl IV by 16 points, 23-7.

In more recent times: the 2012 Patriots outscored opponents by 14.1 points and lost in the playoffs by 15 points, the 2013 Broncos outscored opponents by 12.9 points and lost by 35 points, and the 2011 Packers outscored opponents by 12.6 points and lost by 17 points.

My first reaction was to think of the 1983 Redskins: that year, Washington outscored opponents by 13.1 points and lost by 29 points.

What I wanted to do was plot team points differential in the regular season against each team’s worst playoff loss.  I plotted regular season points differential on the X-Axis and worst playoff margin on the Y-Axis; then I realized we just want to focus on the bottom right quadrant of that graph (positive regular season points differential, negative playoff margin).  So here is that bottom right quadrant of the graph: [continue reading…]

{ 0 comments }

The college football regular season is over, with the exception of Army/Navy in two weeks. Below are the final ratings prior to the conference championship games: [continue reading…]

{ 0 comments }

Alabama is the best team in college football, and maybe the best team in a generation of college football.

Clemson is fantastic, and is the second best team in college football. A Crimson Tide/Tigers clash in the playoff for a fourth straight year is not going to surprise anyone.

Notre Dame is 10-0 and will make the playoff assuming the Irish can handle Syracuse and USC, two average teams.

That leaves one final spot for the playoff. Ohio State and Michigan are both 9-1 and will play in two weeks. The Buckeyes and Wolverines face Maryland and Indiana this week, so they should be 10-1 as they enter The Big Game for the final week of the regular season. The winner will have the inside track for that 4th spot, assuming they can handle Big 10 West division winner Northwestern in Indianapolis.

The Big 12 also has a pair of 1-loss teams in 9-1 Oklahoma and 8-1 West Virginia (due to Hurricane Florence, the West Virginia game against N.C. State was canceled). Michigan’s one loss was in South Bend, a better loss than Oklahoma’s neutral site loss to Texas. Oklahoma has arguably faced a tougher schedule and it will only get tougher: the Sooners will have to face West Virginia in Morgantown, and then possibly a rematch with West Virginia (or Iowa State) in the Big 12 title game. There seems to be no momentum for the Committee to vault a 12-1 Oklahoma over a 12-1 Michigan, but I suppose it’s at least on the table.

But both the Big 10 and Big 12 will have the possibility of a 1-loss champion, which will lead to some interesting debates for the final spot. My hunch is that the Committee would rank the 1-loss teams in the following order:

1. Michigan
2. Oklahoma
3. Ohio State
4. West Virginia
5. Washington State

Below are the single game results from week 10. As always thanks to Dr. Peter R. Wolfe for providing the weekly game logs.

DateTm_ConfPFOppPAH/RW/LDiffMOVOpp_ConfSOSSRS
11-10-2018Minnesota_B1041Purdue10HomeWin3126B1054.480.4
11-10-2018Alabama_SEC24Mississippi St0HomeWin2421SEC58.879.8
11-10-2018Ohio State_B1026Michigan St6RoadWin2023B1054.477.4
11-10-2018West Virginia_B1247TCU10HomeWin3729B1247.976.9
11-10-2018Clemson_ACC27Boston College7RoadWin2023ACC51.574.5
11-10-2018Washington St_P1231Colorado7RoadWin2425.5P1245.671.1
11-10-2018Tennessee_SEC24Kentucky7HomeWin1714SEC56.270.2
11-10-2018Georgia_SEC27Auburn10HomeWin1714SEC54.168.1
11-10-2018Pittsburgh_ACC52Virginia Tech22HomeWin3025.5ACC41.166.6
11-09-2018Boise St_MWC24Fresno St17HomeWin77MWC59.566.5
11-10-2018Texas_B1241Texas Tech34RoadWin710B1256.466.4
11-10-2018Northwestern_B1014Iowa10RoadWin47B1058.665.6
11-10-2018Oklahoma St_B1247Oklahoma48RoadLoss-10B1265.265.2
11-10-2018Notre Dame_IND42Florida St13HomeWin2925ACC4065
11-07-2018Northern Illinois_MAC38Toledo15HomeWin2320MAC43.263.2
11-10-2018Arkansas St_SUN44Coastal Car.16RoadWin2827.5SUN34.562
11-10-2018Florida_SEC35South Carolina31HomeWin47SEC54.361.3
11-10-2018Penn State_B1022Wisconsin10HomeWin129B1052.261.2
11-10-2018Michigan_B1042Rutgers7RoadWin3531B1029.960.9
11-10-2018Texas A&M_SEC38Mississippi24HomeWin1411SEC49.360.3
11-10-2018Temple_Amer59Houston49RoadWin1013Amer46.559.5
11-10-2018Troy_SUN35Georgia Southern21RoadWin1417SUN42.559.5
11-08-2018Wake Forest_ACC27North Carolina St23RoadWin47ACC51.758.7
11-10-2018Utah St_MWC62San José St24HomeWin3829.5MWC29.158.6
11-10-2018Nevada_MWC49Colorado St10HomeWin3930MWC27.657.6
11-09-2018Syracuse_ACC54Louisville23HomeWin3126ACC31.357.3
11-10-2018Mississippi St_SEC0Alabama24RoadLoss-24-21SEC7857
11-10-2018Memphis_Amer47Tulsa21HomeWin2623Amer3457
11-10-2018Stanford_P1248Oregon St17HomeWin3126P1230.756.7
11-10-2018Georgia Tech_ACC27Miami FL21HomeWin67ACC49.656.6
11-10-2018Missouri_SEC33Vanderbilt28HomeWin57SEC49.356.3
11-10-2018Utah_P1232Oregon25HomeWin77P1249.356.3
11-10-2018Iowa St_B1228Baylor14HomeWin1411B1245.156.1
11-06-2018Buffalo_MAC48Kent St14HomeWin3427.5MAC27.955.4
11-10-2018Auburn_SEC10Georgia27RoadLoss-17-14SEC6955
11-10-2018Florida Int'l_CUSA45Texas-San Antonio7RoadWin3832.5CUSA21.854.3
11-10-2018California_P1215Southern Cal14RoadWin17P1247.254.2
11-10-2018Eastern Michigan_MAC27Akron7HomeWin2017MAC36.153.1
11-10-2018Virginia_ACC45Liberty24HomeWin2118IND34.652.6
11-10-2018Nebraska_B1054Illinois35HomeWin1916B1036.652.6
11-10-2018Appalachian St_SUN38Texas St-San Marcos7RoadWin3129SUN23.252.2
11-10-2018Vanderbilt_SEC28Missouri33RoadLoss-5-7SEC59.152.1
11-10-2018Oklahoma_B1248Oklahoma St47HomeWin10B1251.151.1
11-10-2018Wisconsin_B1010Penn State22RoadLoss-12-9B106051
11-10-2018Arkansas_SEC17LSU24HomeLoss-7-10SEC60.950.9
11-10-2018Louisiana-Monroe_SUN38South Alabama10RoadWin2827.5SUN22.950.4
11-10-2018Oregon_P1225Utah32RoadLoss-7-7P1257.450.4
11-10-2018Air Force_MWC42New Mexico24HomeWin1815MWC35.350.3
11-10-2018South Carolina_SEC31Florida35RoadLoss-4-7SEC56.949.9
11-10-2018UCLA_P1228Arizona St31RoadLoss-30P1249.749.7
11-10-2018Indiana_B1034Maryland32HomeWin20B1049.349.3
11-10-2018LSU_SEC24Arkansas17RoadWin710SEC3949
11-10-2018Boston College_ACC7Clemson27HomeLoss-20-23ACC71.848.8
11-10-2018Cincinnati_Amer35South Florida23HomeWin129Amer39.348.3
11-10-2018UNLV_MWC27San Diego St24RoadWin37MWC41.248.2
11-10-2018Navy_Amer24Central Florida35RoadLoss-11-8Amer56.148.1
11-10-2018Brigham Young_IND35Massachusetts16NeutWin1919IND28.447.4
11-10-2018Old Dominion_CUSA34North Texas31HomeWin30CUSA47.247.2
11-09-2018Fresno St_MWC17Boise St24RoadLoss-7-7MWC54.147.1
11-10-2018Kansas St_B1221Kansas17HomeWin47B1239.846.8
11-10-2018Baylor_B1214Iowa St28RoadLoss-14-11B1257.846.8
11-10-2018Southern Miss_CUSA23UAB26RoadLoss-30CUSA46.246.2
11-10-2018Texas Tech_B1234Texas41HomeLoss-7-10B1256.146.1
11-10-2018Mississippi_SEC24Texas A&M38RoadLoss-14-11SEC56.745.7
11-10-2018Maryland_B1032Indiana34RoadLoss-20B1045.345.3
11-07-2018Miami OH_MAC30Ohio U.28HomeWin20MAC45.245.2
11-10-2018South Florida_Amer23Cincinnati35RoadLoss-12-9Amer53.444.4
11-10-2018Iowa_B1010Northwestern14HomeLoss-4-7B1051.144.1
11-10-2018Bowling Green_MAC24Central Michigan13RoadWin1114MAC29.943.9
11-10-2018Marshall_CUSA30UNC-Charlotte13HomeWin1714CUSA29.943.9
11-10-2018Duke_ACC42North Carolina35HomeWin77ACC3643
11-10-2018North Carolina_ACC35Duke42RoadLoss-7-7ACC5043
11-10-2018Miami FL_ACC21Georgia Tech27RoadLoss-6-7ACC49.342.3
11-10-2018Arizona St_P1231UCLA28HomeWin30P1241.741.7
11-07-2018Ohio U._MAC28Miami OH30RoadLoss-20MAC41.341.3
11-10-2018Central Florida_Amer35Navy24HomeWin118Amer33.241.2
11-10-2018Florida Atlantic_CUSA34Western Kentucky15HomeWin1916CUSA24.640.6
11-10-2018Louisiana-Lafayette_SUN36Georgia St22HomeWin1411SUN29.240.2
11-10-2018Middle Tennessee St_CUSA48UTEP32RoadWin1619CUSA20.439.4
11-10-2018Michigan St_B106Ohio State26HomeLoss-20-23B1061.538.5
11-10-2018Southern Cal_P1214California15HomeLoss-1-7P1245.138.1
11-10-2018Rutgers_B107Michigan42HomeLoss-35-31B1068.537.5
11-10-2018SMU_Amer62Connecticut50RoadWin1215Amer2237
11-10-2018Florida St_ACC13Notre Dame42RoadLoss-29-25IND61.736.7
11-10-2018East Carolina_Amer18Tulane24RoadLoss-6-7Amer43.536.5
11-10-2018Kansas_B1217Kansas St21RoadLoss-4-7B1243.536.5
11-10-2018Tulane_Amer24East Carolina18HomeWin67Amer29.436.4
11-10-2018Houston_Amer49Temple59HomeLoss-10-13Amer49.236.2
11-08-2018North Carolina St_ACC23Wake Forest27HomeLoss-4-7ACC43.236.2
11-10-2018UAB_CUSA26Southern Miss23HomeWin30CUSA35.735.7
11-10-2018TCU_B1210West Virginia47RoadLoss-37-29B1264.435.4
11-10-2018Kentucky_SEC7Tennessee24RoadLoss-17-14SEC48.934.9
11-10-2018Colorado_P127Washington St31HomeLoss-24-25.5P1259.734.2
11-10-2018New Mexico_MWC24Air Force42RoadLoss-18-15MWC45.830.8
11-10-2018Liberty_IND24Virginia45RoadLoss-21-18ACC47.929.9
11-10-2018Louisiana Tech_CUSA28Rice13HomeWin1512CUSA17.829.8
11-10-2018Illinois_B1035Nebraska54RoadLoss-19-16B1045.529.5
11-10-2018Georgia St_SUN22Louisiana-Lafayette36RoadLoss-14-11SUN4029
11-10-2018Georgia Southern_SUN21Troy35HomeLoss-14-17SUN45.728.7
11-10-2018San José St_MWC24Utah St62RoadLoss-38-29.5MWC5727.5
11-10-2018Akron_MAC7Eastern Michigan27RoadLoss-20-17MAC44.227.2
11-10-2018Oregon St_P1217Stanford48RoadLoss-31-26P1253.127.1
11-10-2018North Texas_CUSA31Old Dominion34RoadLoss-30CUSA2727
11-10-2018Rice_CUSA13Louisiana Tech28RoadLoss-15-12CUSA38.626.6
11-10-2018UNC-Charlotte_CUSA13Marshall30RoadLoss-17-14CUSA40.426.4
11-09-2018Louisville_ACC23Syracuse54RoadLoss-31-26ACC52.326.3
11-10-2018Massachusetts_IND16Brigham Young35NeutLoss-19-19IND44.725.7
11-10-2018Army_IND31Lafayette13HomeWin1815fcs9.924.9
11-07-2018Toledo_MAC15Northern Illinois38RoadLoss-23-20MAC44.324.3
11-10-2018San Diego St_MWC24UNLV27HomeLoss-3-7MWC30.823.8
11-10-2018Western Kentucky_CUSA15Florida Atlantic34RoadLoss-19-16CUSA39.523.5
11-10-2018Connecticut_Amer50SMU62HomeLoss-12-15Amer38.123.1
11-10-2018Tulsa_Amer21Memphis47RoadLoss-26-23Amer45.922.9
11-10-2018Virginia Tech_ACC22Pittsburgh52RoadLoss-30-25.5ACC48.422.9
11-10-2018Texas St-San Marcos_SUN7Appalachian St38HomeLoss-31-29SUN51.822.8
11-10-2018UTEP_CUSA32Middle Tennessee St48HomeLoss-16-19CUSA40.921.9
11-06-2018Kent St_MAC14Buffalo48RoadLoss-34-27.5MAC48.120.6
11-10-2018Purdue_B1010Minnesota41RoadLoss-31-26B1046.320.3
11-10-2018Coastal Car._SUN16Arkansas St44HomeLoss-28-27.5SUN42.314.8
11-10-2018Colorado St_MWC10Nevada49RoadLoss-39-30MWC4414
11-10-2018Central Michigan_MAC13Bowling Green24HomeLoss-11-14MAC24.210.2
11-10-2018South Alabama_SUN10Louisiana-Monroe38HomeLoss-28-27.5SUN34.46.9
11-10-2018Texas-San Antonio_CUSA7Florida Int'l45HomeLoss-38-32.5CUSA38.25.7

And here are the updated season standings. Yes, Alabama is ridiculous.

RkTeamConfDivConf RkGMOVSOSSRSREC
1AlabamaSECSEC-West11029.448.67810-0
2ClemsonACCACC-Atl11027.244.771.810-0
3GeorgiaSECSEC-East21019.149.9699-1
4MichiganB10B10-East11020.54868.59-1
5OklahomaB12B1211016.34965.29-1
6West VirginiaB12B122917.546.964.48-1
7Notre DameINDInd11015.945.961.710-0
8Ohio StateB10B10-East21015.845.861.59-1
9LSUSECSEC-West3109.351.660.98-2
10Penn StateB10B10-East3109.550.5607-3
11Washington StP12P12-North11015.843.959.79-1
12Fresno StMWCMWC-West11020.738.859.58-2
13MissouriSECSEC-East4106.952.259.16-4
14Mississippi StSECSEC-West5108.949.958.86-4
15IowaB10B10-West410949.658.66-4
16Iowa StB12B12396.251.657.86-3
17UtahP12P12-South2109.647.857.47-3
18WashingtonP12P12-North31010.147.157.27-3
19Utah StMWCMWC-Mntn21023.233.957.19-1
20FloridaSECSEC-East610749.956.97-3
21Texas A&MSECSEC-West7105.351.456.76-4
22Texas TechB12B124106.350.156.45-5
23KentuckySECSEC-East8105.850.556.27-3
24TexasB12B125105.750.456.17-3
25Central FloridaAmerAmer-East1920.13656.19-0
26Michigan StB10B10-East5101.752.754.46-4
27PurdueB10B10-West6103.550.954.45-5
28South CarolinaSECSEC-East99153.354.35-4
29Boise StMWCMWC-Mntn31012.241.954.18-2
30AuburnSECSEC-West10106.347.854.16-4
31CincinnatiAmerAmer-East21016.636.953.49-1
32StanfordP12P12-North4103.849.353.16-4
33SyracuseACCACC-Atl21013.738.652.38-2
34WisconsinB10B10-West7106.745.552.26-4
35Appalachian StSUNSun1918.333.551.87-2
36North Carolina StACCACC-Atl395.346.351.76-3
37Boston CollegeACCACC-Atl4107.344.351.67-3
38NorthwesternB10B10-West810051.151.16-4
39Oklahoma StB12B126104.846.351.15-5
40ArmyINDInd21010.340.250.58-2
41DukeACCACC-Coas5107.342.7507-3
42Arizona StP12P12-South5104.74549.76-4
43Miami FLACCACC-Coas6107.142.649.75-5
44MarylandB10B10-East9102.546.949.35-5
45MississippiSECSEC-West11100.648.749.35-5
46VanderbiltSECSEC-East1210-0.950.249.34-6
47OregonP12P12-North6105.843.549.36-4
48Georgia TechACCACC-Coas710841.349.36-4
49TempleAmerAmer-East3106.442.849.26-4
50TennesseeSECSEC-East1310-1.650.548.95-5
51PittsburghACCACC-Coas8101.44748.46-4
52BuffaloMACMAC-East11012.635.548.19-1
53VirginiaACCACC-Coas9107.140.847.97-3
54TCUB12B12710-2.350.247.94-6
55North TexasCUSACUSA-West11014.632.647.27-3
56Southern CalP12P12-South710-0.147.347.25-5
57HoustonAmerAmer-West41011.934.646.57-3
58MinnesotaB10B10-West1010-1.247.446.35-5
59UABCUSACUSA-West21016.429.846.29-1
60MemphisAmerAmer-West51010.835.145.96-4
61Air ForceMWCMWC-Mntn4103.742.145.84-6
62TroySUNSun2101035.745.78-2
63ColoradoP12P12-South8102.74345.65-5
64NebraskaB10B10-West1110-2.147.645.53-7
65IndianaB10B10-East1210-2.447.745.35-5
66Ohio U.MACMAC-East2101035.345.26-4
67CaliforniaP12P12-North9101.14445.16-4
68BaylorB12B12810-2.647.745.15-5
69Brigham YoungINDInd310143.844.75-5
70ArizonaP12P12-South10102.44244.35-5
71Northern IllinoisMACMAC-West3101.34344.37-3
72Eastern MichiganMACMAC-West4114.639.644.26-5
73NevadaMWCMWC-West5103.240.8446-4
74TulaneAmerAmer-West6101.142.543.55-5
75Kansas StB12B12910-4.247.743.54-6
76Wake ForestACCACC-Atl1010-2.745.943.25-5
77ToledoMACMAC-West5104.338.943.25-5
78Georgia SouthernSUNSun3106.436.142.57-3
79Arkansas StSUNSun4102.939.542.36-4
80UCLAP12P12-South1110-1152.741.72-8
81Miami OHMACMAC-East6100.44141.34-6
82San Diego StMWCMWC-West6101.339.941.27-3
83Virginia TechACCACC-Coas119-1.642.641.14-5
84Middle Tennessee StCUSACUSA-East3105.135.9417-3
85MarshallCUSACUSA-East496.334.140.46-3
86Florida StACCACC-Atl1210-7.647.740.14-6
87Louisiana-LafayetteSUNSun5100.139.9405-5
88KansasB12B121010-6.24639.83-7
89Florida AtlanticCUSACUSA-East5100.439.139.55-5
90South FloridaAmerAmer-East7101.937.539.37-3
91ArkansasSECSEC-West1410-8.447.4392-8
92Louisiana TechCUSACUSA-West6103.135.538.67-3
93Florida Int'lCUSACUSA-East7109.22938.27-3
94SMUAmerAmer-West810-4.342.338.15-5
95Western MichiganMACMAC-West710-0.338.137.86-4
96WyomingMWCMWC-Mntn710-5.843.437.64-6
97IllinoisB10B10-West1310-7.143.636.64-6
98AkronMACMAC-East89-3.439.636.14-5
99North CarolinaACCACC-Coas139-9.945.9361-8
100Southern MissCUSACUSA-West892.433.335.74-5
101New MexicoMWCMWC-Mntn810-4.739.935.33-7
102LibertyINDInd49-2.437.134.64-5
103Coastal Car.SUNSun610-4.138.634.55-5
104Louisiana-MonroeSUNSun710-1.936.234.46-4
105TulsaAmerAmer-West910-6.940.9342-8
106Hawai`iMWCMWC-West911-3.637.6346-5
107NavyAmerAmer-West1010-10.243.433.22-8
108LouisvilleACCACC-Atl1410-17.548.731.32-8
109UNLVMWCMWC-West1010-8.23930.83-7
110Oregon StP12P12-North1210-15.546.230.72-8
111Ball StMACMAC-West910-7.438.130.73-7
112Central MichiganMACMAC-West1011-10.740.629.91-10
113RutgersB10B10-East1410-17.747.629.91-9
114UNC-CharlotteCUSACUSA-East910-534.829.94-6
115East CarolinaAmerAmer-East119-11.941.429.42-7
116Georgia StSUNSun810-10.239.429.22-8
117San José StMWCMWC-West1110-13.742.729.11-9
118MassachusettsINDInd511-7.535.928.44-7
119Kent StMACMAC-East1110-1138.927.92-8
120Colorado StMWCMWC-Mntn1210-13.741.327.63-7
121Old DominionCUSACUSA-East1010-9.636.6273-7
122Western KentuckyCUSACUSA-East1110-11.536.124.61-9
123Bowling GreenMACMAC-East1210-14.83924.22-8
124Texas St-San MarcosSUNSun910-6.829.923.23-7
125South AlabamaSUNSun1010-1537.822.92-8
126New Mexico StINDIND610-13.635.822.23-7
127ConnecticutAmerAmer-East1210-21.143221-9
128Texas-San AntonioCUSACUSA-West1210-14.135.821.83-7
129UTEPCUSACUSA-West1310-1333.320.41-9
130RiceCUSACUSA-West1411-17.134.917.81-10

Right now, on a neutral field, Alabama would be:

— 6-point favorites against Clemson
— 9-point favorites against Georgia
— 9.5 point favorites against Michigan
— 16-point favorites against Notre Dame
— 22-point favorites against UCF
— 54.5 point favorites against The Citadel, Alabama’s opponent this weekend (that’s based on The Citadel’s 23.5 SRS rating; there actually is no point spread on the game).

{ 0 comments }

In week 10, Alabama produced the win of the season, blanking #3 LSU, 29-0, in Baton Rouge. It was the worst home loss for Louisiana State since 2002, and yet another example of how Alabama is operating on a different level than any other team in college football.

Alabama scored a 91.8 in the SRS for this performance, and the Crimson Tide now have the best two games of the season (Alabama also had a 91.8 in a 62-0 win over Mississippi). The worst game of the year by Alabama (according to the SRS) was a 51-14 drubbing over Louisville on opening weekend. The second-worst game this season was a 65-31 win on the road against Arkansas. A 45-23 win over Texas A&M was the only game the Crimson Tide have won by less than four touchdowns.

Nick Saban has won 5 national championships with Alabama, and his 2016 team was a dominant squad that went 14-0 and lost in the final minute of the national championship game. And yet… this feels like the best Alabama team under Saban, and by a pretty clear margin. And if it’s the best Alabama team under Saban, it’s not too hard to suggest it’s the best Alabama team ever. And if it’s the best Alabama team ever, well, it’s obviously in the discussion for best college football team ever.

That’s how good this 2018 Alabama team is. Right now, they are a touchdown better than the rest of the FBS. Even Clemson has had a couple of unimpressive games: the Tigers needed to rally and score a last minute touchdown to beat an average Syracuse team, and caught a break in a 2-point win over Texas A&M. That’s perfectly normal for an average elite team, but those two blemishes are a standard deviation below anything an apparently invincible Alabama has done this year. Below are the full week 10 SRS ratings. [continue reading…]

{ 0 comments }

It was not a particularly eventful week in terms of college football upsets. No top-5 SRS teams lost, and only two top-10 SRS teams lost — and both lost to very good teams. Iowa ranked 7th in the SRS last week, and lost on the road to Penn State, who ranked 11th in the week 8 ratings. The annual Florida/Georgia game in Jacksonville featured two top 10 teams, with then-#3 Georgia defeating then-#8 Florida.

Other top teams to lose: #13 Washington, #15 Texas A&M, #16 Purdue, #21 Texas Tech, #22 Missouri, #23 Wisconsin, and #26 Texas. The Longhorns may have been 26th in the SRS, but with a 6-1 record and wins over USC, TCU, and Oklahoma, the Longhorns entered week 8 6th in the AP rankings. A loss to Oklahoma State (hi Doug!) in Stillwater now puts the Big 12 playoff picture into chaos. Next week, West Virginia travels to Austin in a matchup of two of the top teams in the conference.

Alabama was off this week, which opened the way for Georgia and Clemson to be the dominant teams of the week. Both teams demolished teams from Florida: the Bulldogs defeated a pretty good Florida team by 19, while Clemson crushed a bad Seminoles team by 49 points. West Virginia, Arizona, and Utah round out the top 5 teams of the week in terms of single game SRS ratings. [continue reading…]

{ 0 comments }

Four teams saw their SRS ratings drop by at least 4 points from their rating one week ago: Ohio State, Oregon State, Minnesota, and Tulane. In that group, Ohio State was the notable loss, of course: Purdue was 38th in the SRS — so better than people may have realized — but still had a rating 14 points lower than that of the Buckeye. Yet in week 8, Purdue blew out Ohio State 49-20, producing one of the three best performances of the season (joining ALabama’s 62-7 blowout against Ole Miss and LSU’s 36-16 win over Georgia).

Purdue was joined by Virginia, North Carolina, California, and Nebraska as teams that saw their SRS rise by at least 4 points. Below are the full SRS ratings through 8 weeks. As always thanks to Dr. Peter R. Wolfe for providing the weekly game logs. [continue reading…]

{ 0 comments }

It was an eventful week of college football, with 6 teams ranking in the top 16 falling in week 7:

  • #2 Georgia was blown out by LSU, 36-16.
  • #6 West Virginia lost to giant killer Iowa State; over the last 53 weeks, the Cyclones have beaten three Big 12 teams that ranked in the top 6: Oklahoma and TCU in 2017, and the Mountaineers 30-14 on Saturday.
  • #7 Washington, which had a loss to Auburn in the season opener (and which only looks uglier in retrospect, as the Tigers have gone 2-3 against the rest of the FBS since then), had a perhaps fatal loss to Oregon on Saturday afternoon. The Huskies lost in overtime, 30-27, in Eugene.
  • #8 Penn State, a week after a narrow home loss to Ohio State, was upset 21-17 at home against Michigan State.
  • #15 Wisconsin was obliterated by Michigan in Ann Arbor, 38-13. The 25-point differential was the worst by the Badgers in a true road game in over a decade.
  • #16 Miami lost to Virginia, 16-13.

In addition, Notre Dame narrowly beat Pittsburgh (19-14), Central Florida barely escaped Memphis (31-30), and Texas, Texas Tech, and Texas A&M all escaped with one-score wins. [continue reading…]

{ 0 comments }

It’s time, once again, to release the first edition of the college football Simple Rating System ratings. While it’s too early to put too much weight on these ratings, they help to at least begin framing the discussion of which are the most impressive teams in college football. As a reminder, here is the methodology:

1) For each game not played at a neutral site, 3 points are given to the road team. After that adjustment, all wins and losses of between 7 and 24 points are recorded exactly as such. This means that a 24-10 road win goes down as +17 for the road team, -17 for the home team.

2) With one exception, wins of 7 or fewer points are scored as 7-point wins and losses of 7 or fewer points are scored as 7 point losses. So a 4-point home win goes down as +7 (and not a 1) and a 1-point home loss is a -7 (and not a -4). The one exception is that road losses of 3 or fewer (and home wins of 3 or fewer) are graded as ties. So a 21-20 home victory goes down as a 0 for both teams.

3) Wins/Losses of more than 24 points are scored as the average between the actual number and 24. This is to avoid giving undue credit to teams that run up the score. So a 75-point home win goes down as a 48-point win.

Once we have a rating for each team in each game, we then adjust each result for strength of schedule. This is an iterative process, where we adjust the ratings hundreds of times (to adjust for SOS, you have to adjust for the SOS of each opponent, and the SOS of each opponent’s opponent, and so on.) in Excel. Then we produce final ratings, where the SRS rating is the sum of the Margin of Victory and Strength of Schedule in every week. [continue reading…]

{ 0 comments }

2018 Draft Value By College and Conference

You will not be surprised to learn that Alabama, Ohio State, and Georgia were the three schools that dominated the 2018 NFL Draft. Players from the Crimson Tide were taken using draft slots worth 83.9 points of value, the most of any school; second was Ohio State with 70.4 points of value, followed by Georgia (68.7), USC (55.7), and Penn State (54.5).

On the other hand, with the exception of the number one overall pick, the Big 12 has a pretty shaky draft. In fact, after Baker Mayfield, the next player selected from the Big 12 was Texas guard Connor Williams.  The graph below shows the AV used to select players from each conference in the 2018 Draft:

You probably aren’t surprised to see the SEC finished first among all conferences in draft value spent on its players. The ACC was second, thanks not to the current conference overlord in Clemson, but to…. North Carolina State, Louisville, and Virginia Tech!

RkCollegeConfDraft Value
1AlabamaSEC83.9
2Ohio StateBig Ten70.4
3GeorgiaSEC68.7
4USCPac-1255.7
5Penn StateBig Ten54.5
6North Carolina StateACC52.8
7OklahomaBig 1249.6
8Notre DameInd48.4
9UCLAPac-1246
10LouisvilleACC36.6
11Virginia TechACC34.5
12WashingtonPac-1234.1
13LSUSEC33.7
14AuburnSEC32.4
15Florida StateACC31.1
16FloridaSEC30.4
17UCFAmerican27.3
18IowaBig Ten26.6
19WyomingMWC22.2
20Miami (FL)ACC21
21TexasBig 1220.5
22Oklahoma StateBig 1218.4
23Texas-San Antonionon-FBS17.8
24Boston CollegeACC17.5
25StanfordPac-1216.9
26MarylandBig Ten16.6
27PittACC16.5
28Boise StateMWC16.4
29Texas A&MSEC15.7
30ArkansasSEC15.5
31Ole MissSEC15.4
32South CarolinaSEC14.1
33San Diego StateMWC13.6
34NevadaMWC12.3
34MemphisAmerican12.3
36UTEPCUSA12.1
37South Carolina Statenon-FBS11.8
38SMUAmerican11.1
39Wake ForestACC10.8
40RutgersBig Ten10.4
41OregonPac-1210.1
42WisconsinBig Ten10
43Southern MississippiCUSA10
44South Dakota Statenon-FBS9.8
45North CarolinaACC9.3
46TennesseeSEC8.9
46Sam Houston Statenon-FBS8.9
48ColoradoPac-128.7
49MichiganBig Ten8.6
50North Carolina A&Tnon-FBS8
51ClemsonACC8
52LouisianaSun Belt7.8
53Western MichiganMAC7.7
54South FloridaAmerican7.6
55Brigham YoungInd7.5
56Fort Hays Statenon-FBS7.4
57Mississippi StateSEC7.2
58Texas ChristianBig 126.7
59Arizona StatePac-126.6
59Colorado StateMWC6.6
61IndianaBig Ten6.3
61Western KentuckyCUSA6.3
63Texas TechBig 126.3
64VanderbiltSEC6.1
65Humboldt Statenon-FBS5.7
66VirginiaACC5.2
67Richmondnon-FBS4.8
68Michigan StateBig Ten4.6
69KansasBig 124.3
70West VirginiaBig 124.2
71Washington StatePac-124.1
72Weber Statenon-FBS4.1
73MissouriSEC3.5
73New Mexico StateSun Belt3.5
75Fordhamnon-FBS3.4
75Stephen F. Austinnon-FBS3.4
77PurdueBig Ten3
77Kansas StateBig 123
77Pennsylvanianon-FBS3
80Delawarenon-FBS2.9
81Illinois Statenon-FBS2.7
82ArizonaPac-122.6
83Jacksonville Statenon-FBS2.5
84Central MichiganMAC2.4
85Northern Iowanon-FBS2.3
86TulaneAmerican1.9
87UtahPac-121.5
87ConnecticutAmerican1.5
87TempleAmerican1.5
90Mainenon-FBS1.1
91Yalenon-FBS0.9
92NebraskaBig Ten0.8
92Louisiana TechCUSA0.8
94Virginia Statenon-FBS0.7
95Wagnernon-FBS0.5
95Appalachian StateSun Belt0.5
97Florida InternationalCUSA0.3
98San Jose StateMWC0.2
98HoustonAmerican0.2

As always, please leave your thoughts in the comments.

{ 1 comment }

UTSA defensive end Marcus Davenport is a likely first round pick who should be one of the more interesting stories of the draft’s opening night. He is also, pound for pound, the fastest man in the draft.

Last year, I used the following formula to project estimated 40-yard dash times based on weight:

Estimated 40-yard dash time = 3.283 + 0.00606 x weight (lbs)

Davenport weighted 264 pounds in Indianapolis, which would give him a projected time of 4.88 seconds.  But Davenport ran the 40 in a blistering 4.58 seconds, a remarkable 0.30 seconds faster than expected for a man of his size.

Georgia linebacker Lorenzo Carter weighed in at 250 pounds, and he ran the 40 in just 4.50 seconds! That’s also 0.30 seconds faster than the weight-influenced expectation of 4.80 for a man of his size. Davenport and Carter ran the two fastest 40-yard dashes after adjusting for weight at the combine. Coming in third? Perhaps the first non-QB off the board in the 2018 Draft, Penn State RB Saquon Barkley. [continue reading…]

{ 5 comments }

Penn State, at 10-2 and a runner-up in the Big Ten East, is not in the college football playoff discussion. But that doesn’t mean the Nittany Lions haven’t been as good as any team this season. After all, had Penn State had played Ohio State at home and won by 1 point instead of losing on the road the Buckeyes by 1 point, the Nittany Lions wouldn’t be any “better” than they are now, while their record would be much better. An 11-1 Penn State with wins over Ohio State, Iowa, Michigan, and Northwestern, and be a lock to make the college football playoff with a win over Wisconsin in the Big 10 Championship Game.

Penn State ranks 7th in points scored and 7th in points allowed among the 130 teams in the FBS. The Nittany Lions are the only team in the top 10 in both categories, and Alabama (1st in points allowed, 12th in points scored) is the only other team in the top 15 in both; Washington (18th in scoring, 6th in points allowed) is the only other team to rank in the top 20 in both. Penn State has outscored opponents by 26.1 points per game, second to only Alabama (27.6) despite a harder schedule. Penn State lost two games on the road by a total of 4 points; but, even though the Nittany Lions rank 1st in the SRS, the loss to Ohio State — which goes down as the best loss of the season (edging Utah’s 3-point road loss in Washington) — is enough to eliminate them from contention.

As always thanks to Dr. Peter R. Wolfe for providing the weekly game logs. The full week 13 NCAA SRS ratings below: [continue reading…]

{ 0 comments }

The SRS ratings this week didn’t change much, with very few meaningful games among top teams.

Penn State, Notre Dame, Washington, and Iowa State fell a bit in close wins over bad teams, while Oklahoma State and Iowa suffered losses. The only other top-25 teams (by the SRS) to lose lost to even better teams: Michigan lost to Wisconsin, and N.C. State losing to Wake Forest.

Right now, three Big 10 teams crack the top four, with Georgia and Auburn combining with #1 Alabama to give the SEC three top-10 teams. The full week 12 SRS ratings are below. As always thanks to Dr. Peter R. Wolfe for providing the weekly game logs. [continue reading…]

{ 0 comments }

A week ago, Iowa beat Ohio State 55-24 and recorded the single-best SRS game score (87.5) of the 2017 season. And after the Buckeyes crushed Michigan State on Saturday, that win looks even better: it now measures a whopping 88.5 in the SRS. And yet, it is no longer the top game of the year, not after what Miami just did.

At home against the then-#1 team in the SRS, Notre Dame, the Hurricanes crushed the Irish 41-8. Because Notre Dame still has an impressive 62.2 SRS rating, the 33-point win — which gets knocked down to 27 due to home field and as part of the compression against blowouts — produced an SRS score of 89.2, the best game of the year. And the Buckeyes win over MSU? That was the third best performance of the season, scoring an SRS score of 81.7. And let’s not forget about what Auburn did to Georgia — the Tigers produced the 7th-best game of the year by SRS standards. The table below shows the single-game SRS scores from this week: [continue reading…]

{ 0 comments }

Let’s start today’s post in a different direction: with a look at the biggest surprises of the week. And there was no bigger surprise than Iowa’s blowout win over Ohio State.

After week 10 (which, of course, compresses the ratings since the year-long ratings include the week 10 results), Iowa has an SRS of 55.0, while Ohio State is at 61.6. Given that the game was in Iowa, we would have expected Iowa to lose by 3.6 points.  But Iowa won 55-24, for a difference of 31 points, and an adjusted MOV of 26 points.  That means Iowa exceeded SRS expectations by 29.6 points, the most of any FBS team this week.

Army, Bowling Green, Baylor, and Utah round out the top 5 in terms of biggest overachievers in week 10:

[continue reading…]

{ 1 comment }

You probably weren’t expecting that headline after Penn State lost its first game of the season on Saturday.

A week ago, I wrote that Penn State rose to #2 in the SRS after blowing out Michigan. Now, this week, Penn State is #1 after losing on Saturday? What happened?

#1 Alabama was idle this week, but Penn State had as good a loss as you can get. The Nittany Lions had an SRS rating of 68.2 last week, and only dropped to 67.6 this week. That’s because Penn State lost by 1 point, on the road, to an Ohio State team that ranks 3rd in the SRS. But the real issue is that Alabama dropped significantly, by 3.5 points from week 8 to 9, despite not playing.

How? Alabama is 8-0 with zero of those wins coming against teams that rank in the top 45 in the SRS. Four of those wins have come against terrible SEC teams that rank outside of the top 70 in the SRS in Tennessee, Mississippi, Arkansas, and Vanderbilt. The other four wins came against Florida State, Fresno State, Texas A&M, and Colorado St.

FSU lost 35-3 to Boston College this weekend, causing the Seminoles to drop from 51.1 to 44.5 in the SRS, a -6.6 point drop.

Fresno State lost 26-16 to a terrible UNLV team, causing west coast FSU to drop from 49.5 to 43.4, a -6.1 SRS point drop.

The Aggies lost 35-14 to Mississippi State, dropping Texas A&M by 3.9 points, from 46.2 to 42.3 in the SRS.

And Colorado State lost at home to Air Force by 17 points; that led to a 4.4 point SRS drop, from 43.4 to 39.0.

A week ago, Alabama’s SOS was 42.6 points; that was a little weak, but overwhelmed by the Crimson Tide’s dominance. Now? The average Alabama opponent has a 39.1 SRS rating, and that 3.5-point drop was enough to move Alabama from #1 to #4 in the SRS. It’s weird for sure to see Alabama drop this far, but look at the big picture: the Crimson Tide haven’t faced an opponent in the top 45 of the SRS, and their three best wins are against #48 Florida State, #50 Fresno State, and #58 Texas A&M. [continue reading…]

{ 1 comment }

Week 8 of the college football season didn’t see any big contenders fall. In fact, none of the top 14 teams in last week’s ratings lost. And the two best teams that lost all fell to better teams: last week’s #15 lost to last week’s #3 Penn State, #16 USC lost to #5 Notre Dame.

Let’s start with the most impressive wins of the week, which go to Notre Dame and Penn State. Beating a strong opponent helps, but both teams blew out top 20 opponents.  And Iowa State — a school that hadn’t won more than 3 games since 2012 — continued their remarkable run.  In week 6, the Cyclones shocked a great Oklahoma team to win 38-31 in Norman. The next week, Iowa State stomped on Kansas 45-0, the second largest margin of victory for Iowa State in a game in the last 15 years.  Then, on Saturday, the Cyclones upset Texas Tech, 31-13.  This marked the third straight game where Iowa State covered the point spread by more than 21 points!

The table below shows the SRS ratings from each game in week 8: [continue reading…]

{ 3 comments }

Last week, I introduced the first version of the SRS ratings. Well, there were some big upsets this week which have moved the rankings.

Clemson, which ranked 5th last week and 2nd in the polls, was upset by a Syracuse team that ranked 73rd in the SRS.

Washington, which ranked 8th in the SRS, was upset by Arizona State, which ranked 45th last week.

Washington State looked to be soaring this time a week ago: they ranked 14th in the SRS and were 6-0. But the Cougars were obliterated 37-3 by a Cal team that ranked 58th in the SRS a week ago.

Auburn, Texas Tech, Texas, and San Diego State were also SRS top 25 teams that suffered a loss in week seven.

Even Georgia moves down this week by virtue of a sluggish win over a terrible Missouri team. Entering this week, Missouri was 0-4 against FBS opponents (Auburn, Purdue, South Carolina, Kentucky) with an average loss of 23.25 points; therefore, a 25-point home win over Missouri drops 3 to 4. Right now, Ohio State and Penn State joint Alabama in the top 3.

As for the Buckeyes, yes, they rank #2 despite a 15-point home loss to Oklahoma. Why? They beat Rutgers by 56, Maryland by 48, Nebraska by 42, UNLV by 33, and Army by 31 points: those are the worst losses each of those five teams have had this year. They also beat Indiana by 28, and the Hoosiers have only had one loss worse this year (31 points to Penn State). Yes, the Oklahoma loss was bad, but it’s not easy dropping 40-point wins against Big 10 teams. Think of the SRS as a proxy for the Vegas rankings: and right now, I expect Ohio State to be a home favorite against Penn State in two weeks.

As always thanks to Dr. Peter R. Wolfe for providing the weekly game logs. Below are the SRS ratings through 7 weeks: [continue reading…]

{ 3 comments }

For the last few years, I have introduced the first edition of the College Football SRS Ratings after five weeks. I’m a week late this year, so it’s time to release the first college football ratings. And while it’s too early to put too much weight on these ratings, they help to at least begin framing the discussion of which are the most impressive teams in college football. As a reminder, here is the methodology:

1) For each game not played at a neutral site, 3 points are given to the road team. After that adjustment, all wins and losses of between 7 and 24 points are recorded exactly as such. This means that a 24-10 road win goes down as +17 for the road team, -17 for the home team.

2) With one exception, wins of 7 or fewer points are scored as 7-point wins and losses of 7 or fewer points are scored as 7 point losses. So a 4-point home win goes down as +7 (and not a 1) and a 1-point home loss is a -7 (and not a -4). The one exception is that road losses of 3 or fewer (and home wins of 3 or fewer) are graded as ties. So a 21-20 home victory goes down as a 0 for both teams.

3) Wins/Losses of more than 24 points are scored as the average between the actual number and 24. This is to avoid giving undue credit to teams that run up the score. So a 75-point home win goes down as a 48-point win.

Once we have a rating for each team in each game, we then adjust each result for strength of schedule. This is an iterative process, where we adjust the ratings hundreds of times (to adjust for SOS, you have to adjust for the SOS of each opponent, and the SOS of each opponent’s opponent, and so on.) in Excel. Then we produce final ratings, where the SRS rating is the sum of the Margin of Victory and Strength of Schedule in every week. [continue reading…]

{ 2 comments }

Myles Garrett Is Your 2017 Combine Champion

Myles Garrett is in good shape.

Over the last few days, we have looked at how the top college athletes performed in various drills at the NFL combine, after adjusting for height and weight. Today, we look at the full results and crown a combine champion.

That is a pretty easy thing to do, as it turns out. Texas A&M defensive end Myles Garrett is likely going to be the first overall pick in the draft, and his performance in Indianapolis cemented such a distinction. Garrett had the 2nd best performance in three separate drills: the 40-yard dash, the bench press, and the vertical jump. Then, he produced a 5th-place finish in the broad jump, while sitting out the 3-cone drill. Garrett competed in four of these five events and his averaged finish was 2.8. That’s tremendous.

The table below shows the results in these five drills. I have also included an average rank, excluding all events where a player didn’t participate. That’s not the best way to do this, but I don’t know of a simpler method to rank them. The far right column shows how many of the 5 events each player competed in, so that can be a useful guide. It’s clear to me that the runner up for Combine King is Solomon Thomas rather than Aviante Collins. Thomas had an average rank of 7.6, but he competed in all five events. Collins has a higher rank at 5.0, but the TCU tackle only competed in the 40 and the bench press. To me, a 1-7-8-8-14 is more impressive than a 5-5-dnp-dnp-dnp, but to keep things simple, I just used a simple average. [continue reading…]

{ 1 comment }

Thomas was a combine superstar

As you can imagine, heavier players fare much worse in the 3-cone drill, and taller players have a slight advantage, too. Here was the best-fit formula from the 2017 combine:

7.3397 -0.0317 * Height (Inches) + 0.0091 * Weight (Pounds)

Stanford running back Christian McCaffrey is one of the more interesting prospects from this draft, and he dominated in the 3-cone drill, finishing in 6.57 seconds, just one hundredth of a second behind the leader. Given his dimensions — 71 inches, 202 pounds — he’d be expected to complete the drill in 6.93. McCaffrey therefore finished the drill in 0.36 seconds more than expected, the 7th-best adjusted performance in this drill.

The top performance belonged to a different Stanford player, defensive end Solomon Thomas, who finished a full 0.50 seconds above expectation. The full results, below: [continue reading…]

{ 1 comment }

Hey, look who it is again.

Yesterday, we looked at the vertical jump, which is biased towards lighter players. The star at the combine was Connecticut safety Obi Melifonwu, who had both the top vertical jump and the top weight-adjusted vertical jump. Well, Melifonwu also had the longest broad jump at the combine.

The broad jump is also biased in towards lighter players, but it’s also biased towards taller players. As a result, we need to adjust broad jump results for both weight and height: the best-fit formula from the results of the 2017 combine is:

Broad Jump = 84.14 + 1.0766 * Height (Inches) – 0.1940 * Weight (Pounds)

For Melifonwu, he weighed 224 pounds and was 76 inches tall; that means he’d be projected to jump a solid 122.5 inches. That’s a pretty high projection, showing that Melifonwu’s body is well-tailored for this drill. But even still, he exceeded that jump by 18.5 inches, courtesy of his remarkable 141 inch jump. As a result, he once again had both the top jump and the top adjusted jump: [continue reading…]

{ 0 comments }

Being able to jump high might be useful for a safety

Let’s begin with the most remarkable of today’s feats: Myles Garrett is getting pretty good at this number two thing. After finishing second in the weight-adjusted 40 and second in the height and weight adjusted bench press, Garrett has again finished second in a combine drill, this time the weight-adjusted vertical.

When it comes to the vertical jump, weight is by far the most important thing that matters. For every additional 16.7 pounds a player weights, his expected vertical declines by one inch. That’s because the best-fit formula for projecting the vertical jump at the 2017 combine was 46.38 – 0.0597 * weight (pounds). Connecticut safety Obi Melifonwu weighed 224 pounds in Indianapolis, which would project him to jump an even 33 inches if he was average at this drill.

Well, Melifonwu was anything but average. He jumped an incredible 44 inches: for comparison’s sake, Florida State / Jacksonville safety Jalen Ramsey had a 41.5 inch vertical last year, tied for the most of any player at the 2016 combine. And that was at 209 pounds. Melifonwu was 15 pounds heavier and jumped 2.5 inches higher. That’s a remarkable feat, and brings to mind some of the great verticals from the 2015 combine.

And while Melifonwu was 11 inches better than expected, Garrett was right on his heels at +10.9 inches. Garrett weighed 272 pounds at the combine, but still jumped an insane 41 inches. That’s only three fewer inches than Melifonwu at 48 pounds heavier. Now because the average player lost 16.7 inches for every pound, that makes Melifonwu’s jump just slightly better, but the two of them were far ahead of the rest of the pack. Below are the full results: [continue reading…]

{ 1 comment }

Lawson, when he’s not on the bench press

Yesterday, I looked at the best weight-adjusted 40-yard dash times at the 2017 NFL Combine. The Browns are expected to select Texas A&M defensive end Myles Garrett with the first overall pick, and with good reason: he had the 2nd best weight-adjusted 40-yard dash time, and he comes in 2nd place again today in the height and weight adjusted bench press.

In 2015, Clemson/Atlanta Falcon Vic Beasley was the bench press champion, using a formula involving expected bench press reps based on a player’s height and weight.  That turned out to be pretty predictive of future success; on the other hand, last year’s winner was Nebraska fullback Andy Janovich, who wound up being a 6th round pick and a minor contributor as a rookie with the Broncos.

The best-fit formula to project bench press reps for the 2017 Combine was:

17.401 -0.3354 * Height (Inches) + 0.1075 * Weight (Pounds)

Using that formula, Garrett — at 76 inches and 272 pounds — would be projected to bench press 225 pounds for 21.1 reps. In reality, Garrett produced a whopping 33 reps, or 11.9 more than expected. The only way to top him was Auburn’s Carl Lawson, who measured at 74 inches and only 261 pounds. Being shorter is better, but being lighter is worse, and Lawson would be projected using the regression to have 20.6 reps on the bench press. Instead, he had 35, or 14.4 more than projected, easily the largest margin at the combine.
[continue reading…]

{ 0 comments }

O.J. Howard is fast.

As I have done for the last few years, this week I will be using the raw NFL combine data and adjusting them various metrics.  With respect to the 40-yard dash, the only adjustment I’ve made is for weight, as no other variable (e.g., height) impacts a player’s 40 time quite like weight.  The best-fit formula to predict 40-yard dash time during the 2017 combine was 3.283 + 0.00606 x weight. ((This time around, I excluded punters, kickers, and long snappers when running regressions, as those players aren’t invited to their combine for their raw athleticism (and removing them made the numbers a little tighter). As you can see

Let’s use Alabama tight end O.J. Howard as an example.  He weighed 251 pounds at the combine, which means he would be projected to run the 40-yard dash in 4.81 seconds. Instead, he ran it in just 4.51 seconds, a full 0.30 better than expected.

That was the best performance of any player at the combine. A very close second was produced by the presumptive number one pick in the draft, Myles Garrett. The Texas A&M defensive end weighed 272 pounds, so using the formula above, a player of Garrett’s size should run the 40 in 4.93 seconds.  But Garrett was 0.29 seconds better than expected, completing the drill in 4.64 seconds. Garrett reportedly bested that time by running 40 yards in 4.57 seconds at his Pro Day, too. [continue reading…]

{ 4 comments }

Week Fourteen NCAA SRS Rankings: Alabama Finishes #1

The college regular season is over, other than Army/Navy this weekend. Let’s start with a review of the final week of the season for the B12, and the conference championship games for the rest of major college football.

Washington’s destruction of Colorado lead the way, while yet another Alabama blowout only comes in second due to the weaker opponent (yes, Florida is nearly ten points worse than Colorado; 2016 is weird). Also, Temple with a huge upset win over Navy comes in third. [continue reading…]

{ 1 comment }

Week Thirteen NCAA SRS Rankings: Where Do We Stand?

The rankings haven’t changed much from last week. Here’s how the top 15 teams in the SRS last week fared in week 13:

  • #1 Alabama handled Auburn in the Iron Bowl, 30-12. The Crimson Tide is a lock for the playoffs, even if they lose in the SECCG (which they’re not going to do).
  • #2 Ohio State beat Michigan in perhaps the game of the college football season, 30-27 in double overtime. Ohio State seems like a lock for the playoffs; the Buckeyes regular season is over, as Penn State won the Big 10 East.
  • #3 Michigan lost to Ohio State. Michigan’s playoff chances appear dead in the water.
  • #4 Washington had the single best game of the week, according to the SRS, beating Washington State in the Apple Cup, 45-17.  It was the 5th best single game score of the year. Washington looks to be in a “win and they’re in” situation, as the Huskies will face Colorado in the P12CG.
  • #5 Clemson blew the doors off of South Carolina, 56-7, to finish the regular season 11-1.  The Tigers are in a “win and they’re in” scenario against Virginia Tech in the ACCCG.
  • #6 Colorado beat Utah, at home, 27-22, to capture the Pac 12 South.  The Buffaloes may well be in a “win and they’re in” situation in the P12CG against Washington.  More on that in a bit.
  • #7 Wisconsin handled Minnesota, 31-17.  Wisconsin won the Big 10 West, and will face Penn State in the B10CG.
  • #8 Southern Cal beat Notre Dame, 45-27, but USC’s season is over now that Colorado has won the South.
  • #9 Louisville shockingly lost to Kentucky, 41-38. Louisville finished the year 9-3, with two straight bad losses.
  • #10 Washington State lost to Washington, ending WAZZOU’s playoff hopes.
  • #11 Oklahoma was off.  The Sooners can still win the conference at 10-2 with a win in the de facto B12CG this weekend against Oklahoma State.
  • #12 Penn State beat Michigan State, 45-12.  The Nittany Lions will face Wisconsin in the B10CG.

Below are the week 13 SRS results: [continue reading…]

{ 24 comments }

It was a very good week for Oklahoma.

The Sooners were easy to write off early in the 2016 season, after two bad losses in the first three weeks. Oklahoma failed to cover by 23 points against Houston (33-23 loss, as a 13-point favorite) and Ohio State (45-24, as a 2-point favorite), which appeared to knock them out of the national discussion.

But Houston did the Sooners a favor by knocking off Louisville on Thursday night, eliminating (for now) the Cardinals from the playoff picture. Houston recorded a single-game SRS score of 79.5 for that performance, the top game of the week. And the better Houston looks, the more forgivable that loss is from Oklahoma’s perspective.

Oklahoma also doubled-up on West Virginia, 56-28, the third-best game of the week. And the fourth-best game of the week came from Oklahoma State, who destroyed TCU. The Sooners and Cowboys face off in two weeks in a de facto Big 12 playoff game: the teams are 8-0 and 7-1 in conference play, respectively, with every other team having at least two conference losses.

Below are the single-game ratings from week twelve: [continue reading…]

{ 1 comment }

The story of the college football season had been the lack of any crazy upsets. It felt as though we were on a predetermined path to the college football playoffs, with Alabama, Clemson, Washington, and the Ohio State/Michigan winner taking the four spots.

Then, Saturday happened. The six best teams this year have combined to lose just five games, and *three* of them came in week eleven:

  • Pittsburgh went into Clemson and won, 43-42. This was a shocking upset: the Tigers were favored by 21.5 points.
  • Less of an upset was seeing USC (+10) go in to Seattle and double up the Huskies, 26-13.  This registered as the 2nd most dominant win of the week, behind only Ohio State’s 62-3 thrashing of Maryland.
  • And then the most shocking development of the weekend: Michigan, #1 in the SRS last week, falling to Iowa in Iowa City.  The Wolverines were 24-point favorites, and would have been 22.7-point SRS favorites over a Hawkeyes team that ranked 44th in the SRS a few days ago.

Oh, and in addition to Ohio State taking care of business, Alabama crushed MSU, 51-3, for the 3rd best SRS game of the week.  Below are the single-game SRS ratings from week 11: [continue reading…]

{ 8 comments }
Previous Posts