≡ Menu

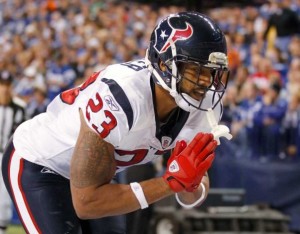
In 2013, Brandon Marshall caught 100 passes and 12 touchdowns for the Chicago Bears and made the Pro Bowl. His teammate, Matt Forte, also made the Pro Bowl on the basis of 1,933 yards from scrimmage and 12 scores of his own.

Marshall had 109 receptions and tied for the league-lead with 14 touchdowns last year as a member of the Jets, and earned another Pro Bowl nod. Forte had a down year, but is only one year removed from an 1,846 yards from scrimmage season. With Forte now in New York, the players are teammates again. And, if both make the Pro Bowl this year, they will join a pretty rare group: teammates who made the Pro Bowl for multiple franchises. In fact, only four players of teammates have ever done it.

Reggie White made the Pro Bowl 13 times in his career, including in 1988, 1989, and 1990 for the Eagles.  In those years, his teammate, tight end Keith Jackson, also earned trips to Honolulu.  White went to Green Bay in ’93 and made the Pro Bowl in each of his six seasons with the Packers.  In ’95, Jackson reunited with White in Green Bay, and the duo made the Pro Bowl together again in 1996.

Guard Randall McDaniel made 12 Pro Bowls in his career; every year of his 14 year career, in fact, other than his first and last seasons. In ’98 and ’99, he was joined by the man playing next to him on the line, Vikings center Jeff Christy. After the ’99 season, both players left for Tampa Bay, and the duo made the Pro Bowl their first season with the Bucs, too. [continue reading…]

{ 9 comments }

Jadeveon Clowney Through Two Years

Jadeveon Clowney was one of the most highly-touted non-quarterback prospects in recent draft history. Clowney, in fact, has been a highly-touted prospect for even longer than that: he was the number one recruit in the country for the 2011 class. And, #DisruptionIsProduction aside, Clowney’s now fallen short of sky-high expectations for three years in a row: after an uneven final year in South Carolina, Clowney was limited to just four games as a rookie in 2014. Last year, Clowney started 9 games and played in 13; he recorded 4.5 sacks and had 27 tackles.

Is 2016 the year of the Clowney breakout? It may be: he was a strong run defender last year and has shown flashes of the dominance we saw in college. That said, I thought it would be interesting to compare Clowney to other number one draft picks through two years.  Clowney has played in 17 games through two years; that’s pretty low, as you expect, compared to other first overall picks. [continue reading…]

{ 7 comments }

Today at 538, a look at how no passing attack in the NFL was as reliant on two targets the way the Jets passing attack was last year.

Thought of another way, Marshall and Decker saw 305 targets last year, with all other Jets players combining for nearly an equal number: 297. Yet Marshall/Decker combined for 2,529 receiving yards and 26 touchdowns, and all other Jets combined for 1,641 receiving yards and just seven receiving touchdowns. Marshall and Decker together averaged 8.3 yards per target; all other Jets averaged only 5.5 yards per target.

You can read the full article here.

{ 5 comments }

Least-Conforming Games of 2015

The Buccaneers were not very good last year. Tampa Bay finished with the worst SRS in the NFC, and the second-worst in the NFL ahead of only Tennessee. But that doesn’t mean the Bucs season was predictable; in fact, Tampa Bay had arguably the two weirdest games of the year.

The Bucs opened the season with the least-conforming game of the first half of the season: Tampa lost, at home, to Tennessee, by 28 points! That’s incredible: the Titans only other two wins were by 3 points against Jacksonville and in overtime against the Saints.

But, amazingly, that wasn’t even the least-conforming game of the Bucs season. In week 11, in Philadelphia, Tampa Bay beat the Eagles 45-17. The same team losing at home by 28 points to Tennessee and winning by 28 points on the road in Philadelphia? That’s pretty weird.

The table below shows all 512 regular season games from 2015, and how it differed from expectations.  Here’s how to read the first line. The biggest outlier game was Tampa Bay against Philadelphia, which came in week 11.  You can click the Boxscore link to go to that game’s boxscore on PFR.  Tampa Bay had an SRS rating of -7.7, while Philadelphia’s rating was -4.7.  As a result, given that the game was in Philadelphia, the Expected Margin of Victory for Tampa Bay was -6.0.  In reality, Tampa Bay scored 45 points and allowed 17, for a 28-point Margin of Victory. That exceeded expectations by 34.0 points. [continue reading…]

{ 6 comments }

Dennis Green And The Revolving Quarterback Door

I think I know why Green looks so happy

I think I know why Green looks so happy

Dennis Green passed away on Friday at the age of 67. Green’s most memorable team, of course, was the 1998 Vikings that went 15-1. And we all know what his most memorable moment was. But Green’s entire career was memorable, particularly for the way his career intertwined with some of the most interesting quarterbacks of his era.

Green coached in 219 games in the NFL, including playoffs. Warren Moon, who forever changed the path of black quarterbacks in the NFL, was his starting quarterback in 40 of those games. Daunte Culpepper, who was part of the 1999 class that represented the inflection point for black quarterbacks in the first round of the draft, was Green’s quarterback in 29 games. Randall Cunningham and Jeff George, two of the most talented quarterbacks in recent history, started 27 and 12 games for Green.

Late-bloomers like Brad Johnson (24), Kurt Warner (15), and Rich Gannon (12) started games under Green. So too, did Jim McMahon (12). Green coached Josh McCown and Matt Leinart, and somehow McCown — who is four years older than Leinart — is the one still in the league.

There have been 35 coaches since 1960 to coach in at least 175 games (Green coached for 207 regular season games). Of those coaches, 32 had one quarterback for at least 20% of those games, but Green joins Mike Shanahan and Marty Schottenheimer (no surprise to regular readers) as the only coaches to fall below that mark: [continue reading…]

{ 7 comments }

Last year, Denver had a pretty tough schedule. In only five games did they face an opponent that an average team would have been favored to win: [1]I.e., home games against teams with SRS ratings of 3.0 or worse, or road games against teams with SRS ratings of -3.0 or worse. home games against San Diego, Baltimore, and Oakland, and road games against the Colts and Browns. In those games, Denver went just 3-2, with all five games being decided by one score.

The Broncos had six games against top-8 teams by the SRS: two games against the Chiefs, and games against Cincinnati, Minnesota, New England, and Pittsburgh. In those games, Denver went even better at 4-2, with five of those games being decided by one score.

The middle five games of the schedule by SRS standards was where the Broncos really dominated: the Broncos went 5-0 in road games against Oakland, San Diego, Chicago, and Detroit, and a home game against Green Bay, with three of those five wins coming by double digits.

As it turns out, Denver had the third “strangest” season in the NFL last year. How did I define strange? I measured the correlation coefficient between two variables: the actual margin of victory in a game, and the opponent’s SOS (after adjusting for home field advantage). The Broncos had a CC of 0.18, which means (in case you couldn’t figure it out above) that there wasn’t a big relationship between results and expectation. [continue reading…]

References

References
1 I.e., home games against teams with SRS ratings of 3.0 or worse, or road games against teams with SRS ratings of -3.0 or worse.
{ 4 comments }

A Tale Of One Season

Let’s review the season of a mystery team from last year. This team had a pretty difficult schedule, but wound up with an average record. Here is how things broke down, starting with the good.

  • Mystery team played two home games against teams in the bottom quarter of the league (all team ratings in this post are using SRS). Those are the games where an average team should do well, and in fact, those were the only two games all year that the team won by double digits.
  • Mystery team had three other games where an average team would be “expected” to win based on strength of opponent and game location: Mystery team went 3-0 in those games, with an average margin of victory of 5.3 points.

But things were not so simple for our mystery team all year.

  • Mystery team played five games against teams in the top quarter of the NFL. The result? An 0-5 record, with an average margin of defeat of 16.4 points.
  • The remaining six games were ones where an average team would be “expected” to lose based on strength of opponent and game location, but were not against top-8 teams.  Mystery team had an average points differential of -3.7 in those games, and a 2-4 record.

To recap, Mystery team blew out the bad teams, beat the below-average teams, lost to the above-average teams, and was blown out by the great teams.  That, I think, is as unexciting as a season narrative can get.  But if a team goes 1-7 to start the season, and then 6-2 to finish, it’s easy to spin the “tale of two halves” narrative. [continue reading…]

{ 3 comments }

Joe Gibbs Inherited a Very Underachieving Team

theismannYesterday, we looked at the teams that overachieved their projected wins total by the largest amount based on the strength of their offensive and defensive passing games. Today, the reverse: the biggest underachievers. And that starts in Washington, D.C., the year before Joe Gibbs arrived.

The head coach was Jack Pardee, who was in Washington for three years, going 8-8 in 1978, then 10-6, and then 6-10 in 1980. Pardee was fired after the season, and you can see why: Washington didn’t just have a good pass defense in 1980, but a great one. It ranked as the 12th best pass defense from 1950 to 2013. Both corners, Lemar Parrish and Joe Lavender, made the Pro Bowl. Both safeties, Mark Murphy and Tony Peters, were in the primes of their careers, and would make a Pro Bowl under Gibbs.

Washington had an absurd 8.4% interception rate and a 9.9% sack rate, which helped the defense allow just 2.4 ANY/A, nearly a full yard better than any other team and 2.51 ANY/A better than league average. And the team went 6-10! The offense had Joe Theismann, Art Monk, and Wilbur Jackson; Theismann ranked 17th out of 30 qualifying passers in ANY/A, but that shouldn’t have been enough to keep the team out of the playoffs, let alone below .500.

Washington’s offense finished with a Relative ANY/A of -0.33, and its defense had a RANY/A of +2.51. The team had a 0.375 winning percentage, but “should” have had a 0.704 winning percentage. That means the team underperformed by 5.3 wins, the most of any team in the Super Bowl era. [continue reading…]

{ 4 comments }

The 1968 Cardinals and Outlier Teams

Hart had a great career, but was still developing in '68

Hart had a great career, but was still developing in ’68

In 1968, the St. Louis Cardinals did not have a very good passing offense. The Cardinals averaged 3.9 ANY/A, good enough for 11th place in a 17-team league where the league average was 4.5. The main issue? St. Louis finished dead last with an anemic 44% completion rate. That was mostly due to the second-year starter, 24-year-old Jim Hart. His 44.3% completion rate remains the lowest by any Cardinals quarterback in history with a minimum of 300 pass attempts, and no quarterback with even 160 pass attempts for the Cardinals has dipped below 45% since Hart in ’68. The defense was also below-average against the pass: the Cardinals allowed 6.2 ANY/A, 5th worst in the NFL.

Teams that are below-average at passing and stopping the pass are usually not very good. In the Super Bowl era, each additional yard of ANY/A (on either offense or defense) relative to league average increases a team’s winning percentage by about nine percent. The Cardinals, at -0.5 Relative ANY/A on offense and -1.7 RANY/A on defense, would therefore be expected to win about 30% of their games. Instead, the Cards won 68% of games, going 9-4-1.

The table below shows the 100 teams of the Super Bowl era that have most exceeded expectations based on Offensive and Defensive RANY/A. In general, using ANY/A and RANY/A will get you most of the way there with a team’s record, but not for these teams. The Cardinals had an Off RANY/A of -0.52, a Def RANY/A of -1.72, and therefore, an expected winning percentage of 0.296. By having an actual winning percentage of 0.679, the Cardinals exceeded expectations by 6.1 wins per 16 games. [continue reading…]

{ 9 comments }

538: Front- and Back-loaded Schedules

Today at 538, a look at which teams have front-loaded (the Jets) and back-loaded (the Ravens) schedules. The methodology will be familiar to regular readers: I created implied NFL ratings based on Vegas point spreads, and then calculated general and then weighted strength of schedule ratings. The weight, of course, was based on how late in the season a particular game occurred.

You can read the article here.

{ 3 comments }

How will the Broncos do without Peyton Manning? There are certainly reasons to think Denver will be fine, and Von Miller is one of the biggest reasons. Last year, the Broncos ranked in the bottom 3 in offensive ANY/A and 2nd in defensive ANY/A. According to Football Outsiders, the Broncos ranked 25th in passing DVOA and 1st in DVOA on pass defense. Sure, Mark Sanchez is not great, but he’s pretty familiar with taking a team with a bad offense and a great defense to the playoffs.

Among the 50 Super Bowl winners, Denver had arguably the worst passing offense during the regular season of those teams.  The table below displays each team’s Relative ANY/A — i.e., each team’s ANY/A relative to league average.  The Broncos offense averaged 5.14 ANY/A, which was just over a full ANY/A below average.  On the X-Axis, I have plotted how each Super Bowl winner fared in offensive RANY/A; on the Y-Axis, I have shown defensive ANY/A.  So the 2015 Broncos will be (relatively) high and to the left; the 2002 Bucs/2013 Seahawks will be very high and in the middle, and the ’98 Broncos/’06 Colts will be down and to the right.  Teams like 1966 Green Bay and 1991 Washington were really, really good and balanced, so they are up and to the right. [continue reading…]

{ 11 comments }

Foster prays for good health in Miami

Foster prays for good health in Miami

Arian Foster‘s emergence as a star was almost as sudden as his (likely) exit. An undrafted free agent in 2009, Foster rushed for 100 yards in his first start — in week 17 of the ’09 season. Then, in 2010, he led the NFL in both rushing yards and rushing touchdowns, beginning a five-year stretch of dominance.  A ruptured Achilles tendon ruined Foster’s season in 2015, and he signed with Miami yesterday; at 29, it’s fair to wonder if Foster has much left in the tank.  A one-year, $1.5M contract is a sign that the NFL isn’t too optimistic about his future.  But that doesn’t make his past any less incredible.

From 2010 to 2014, Foster played in 70 games. But in two of those games in 2013, injuries limited him to just 9 combined snaps. And in the season finale in 2014, a hamstring injury caused him to exit after 10 snaps. In those three games, Foster had a total of 9 carries for 34 yards. [continue reading…]

{ 20 comments }

Charles Tillman announced his retirement on Monday, marking the end of a remarkable career. From a game-saving interception (video here) during his rookie season to stop a Daunte Culpepper game-winning touchdown pass to Randy Moss, Tillman was known for delivering big plays in key moments for the Bears. But he will always be remembered for doing something cornerbacks don’t really do: or, given the rate at which he did it, maybe he should be remembering for intercepting passes at an abnormally high rate for a player who forced so many fumbles.

From 2003 to 2015, there were 49 players who recorded 20+ interceptions. During those same years, 52 players recorded at least 15 forced fumbles. Tillman had 38 interceptions and 44 forced fumbles.  To put that remarkable figure in context, take a look at the graph below, which shows all 95 players with either 20+ interceptions or 15+ forced fumbles from ’03 to ’15: [continue reading…]

{ 21 comments }

AV Retention Rates, 2014-2015

Last year, I looked at AV Retention Rates, a measure of how sticky a team’s composition was from year to year. We’ll get to the methodology in a minute, but let’s start with two examples.

Cincinnati was very consistent from 2014 to 2015. Andy Dalton was the quarterback both years, and Jeremy Hill, Giovani Bernard, and A.J. Green were the three leaders in yards from scrimmage in 2014 and again in 2015. The offensive line was unchanged, with Andrew Whitworth, Andre Smith, Clint Boling, Kevin Zeitler, and Russell Bodine as the main five in both years, although Smith and Zeitler missed some time in 2014. The big change on offense wasn’t external, either: it was the return from injury for both Tyler Eifert and Marvin Jones, which dropped Mohamed Sanu down in the pecking order.

On defense, Geno Atkins, Domata Peko, and Carlos Dunlap were starters on the defensive line both years, with Rey Maualuga manning the middle and Reggie Nelson and George Iloka at safety. Adam Jones and Leon Hall were two of the three cornerbacks to play 60%+ of defensive snaps in both years, with the main change in the secondary being being Dre Kirkpatrick replacing Terence Newman (Minnesota). On the line, the big change was the return of Michael Johnson from a one-year stint in Tampa, with Wallace Gilberry dropping from 73% of snaps to 58% as a result. And at linebacker, Maualuga, Vincent Rey, Vontaze Burfict, and Emmanuel Lamur were the four to see the most snaps in both 2014 and 2015, though the pecking order changed a bit.

In other words, the 2015 Bengals looked a whole lot like the 2014 Bengals. But in Washington, turnover was the story of the 2015 season. In 2014, Kirk Cousins started 5 games; last year, he started all sixteen. Matt Jones and Chris Thompson combined for over 50% of snaps at running back last year, reducing the heavier load endured by Alfred Morris in 2014. Tight end Jordan Reed caught 11 touchdowns and led the team in targets last year, but started two games and didn’t score in 2014.

On the offensive line, only LT Trent Williams was a holdover. With RG Chris Chester in Atlanta, 5th overall pick Brandon Scherff took over and started all 16 games. Morgan Moses, a third round pick in 2014 who started just one game as a rookie, took over at right tackle, relegating 2014 starter Tom Compton to the bench (he’s now in Atlanta with Chester). Kory Lichtensteiger (center) and Shawn Lauvao (left guard) both started in 2014, but were lost early in the season with injuries, putting Spencer Long (G) and Josh LeRibeus (C) into the lineup.

At safety, Ryan Clark, Brandon Meriweather, and Phillip Thomas were replaced by Dashon Goldson, Kyshoen Jarrett and Trent Robinson. At corner, Bashaud Breeland was the consistent presence year over year, but David Amerson (one of the lone blunders from Washington’s front office last year) and E.J. Biggers were replaced by Will Blackmon and DeAngelo Hall (limited to just 3 games in 2014). The front seven was relatively consistent year over year, though Jarvis Jenkins and Brian Orakpo were gone in 2015, with Preston Smith, Ricky Jean-Francois, Terrance Knighton coming on board. [continue reading…]

{ 13 comments }

On average, passing yards is a pretty meaningless measure of quarterback play.  Consider that the winning team and the losing team in a game both generally throw for about the same number of yards. Last year, for example, winning teams averaged 258 gross passing yards per game, while losing teams averaged 259. In 2013, it was 253 for the winners, 251 for the losers. In 2012, it was 246 for the winners, 248 for the losers. Since 2000, winning teams have averaged about 5 more passing yards per game, thanks mostly to 2009 (244 for winning teams, 222 for losing) and 2014 (261/242) as big outliers.

Joe Flacco, for example, has averaged 233 passing yards per game in wins and 231 in losses. But just because the averages are close together doesn’t mean every quarterback follows this same formula. And two of the best examples of that are Nick Foles and Blake Bortles.

Foles has lost 17 games where he was the starting quarterback; in those games, his average stat line was 21/38 for 214 passing yards, 0.7 TDs and 1.1 INTs. He also has started and won 19 games; in those games, his average stat line was 19/30, for 258 passing yards, 2.1 TDs, and 0.4 INTs. That paints the picture of a guy who is much better in wins than losses, which makes a lot of sense.  (Also, 7 of his 17 losses have come during his ugly time with the Rams, compared to just 4 of 19 wins.) [continue reading…]

{ 4 comments }

Trivia: Home/Road Wins in Division Games

Assume Team A and Team B are in the same division. In the first regular season matchup, Team A plays Team B at home, and wins. If this is all you know, how likely would you say Team A is to win in the rematch?

On one hand, we now know that Team A has to travel on the road for the rematch, and road teams win about 43% of the time. But we also have some evidence that Team A is better than Team B, so how does that impact things? And what about the idea that it’s hard to sweep a team — does that play into things?

I looked at all division matchups from 1970 to 2015. There were 1,297 times when the home team won the first matchup among division opponents — let’s call that team, Team A. What was Team A’s record in the rematch on the road at Team B?

Take a second to think about it.

….

[continue reading…]

{ 9 comments }

Guest Post: Adam Steele on True QB Talent

Adam Steele is back for another guest post. You can view all of Adam’s posts here. As always, we thank him for contributing.


Introduction: QB True Talent

One of the mandates for being a football analytics guy is to create a quarterback rating system, so today I’m going to throw my flag onto the field. However, I’m taking a different approach by asking a different question. I’m not trying to measure individual or team accomplishments, nor am I calculating value or attempting to predict the future. My goal is to answer a simple question: At a fundamental level, how good was he? As far as I’m aware, nobody has made a systematic attempt at answering this. Before we go any further, I need to add a vital disclaimer. My formula is statistically derived, and does not account for supporting cast, coaching, or anything else we can’t measure directly. So when I use the label “True Talent”, it really means “A rough estimate of true talent, based solely on statistics.”

I’ll save the gory micro details of True Talent’s calculation for another post, but today I want to outline how it works and ask for feedback on how to improve it. First, I’ve attempted to isolate what I believe are the four pillars of QB play: Passing Dominance, Passing Consistency, Ball Protection, and Rushing Ability. These categories are weighted by a) their importance within the framework of the overall QB skillet, and b) the level of control a QB has in converting the skill into results. The score for each category is era-adjusted, balanced by volume and efficiency, and scaled so zero is equal to replacement level. The overall True Talent score is simply the sum of the four category scores, minus five (the replacement level bar is higher for overall QB play compared to each of the pillars on their own). The overall score is expressed as percentage above or below replacement level. I’ve purposely rounded all figures to whole numbers to remind readers that these numbers are estimates, not precise measurements.

My plan is to eventually apply True Talent back to the 1940s, but for now we’re going to look at the last twenty seasons (1996-2015). I want to nail down the methodology before I go all the way back through history. Normally I wouldn’t subject readers to an arduously long table, but in this case I think it’s warranted. I want you to see how all levels of QB fare in my system, not just the best and worst. This table includes every QB season since 1996 with at least 100 dropbacks. I encourage you to sort by each category, by season, and by player to really get a feel for True Talent. [continue reading…]

{ 19 comments }

Smith nearly drops the chip on his shoulder

Smith nearly drops the chip on his shoulder

Measuring receiver play is really tricky, and that’s before you even get to things like supporting cast. But I want to at least put something out there to measure receiver play in the postseason, something that would be an improvement on just looking at the leaders in receiving yards. So here’s what I did. Let’s use two great playoff performances as our examples.

1) Calculate each player’s Adjusted Catch Yards in a game. In a 1974 playoff loss to Pittsburgh, Oakland wide receiver Cliff Branch had a great game. He caught 9 passes for 186 yards and 1 touchdown; giving him 5 yards for every reception and 20 yards for every touchdown, that translates to 251 Adjusted Catch Yards.

In 2012, Calvin Johnson dominated the Saints defenses in the lone playoff game of his career; Johnson finished with a 12/211/2 stat line, worth 311 ACY, tied (with Reggie Wayne against Denver) for the third most ACY in a playoff game since 1960.

2) But we need to account for era, and we should also account for the quality of the opposition. So I looked at every team since 1960, and calculated the ACY allowed to all opposing players in every regular season game. Then, I took the top 16 (or fewer, in non-16 game seasons) performances during the regular season to calculate the average ACY allowed by each defense to the top opposing receiver.

This is a very, very high baseline, of course, but I am trying to measure dominance. If a team allows 80 yards, on average, to the opposing WR1, then an 80-yard playoff performance shouldn’t stand out as special.

The 2011 Saints allowed an average of 155 ACY to the top 16 players it faced that year. As a result, Johnson gets credit for 156 ACY over expectation. The 1974 Steelers? Well, they allowed just 94 ACY to the top 14 players it faced during the regular season. That gives Branch 157 ACY over expectation.

So Branch slightly beats Megatron using this formula, as gaining 251 ACY against a defense that usually allows 94 is seen as a hair better than gaining 311 against a defense that usually allows 156. Is this formula perfect? Of course not, but it’s a start. Branch’s game checks in as the 8th best since 1960, while Johnson’s is 10th. The top game? That honor belongs to Steve Smith, naturally. [continue reading…]

{ 23 comments }

Thoughts on Thresholds Models of Collective Behavior

I would like to recommend Revisionist History, a new podcast from Malcolm Gladwell. His third podcast, The Big Man Can’t Shoot, nominally covered Wilt Chamberlain and his struggles at the free throw line. But, as is often the case with Gladwell’s work, it’s about so much more than that.

Of particular interest to me was the academic paper Gladwell cited, which formed the meat of the podcast. It was written by Mark Granovetter, back in 1978, and is titled Threshold Models of Collective Behavior. Here’s a link to the paper, which I recommend reading if you have the time.   But a couple of Granovetter’s examples resonated with me as being particularly relevant to us, and I would like to reproduce them here using a football analogy.

[Note: You may wonder why am I copying his work here? I find the application of this idea of threshold models of collective behavior to be worthwhile for our broader discussion, and I think the best way to encourage discussion of it here is to reproduce it in our world, rather than just telling you to go read a link.  Full credit, of course, belongs to the author.]

Many analysts, myself included, think that NFL teams are way too conservative when it comes to going for it on 4th down. In general, coaches do not call plays in an optimal way, and we have long understood that part of the problem is no coach wants to take the heat for failing unconventionally. So we just assume that “the NFL” is overly conservative on this point.

Now, let’s make some assumptions. “Being aggressive” is not a binary thing — there are hundreds of aggressive/conservative options/decisions that come up in a season — but to simplify things, let’s assume that coaches can either be aggressive or conservative. And, let’s assume that right now, all 32 head coaches are conservative.

However, let’s assume that all 32 coaches think being aggressive is better than being conservative, but they also have resistance to switching from being conservative to being aggressive. And these resistances are not uniformly held: these 32 coaches each have different thresholds on when to make that switch. Let’s say the Patriots would be willing to be aggressive as long as just one other team was aggressive first. This would mean New England is very eager to be aggressive, but just doesn’t want the spotlight solely on them. And let’s say the 49ers would be aggressive as long as two other teams became aggressive first. And the Ravens would be aggressive as long as three other teams were aggressive first. [continue reading…]

{ 22 comments }
Smith nearly drops the chip on his shoulder

Smith nearly drops the chip on his shoulder

When I think of the greatest games by a wide receiver in playoff history, my mind always travels to what Steve Smith against the 2005 Bears.  And while that game was remarkable — we’ll get to that in a bit — it’s the context that matters.

In the 2005 regular season, Smith was unstoppable; Dr. Z said that he was “simply the best in the game, filling the dual roles of possession receiver and downfield threat.” But Smith’s dominance was not just anecdotal, of course: Smith led the NFL in receiving yards, and was tied for the league lead in both receptions and receiving touchdowns, all while playing on a team that ranked 28th in pass attempts.

Then, in the first round of the playoffs, Smith caught 10 of 11 passes and scored both of Carolina’s touchdowns in a 23-0 win over the Giants.  And as if all of that wasn’t enough to make the Bears focus their efforts on Smith in the upcoming game, consider that during the regular season, Smith gained 169 yards against Chicago, the most the Bears allowed to any receiver all year.

So yeah, the Bears were game-planning for Smith.  And Chicago seemed pretty well-prepared to stop him: after all, the Bears allowed the fewest fantasy points to wide receivers during the regular season and had not just the top pass defense in the NFL, but one of the best ones in league history. And, in a neat twist of Panthers fate, Chicago’s defense was orchestrated by Ron Rivera, who was the Defensive Coordinator of the Year.

This was the best wide receiver in the NFL, coming off a huge playoff game, going into the Soldier Field to face the toughest defense on the planet.  The over/under was 31 points. The Panthers were held to 3 points in the regular season against Chicago. It was a cold and wet day. And Smith promptly caught 12 of 13 targets for 218 yards, seven first downs, and 2 touchdowns, and also ran 3 times for 26 yards.  [continue reading…]

{ 23 comments }
Coaches of two of the top 3 teams in college football... again.

Coaches of two of the top 3 teams in college football… again.

Meet the new boss, Nick Saban as always.

The Golden Nugget released the point spreads for 100 games this season, and Johnny Detroit was kind enough to pass along that data for purposes of this post.  With only data for 100 games, how am I able to conclude that Vegas views Alabama as the best team (or, at least, one of the top 2 teams)  in college football? Consider:

  • Alabama is a 6-point road favorite at Ole Miss this year. That is the only game this year (of the seven we have lines for) where Mississippi is an underdog, and the Rebels are an 8-point home favorite against Auburn and a 4.5-point home favorite against Georgia.  The Rebels finished 10th in the polls last year and are projected to be the 10th-best team this year, so this line says all you need to know about Alabama.
  • Against Auburn, Alabama is a 15-point home favorite (that’s a touchdown better than Ole Miss is against Auburn).   The Tigers were not great last year, but are still projected at #20 this year.
  • In Arkansas, the Crimson Tide are 8.5-point favorites.  In the other 3 home games for Arkansas, the Razorbacks are 7.5-point dogs to LSU (the #3 team by this methodology), 1-point underdogs to Mississippi, and a 2.5-point favorite against Florida.
  • Alabama is a 15-point favorite at home against Mississippi State and a 14-point home favorite against Texas A&M.  Both of those teams are projected to be, by Vegas, top 30 teams this year.
  • In Tennessee, Alabama is a 1-point dog, but the Vols are projected as the 6th best team this year! Tennessee is a pick’em in Georgia, a 5-point favorite in College Station, an 11-point favorite at home against Florida, and a 13-point favorite in a neutral site game against Virginia Tech.
  • LSU is projected to be the 3rd best team in college football. The Tigers are an 11-point favorite at home against MSU, a 9.5-point home favorite against Ole Miss, 7.5-point road favorites in Florida and Arkansas, a touchdown favorite in Auburn, a 6-point favorite in College Station, and – only – a 2.5-point home favorite against Alabama.

You may be wondering, how do we know how good Alabama’s opponents are? Well, we can imply the ratings of each team in college football based on these points spreads.  I explained how to do this last year, but here is the refresher:

The system is pretty simple: I took the point spread for each game and turned it into a margin of victory, after assigning 3 points to the road team in each game. Do this for every game, iterate the results hundreds of times ala the Simple Rating System, and you end up with a set of power ratings.

Two quick notes about the rankings.

1) These are not intended to be surprise. The methodology may be somewhat complicated, but all these ratings are intended to do is quantify public perception.

2) These are not “my” ratings. These are simply the implied ratings based on the Vegas (or, more specifically, the Golden Nugget) points spreads; nothing more, nothing less.

Below are the ratings for 51 college football teams. In the table below, I’ve included the number of games for which we have point spreads for each team on the far left. The “MOV” column shows the home field-adjusted average margin of victory for that team, the “SOS” column shows the average rating of each team’s opponents (for only the number of games for which we have lines), and the “SRS” column shows the school’s implied SRS rating. As you can see, Alabama is projected to be the strongest team in college football, but Oklahoma is just a hair behind: [continue reading…]

{ 5 comments }

Checkdowns: AFC/NFC Players of the Week

Hey look, these two again!

Hey look, these two again!

Pro-Football-Reference.com is constantly adding fun stuff to the site, and I just noticed that this page, listing all AFC/NFC Players of the Week going back to 1984. Some thoughts:

  • Brady was so honored five times in 2007. That was the most ever, although it was equaled by Cam Newton last year. Barry Sanders ’97, Terrell Davis ’98, and Tomlinson ’06 are the only non-quarterbacks with four such honors in a season.
  • Joe Montana had 8 OPOW awards in the NFC, and 5 in the AFC. No other player has more than two in both conferences (Brees has 20/2; Esiason has 10/2).

[continue reading…]

{ 2 comments }

Thomas Rawls and Great Rookie Seasons

Rawls is one of the best running backs to earn a few hundred grand to play for Pete Carroll.

Rawls is one of the best running backs to earn a few hundred grand to play for Pete Carroll.

Thomas Rawls had an incredible rookie season. He was the only player, rookie or veteran, with two games with at least 160 rushing yards in 2015. His heat map was otherworldly, with the highlight being that an astounding 10% of his runs went for at least 15+ yards. And he led the league in yards per carry, as Rawls averaged 5.65 yards per carry while rushing for 830 yards. Rawls ranked 1st in DYAR, 1st in Success Rate, and 2nd in DVOA according to Football Outsiders.

In the historical context, Rawls also stands out. The table below shows all rookies since 1970 with at least 700 rushing yards and 5.00 yards per carry: there are only 18 of those players, and Rawls has the second highest YPC average in the group: [continue reading…]

{ 14 comments }

Kevin Durant and Hardy Nickerson

Kevin Durant made headlines this week by announcing that he was leaving Oklahoma City and joining the Golden State Warriors. Durant is one of the best players in the NBA, and chose to join the team that just set the single-season record for NBA wins. Which made me wonder: who is the most Durant-like player in NFL history? This would be akin to say, LaDainian Tomlinson joining the 2008 Patriots.

But that, of course, didn’t happen. Which means there is no perfect example. The best one I could find, by the numbers (more on this in a minute), is a wholly unsatisfying one: Hardy Nickerson joining the 2000 Jaguars. Yes, you surely remember that sexy tale of intrastate drama: Nickerson, at age 34, made his fourth straight Pro Bowl in 1999. The voters had Ray Lewis (first-team All-Pro by just about everyone) as the best inside linebacker in football, but Nickerson joined Junior Seau and Zach Thomas in picking up the rest of the awards (Nickerson was a 2nd-team Associated Press choice, a 1st-team Football Digest and USA Today Choice, and was the NFC first-team choice by Pro Football Weekly). The Bucs had a dominant defense, and Nickerson therefore picked up 17 points of AV.

That year, the Jaguars went an NFL-best 14-2. So Nickerson, one of the best players in football, joined the best team in football. That’s the Durant-like quality to his move, even if he’s a DINO (Durant In Name only). I looked at every player to change teams from 1960 to 2015, and measured their AV in the previous season and their new team’s wins from the previous season. I graphed that below, with wins on the X-Axis and AV on the Y-Axis.  Nickerson, who joined a 14-win team and had an AV of 17, is in a red dot: he stands out the most of any player on here, I think. [continue reading…]

{ 10 comments }

Guest Post: Bryan Frye on Adjusted Drive Yards

Friend of the program Bryan Frye is back for another guest post. As regular readers know, Bryan operates his own fantastic site, http://www.thegridfe.com. You can view all of Bryan’s guest posts here, and follow him on twitter @LaverneusDingle.


For some time, I have wanted to create a new metric that used elements from Total Adjusted Yards (TAY) in order to quantify a team’s production on each drive. Past work from both Chase and Brian Burke has given us insight into the value of touchdowns, interceptions, fumbles, and first downs, translated into yards. This work has been fundamental in the development of stats like Adjusted Net Yards per Attempt, Adjusted Rushing YardsAdjusted Catch Yards, and TAY.

Those metrics have given us valuable insight regarding statistical measurement of individual player performance. I’ve also used TAY to measure the output of offenses and defenses.

However, I wanted to attach generic values to every way a drive can end. [1]With the exception of kneel down drives to end halves or games, as those don’t demonstrate an offense’s (or defense’s) ability to actually play the game. This is not a rigorous study, and it is meant to be a starting point for future research rather than a conclusive formula to govern the way anyone interprets on-field action.

With that in mind, I’ll briefly cover the generic yardage values for various drive outcomes. [continue reading…]

References

References
1 With the exception of kneel down drives to end halves or games, as those don’t demonstrate an offense’s (or defense’s) ability to actually play the game.
{ 43 comments }

Brad Oremland is a longtime commenter and a fellow football historian. Brad is also a senior NFL writer at Sports Central. He’s also a semi-regular writer here, and you can view all of Brad’s Football Perspective writing at this page. Brad is working on a WR Project where he analyzes the best WRs over various ten year periods. That work is being produced over at Sports-Central, but Brad has offered to have it reproduced here as well. As always, we at the FP community thank him for his work.

Previous Best WRs By Decade Articles:


Last year, I wrote an article breaking down the best quarterbacks by decade, followed by in-depth profiles of the greatest QBs in history. This year, I combined those two themes in a look at the best wide receivers ever, broken into decades. [continue reading…]

{ 39 comments }

Adjusted Completion Percentage

In 1991, Dave Krieg led the NFL in completion percentage. He completed a career-high 65.6% of his passes, and while that mark was very good for that era, it doesn’t mean Krieg was great that season. In fact, he arguably wasn’t even good: Krieg actually finished just 24th in ANY/A that year.

One reason, I think, that Krieg was able to lead the NFL in completion percentage is because Krieg “ate” a lot of his incomplete passes. What do I mean by that? Krieg took a ton of sacks — he was sacked every ten times he dropped back to pass. When under duress, some quarterbacks eat the ball, to avoid an interception; that’s bad (well, it’s better than n interception) but it doesn’t get graded that way when calculating completion percentage. Other quarterbacks will throw the ball away; that’s good (assuming it isn’t intercepted) because no yards are lost, but it does hurt the quarterback’s completion percentage.

Even ignoring the yards lost due to sacks, fundamentally, a sack is no better than an incomplete pass. So why are quarterbacks who take sacks rather than throw the ball out of bounds given an artificial boost when it comes to completion percentage? Well, that’s largely just an artifact of how the NFL always graded things. The NFL was not always good at recording metrics, and somewhere along the way, sacks were either included as running plays, ignored, or included as pass plays. I don’t think a lot of thought went into it, but in my view, it makes the most sense to include sacks in the denominator when calculating completion percentage. Otherwise, we give undue credit to quarterbacks that take a lot of sacks, and penalize quarterbacks who throw the ball away when under pressure. [continue reading…]

{ 35 comments }

Happy Independence Day, folks. July 4th, 1776 was the day our forefathers declared independence in a remarkable document that’s worth your full read. We at Football Perspective wish you a very happy, and very safe, Fourth of July.

153 years after America declared its independence, Al Davis was born. On January 30th, 1960, the AFL awarded Oakland the last franchise for the new league. Then, in early April, the team was named:

Screen Shot 2016-07-04 at 9.27.30 AM [continue reading…]

{ 6 comments }

If you have been to PFR in the past couple of days — and if you read this site, you’ve probably been there in the last few hours — you’ve seen that PFR has undergone a redesign. Most website redesigns are frustrating, but I think PFR has done a nice job of making it both easier to use on mobile while not changing too much around.

The PFR guys will be checking the comments section here, so if you have any bug requests, suggestions, comments, or just want to give those guys a well-deserved “Thank you!”, let your voice be heard.

{ 39 comments }

Tannehill escapes the numbers, if not the pass rush

Tannehill escapes the numbers, if not the pass rush

In each of his four seasons in the NFL, Miami quarterback Ryan Tannehill has been responsible for at least 96% of his team’s pass attempts. In fact, over the last three years, only 13 pass attempts for the Dolphins have come from someone other than Tannehill. He’s been the entrenched starter since week 1 of his rookie year.

There have been 88 quarterbacks since 1970 who have taken at least 90% of the same team’s pass attempts in every year in any four-year window. That includes eight such streaks that cover the last four years (Tannehill, Eli Manning, Matthew Stafford, Matt Ryan, Philip Rivers, Drew Brees, Tom Brady, and Russell Wilson).

Among non-proprietary measures, my preferred measure of quarterback play is Adjusted Net Yards per Attempt, which is yards per attempt with adjustments for touchdowns, interceptions, and sacks. The fine folks at Pro-Football-Reference.com have created a passing index for this (among other) stat, known as ANY/A+, where 100 represents league average, and 85 and 115 represent one standard deviation below/above average. Tannehill’s ANY/A+ was 92 his rookie year, 87 in 2013, 96 in 2014, and 95 last year. [continue reading…]

{ 10 comments }
Previous Posts