≡ Menu

I’m very short on time this week, so here’s a fun trivia question. Last week, I noted that Justin Blackmon gained 1,201 receiving yards in his last 16 games. As it turns out, if Blackmon never plays in another NFL game, that would set the record for most receiving yards in a player’s final sixteen games (this excludes all active players, of course).

Who holds that record now? Two players gained just over 1,100 yards in their final sixteen games. Can you name them?

Trivia hint 1 Show


Trivia hint 2 Show


Trivia hint 3 Show

Click 'Show' for the Answer Show

Rounding out the top five: Hart Lee Dykes caught 71 passes for 1,098 yards in his final sixteen games, as an off-the-field incident (which has nothing on this off-the-field incident) and repeated knee injuries ended his career. Finally, Terrell Owens gained 80 receptions, 1,087 yards, and 10 touchdowns in his last sixteen games.

{ 9 comments }

Quarterback Losses Trivia

Can you name the two quarterbacks with the most losses in a single season?

Trivia hint 1 Show


Trivia hint 2 Show


Trivia hint 3 Show

Click 'Show' for the Answer Show


What about the quarterback with the most losses during his rookie year?
Trivia hint 1 Show


Trivia hint 2 Show


Trivia hint 3 Show

[continue reading…]

{ 4 comments }

Bill Walsh and Joe Montana Must Change to Succeed

Lots of stats, but few wins have defined the Walsh/Montana era

Lots of stats, but few wins have defined the Walsh/Montana era.

The San Francisco Times
September 23rd, 1981

I’m not here to tell you that Bill Walsh is a bad coach.  And I’m not here to tell you that Joe Montana can’t possibly succeed in the NFL. It’s just that if they want to still be here in two years, some changes are in order.

Walsh comes from the great Paul Brown coaching tree, and like his mentor, Walsh likes to throw the ball. That strategy, while unconventional, can work well when you have a Hall of Famer like Otto Graham or even a great talent like Ken Anderson. It doesn’t work when you have a scrappy young player like Montana. And lest you forget, Brown never won anything without Graham, and Brown’s Bengals went 55-56-1 with zero playoff wins.

Undeterred by that evidence, Walsh went about bringing Basketball On Cleats to Candlestick Park. Was his first year a success? San Francisco finished third in passing yards, 4th in first downs, and 6th in total yards. Quarterback Steve DeBerg led the NFC in completion percentage, too. But while Walsh’s horizontal passing game led to lots of yards and first downs, the team won only two games.  Running backs Paul Hofer and Wilbur Jackson each caught 50 passes, but to what end?

They were two of only nine running backs to hit the 50-catch plateau in 1979, but what good is it passing to your running backs when you can’t attack a defense vertically? In a telling statistic, Baltimore was the only other team to have two running backs catch 50 passes, and the Colts went 5-11. The 49ers ranked 3rd from the bottom in rush attempts that season, but were above average in yards per carry.  Maybe somebody should tell The Genius that San Francisco could have benefited from more runs and fewer passes.

The man who thinks he’s the smartest person in every room surely was going to learn from his 1979 failures, right? In 1980, Montana was handed the reins.  How did he do? Walsh continued with his horizontal offense: Montana completed 64.5% of his passes, the 4th highest by a quarterback in NFL history (behind the great Ken Stabler and two Brown robots, Anderson and Graham). But the team went just 2-5 in Montana’s starts.

Fullback Earl Cooper was a nice player at Rice, but he was drastically overused by the 49ers last season.  In addition to a team-high 171 carries, he caught 83 passes — but for only 567 yards.  Cooper became the first player in NFL history to catch 80 balls and not get 700 yards, much less 567 yards. Cooper averaged an anemic 6.8 yards per reception, and prior to last year, no player with fewer than seven yards per catch had come within 20 passes of Cooper’s 83 grabs. In other words, the 49ers relied more heavily on a player doing so little more than any team in NFL history.  Sure, the 49ers ranked 5th in passing yards, but they ran just 415 times, the second fewest number in the league. The team led the NFL in pass attempts and went 6-10 with an eight-game losing streak in the middle of the season. Genius. [continue reading…]

{ 33 comments }
Rivers was outstanding in 2013, despite this throwing motion

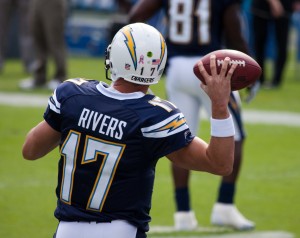
Rivers was outstanding in 2013, despite this throwing motion.

The Denver Broncos set numerous offensive records last year. The Chip Kelly Eagles had a fascinating offense that was lethal for stretches. The Saints offense was its usual efficient self, and the Chicago Bears under Marc Trestman had one of the best offensive years in franchise history.

Yet all of those teams had at least 61 drives last year that ended in a punt. San Diego , meanwhile, punted just 56 times. The Chargers only had 21 turnovers, which means only 77 San Diego drives could be clearly labeled as failures, or “bad drives.” [1]The Chargers were 5/6 on fourth down attempts, so it’s not as though these numbers are skewed by failed fourth down attempts.

That’s pretty impressive; the 2013 Chargers were just the 36th team during the 16-game era to have fewer than 80 “bad drives” in a season. On the other hand, the Chargers were one of just five of those teams to score fewer than 400 points. San Diego’s offense was very efficient last year, but the 77 “bad drives” statistic is a bit misleading. That’s because the team had just 158 total drives last year according to Football Outsiders, while the average team had 186 drives.

Why did the Chargers have the fewest drives in the NFL? A bad defense certainly helped limit the team’s number of offensive drives: San Diego forced only 82 “bad drives” all year, too. But the main reason was that the offense was not just efficient, but uniquely efficient. According to Football Outsiders, San Diego averaged 3:22 per drive, a full 15 seconds more than the #2 team in that metric, Carolina. And the Panthers were the only other team to average at least three minutes per drive. One reason for the long time of possession is that the Chargers moved at a glacial pace between plays, rating as the 2nd slowest team according to Football Outsiders. The other teams in the bottom four in pace were all run-heavy — Carolina, Seattle, and San Francisco — which marks yet another way in which the Chargers were outliers. In several metrics — first downs per drive, yards per drive, and points per drive — San Diego and Denver were the top two teams in the NFL.  But in pace, Denver ranked 4th, making the Broncos offense look and feel much different than San Diego’s attack.

Another reason the team’s average drive took so long to complete: San Diego averaged 6.85 plays per drive, with New Orleans second in that statistic with 6.35 plays. That’s because the Chargers had a very horizontal passing attack. According to NFLGSIS, Philip Rivers ranked 6th from the bottom in average length of pass at 7.75; only Jason Campbell, Sam Bradford, Matt Ryan, Alex Smith, and Chad Henne threw shorter passes. With the exception of Ryan, none of those quarterbacks came close, however, to matching Rivers’ league-leading completion percentage. What we have here is your classic hyper-efficient, short-area passing game, and the Chargers executed it beautifully.

In fact, here’s another unique part of the San Diego offense: it rarely targeted wide receivers. San Diego was one of just three teams to throw more passes to non-wide receivers than to wide receivers. Here’s how to read the table below: the Chargers threw 25% of all pass attempts to running back, 47.1% to wide receivers, and 27.7% to tight ends. Based on those percentages, San Diego ranked 4th in percentage of pass attempts to running backs, 30th in percentage of pass attempts to wide receivers, and 2nd in percentage to tight ends. [continue reading…]

References

References
1 The Chargers were 5/6 on fourth down attempts, so it’s not as though these numbers are skewed by failed fourth down attempts.
{ 19 comments }

James Lofton is the Yards Per Catch King

Yesterday, we looked at which quarterbacks were the best at yards per completion after adjusting for league average. Today, we’ll do the same thing for wide receivers and yards per completion.

Lofton tries to hide from the creamsicle uniforms.

Lofton tries to hide from the creamsicle uniforms.

A small tweak is necessary to the formula. You can skip down to the results section if you don’t care about the math, but I suppose most of my readers want to know what goes in the sausage. We can’t just use league-wide yards per completion rates, since that average includes receptions by non-wide receivers. One way around this is to calculate the league average YPC for wide receivers only; that’s easy to do for 2013, but less easy to do for the earlier years of NFL history when the distinction among the positions was not so clear. So, after playing around with a few different methods, I’ve decided to instead use 120% of the league average YPC rate, and give wide receivers credit for their yards over expectation using that inflated number.

For example, in 1983, James Lofton caught 58 passes for 1,300 yards for the Packers, a 22.4 YPC average. That year, the average reception went for 12.63 yards; 120% of that average is 15.2, which means we would give Lofton credit only for his yards over the product of 15.2 and 58, or 879. Since Lofton actually had 1,300 yards, he gets credit for 421 yards over expectation.

The next year, Lofton caught 62 passes for 1,361 yards (22.0). Since the average reception went for 12.66 yards, Lofton gets credit for his yards over (120% * 12.66 * 62), or 942. Lofton therefore is credited with 419 yards over expectation, nearly identical to his performance in the prior year. In fact, those were the 10th and 11th best season in NFL history by this method. [continue reading…]

{ 10 comments }

In 2013, the average completion went for 11.63 yards. That’s a pretty low number historically, although it’s actually a bit higher than some of the recent NFL seasons. Take a look at how Yards per Completion has generally been declining throughout NFL history:

ypc

If you want to discuss the quarterbacks who excelled in this metric, controlling for era is crucial. One simple way to measure the best passers when it comes to YPC is to measure how they fare in this metric relative to league average, and multiply that difference by the player’s number of attempts. For example, Nick Foles averaged 14.2 YPC last year, which was 2.6 YPC above average. Over the course of his 317 pass attempts, we could say he provided 529 yards above the average completion. That was the highest in the NFL last year, while Matt Ryan produced the lowest average. [continue reading…]

{ 18 comments }

2014 Football Outsiders Almanac

If you’re reading this blog, chances are you already know all about our friends at Football Outsiders and the terrific analysis they provide every year. However, if by some chance you don’t know of them, or maybe you haven’t heard about their outstanding annual book, they now have copies of the 2014 Football Outsiders Almanac available for purchase. The book is jam-packed with FO’s signature data (including game-charting stats), plus the usual stat-geeky essays, team and player previews, and 2014 projections. And it’s not just the NFL, as Football Outsiders has some pretty sharp minds (Matt Hinton, Bill Connelly, Brian Fremeau) covering the college game, too.

For the second year in a row, I have contributed to the Almanac. I wrote team essays for the Giants  and Jets (only one of those teams has a great defense and a terrible offense!), along with player comments for both of those teams. If you enjoy my work here, you’ll probably enjoy reading what I wrote about those teams.

Football Outsiders has been a supporter of Chase Stuart for a while and Football Perspective from the beginning. But don’t confuse this for charity post: the FOA is a great guide, and I’m sure anyone who buys it will be very happy.

{ 5 comments }

Quarterback Wins: Outlier Seasons

Testaverde led the Jets to the AFCCG in 1998

Testaverde led the Jets to the AFCCG in 1998.

The 1998 season was one of my favorite years in NFL history. It was also a pretty weird one. We had Terrell Davis rushing for 2,000 yards, rookies Randy Moss and Fred Taylor making defenses look silly, and a quartet of old quarterbacks stun the football world. Doug Flutie came out of nowhere Canada to lead the Bills to a 7-3 record after being out of the NFL for nine years. Randall Cunningham, who had retired after the ’96 season, came off the bench in ’98 to produce one of the best backup seasons in NFL history. The other two quarterbacks are the stars of this post.

Vinny Testaverde had a very up-and-down career, although he was almost certainly a much better quarterback than you remember. Okay, Testaverde has lost more games than any other quarterback, but he played on some really bad teams throughout his career. Testaverde retired with a career winning percentage of 0.423. In 1998, he started 13 games for the Jets; based on that career winning percentage, we would have expected him to win 5.5 games in 1998. Instead, Testaverde went 12-1 in the regular season, giving him 6.5 more wins than we would expect. If that sounds remarkable to you, it should: that’s the 2nd largest discrepancy of any quarterback in NFL history in a single season (minimum 40 career wins). [continue reading…]

{ 18 comments }

Thoughts on Running Back Yards per Carry

The man in odd-numbered games

The man in odd-numbered games.

Regular readers know that I’m skeptical of using “yards per carry” to evaluate running backs. That’s because YPC is not very consistent from year to year. But it’s also not consistent even within the same year. For example, In 2013, Giovani Bernard rushed 92 times for 291 yards in even-numbered games last year, producing a weak 3.16 YPC average. But in odd-numbered games, Bernard averaged 5.18 YPC, rushing 78 times for 404 yards!

Jamaal Charles also showed a preference for odd-numbered games, averaging 5.80 YPC in games 1, 3, 5, etc., and only 3.96 YPC in even-numbered games. Buffalo’s C.J. Spiller had a reverse split, producing 5.57 YPC in even games and 3.61 YPC in odd games.

Okay, this stuff is meaningless, you say. Who cares about these random splits? Well, there are a couple of reasons to care. For starters, these splits serve as a great reminder that splits happen. If Spiller averaged 3.61 YPC in the first half of the year and 5.57 in the second half, the narrative would be that Spiller was finally healthy by the end of the year, and was set up for a monster 2014 campaign. Meanwhile, if Charles had seen his YPC fall from 5.8 YPC in the first eight games to 3.96 in the back eight, the narrative would be that he couldn’t handle a heavy workload, was breaking down, and could be a huge bust this year. Narratives are easy to invent, and remembering that “splits happen” is an important part of any analysis. [continue reading…]

{ 26 comments }
The core of the Manning era Colts

Presumably the picture that caused the NFL to consider eliminating the Pro Bowl.

Last week, I looked at the top receivers and the quarterbacks who threw it to them. Today, we flip that question around and look at which receivers the top quarterbacks threw to. I used the exact same methodology from the previous post, so please read that for the fine details.

For Peyton Manning, 20% of his career passing yards came via Marvin Harrison, and another 16% came from Reggie Wayne.  Both of those numbers will decline the longer Manning plays, of course, but for now, those players dominate his list (Dallas Clark is third at seven percent). That’s a pretty stark departure from other quarterbacks such as say, I dunno, Tom Brady.  For the Patriots signal caller, Wes Welker is his top man (13%), followed by Deion Branch (9%), Troy Brown (7%), Rob Gronkowski (7%), and then Randy Moss (5%).

The table below lists the top 7 receivers for each of the 200 quarterbacks with the most passing yards since 1960. The list is sorted by the quarterback’s career passing yards, and I have removed the percentage sign from the table to enable proper sorting.  For example, here’s how to read Brett Favre’s line.  He’s the career leader in passing yards, and played from 1992 to 2010.  His top receiver was Donald Driver (9%), followed by Antonio Freeman (9%), Robert Brooks (6%), Sterling Sharpe (5%), Bill Schroeder (5%), Ahman Green (4%), and William Henderson. [continue reading…]

{ 12 comments }

Johnson's target ratio is no joking matter

Johnson's target ratio is no joking matter.

Yards per Route Run, a metric tabulated by Pro Football Focus, is one of my favorite statistics to use to examine wide receiver performance.  To me, it’s the wide receiver version of yards per pass, as it takes production and divides that by opportunity.  However, there are some folks who prefer Yards per Target to YPRR, under the idea that a target is a better way to define an opportunity than a route.

Which view is correct?  Fortunately for our analysis, Yards per Route Run can be broken down into two metrics: Yards per Target and Targets per Route Run.  In other words, YPRR already incorporates Yards per Target, but it adjusts that statistic for Targets Per Route Run.  This makes it very easy for us to compare the two statistics: essentially, the question boils down to how valuable it is to know a receiver’s number of Targets per Route Run.

For example, Kenny Stills had the most extreme breakdown of any player in the NFL in 2013. He was off-the-charts good in yards per target (13.9), but saw targets on just 9% of his routes run last year. As a result, Stills averaged just 1.29 yards per route run, a pretty unimpressive figure.

Steve Johnson was the anti-Stills. While Johnson had the worst year of his career since becoming a Bills starter, he still managed to pull down targets on 25% of his snaps. However, he averaged only 6.3 yards target, leaving Johnson with a poor 1.56 yards per route run average. Of course, when comparing Stills’ numbers to Johnson’s, one might note that Johnson was playing with EJ Manuel and Thaddeus Lewis while Stills was playing with Drew Brees, which provides some explanation for the drastic differences between the two receivers in yards per target. [1]I suppose one counter to that would be that Stills was competing with Jimmy Graham, Marques Colston, and the Saints obsession with throwing passes to running backs, while Johnson was competing with … Continue reading But putting the quarterbacks issue aside, the question today is a more global one.

Since the only difference between YPRR and Y/T is the metric “targets per route run,” it’s worth asking: is Targets Per Route Run a metric worth looking at? Is it more useful than Yards per Target? Well, the word “useful” will mean different things to different people. What I’m curious about is the stickiness of each metric. And there is a pretty clear answer to that question.

Among the three metrics — YPRR, Y/T, and TPRR — it’s Targets Per Route Run that’s the most consistent from year to year. From 2007 to 2012, there were 344 wide receivers who saw at least 40 targets in Year N, and then played for the same team and saw at least 40 targets in Year N+1. [2]While there are some issues with survivorship bias here, I’m not sure (1) how to get around them, and (2) that those concerns bias the results in a way that’s more biased towards one of … Continue reading [continue reading…]

References

References
1 I suppose one counter to that would be that Stills was competing with Jimmy Graham, Marques Colston, and the Saints obsession with throwing passes to running backs, while Johnson was competing with Scott Chandler, Robert Woods, and Fred Jackson for targets.
2 While there are some issues with survivorship bias here, I’m not sure (1) how to get around them, and (2) that those concerns bias the results in a way that’s more biased towards one of the variables we’re examining than the others.
{ 26 comments }

Smith struggled as a rookie; then again, so did many greats

Smith struggled as a rookie; then again, so did many greats.

In 2013, Geno Smith had the worst passer rating (66.5) in the NFL. The year before, Mark Sanchez had a passer rating of 66.9, which was very nearly the lowest in the league (Matt Cassel had a rating of 66.7). But while the Jets didn’t quite do it, a couple of teams have managed to have different quarterbacks in consecutive seasons finish with the lowest passer ratings in the NFL (minimum 14 attempts per game).

In 2000, a second-year Akili Smith was given the starting job and posted a miserable 52.8 passer rating. A year later, Jon Kitna took over for the Bengals, and his 61.1 rating was the worst among qualifying passers.

In 1993, Mark Rypien finished with the worst passer rating in the league two years after winning the Super Bowl. Washington drafted Heath Shuler the following year, and as a rookie, Shuler finished with the worst passer rating in the NFL.

The Seahawks almost pulled off this feat in the prior two years. In 1992, Stan Gelbaugh had the worst passer rating as part of the historically inept Seattle passing attack. In 1991, Jeff Kemp finished with the worst passer rating in the league. Kemp, the son of Jack , started the year with Seattle but finished it with Philadelphia. He didn’t have enough attempts with the Seahawks to qualify, so I probably wouldn’t include the ’91-’92 Seahawks in this category, although that may be pickin’ nits.

The table below shows the quarterbacks to finish with the lowest passer rating in the NFL in each year since the merger. For each passer, I’ve included his age as of September 1st of that season, his traditional metrics, and his passer rating. [continue reading…]

{ 21 comments }

Fantasy: Running Back Workload Part II (FBG)

Last week, I began my analysis of how to measure workload for running backs. Today brings Part II, another attempt to analyze workload and fantasy production.

Last year, Joique Bell finished as the 15th best running back in fantasy football. Prior to 2013, Bell had just 82 career carries, all of which came in 2012.  Meanwhile, Marshawn Lynch finished as RB5, but he had 1,452 carries prior to the 2013 season. Both players were 27 years old last year, but they had drastically different career workloads.

One obvious issue that comes up when comparing high-workload to low-workload players is that there is often a large talent gap, and Bell and Lynch present that quite clearly. Bell was an undrafted free agent out of Division II Wayne State, while Lynch was a first round pick who played in the Pac-10. What I’ll try to do today is control for “player ability” by looking at the player’s VBD in the prior season. For example, Lynch had 125 points of VBD in 2012, while Bell had 0.

From 1988 to 2013, there were 77 running backs who had a top-24 finish during their age 27 season. One thing we can look to see is whether these players “benefited” from having low mileage up to that point in their careers. I performed a regression analysis using three inputs — Carries in the player’s age 26 year (for example, 315 for Lynch), his career carries as of the end of his age 26 season (1,452 for Lynch), and his VBD in his age 26 season (125).  My output was VBD in the player’s age 27 year.  Here was the best-fit formula:

You can read the full article here. And if you have thoughts on how else to study this issue, leave them in the comments.

{ 1 comment }

A couple of weeks ago, I posted a list of the best rushing teams in 2013 using Adjusted Yards per Carry. That metric, you may recall, is calculated as follows:

Rushing Yards + 20*RushingTDs + 9*RushingFirstDowns

We can use the same formula to grade every team across history. To account for era and quantity (having more above-average rush attempts is better), I calculated each team’s AdjYPC average, subtracted the league-average AdjYPC average, and multiplied that difference by the team’s number of rush attempts.

The top team by this method isn’t even an NFL team: it’s the 1948 San Francisco 49ers. You may recall that the 49ers and Browns staged two epic battles that season, and may have been the best two teams in pro football. That season, San Francisco averaged 6.1 yards per carry and rushed for 35 touchdowns on 600 carries; along with 152 first downs, and the 49ers averaged 9.5 Adjusted yards per Carry. That’s the highest average ever, just narrowly topping the production of the franchise’s Million Dollar Backfield six years later. Joe Perry was on both teams because Joe Perry was the man.

The table below shows the traditional rushing data for the top 200 rushing teams of all time; the VALUE column represents the number of Adjusted Rushing Yards produced above average (i.e., relative to the league average AdjYPC). I’ve also listed the three most prominent rushers on each team. [continue reading…]

{ 8 comments }

Ellington races for a long touchdown

Ellington races for a long touchdown.

In November, I wrote about the unique running back by committee taking place in Arizona. At the time, Rashard Mendenhall was averaging 3.1 yards per carry, while backup Andre Ellington was averaging 7.2 yards per rush on 54 carries. I thought it would be fun to revisit the Ellington/Mendenhall time share now that the season is over, and to use a slightly different methodology.

Mendenhall ended the season with 687 yards on 217 yards, a 3.2 yards per carry average. Ellington finished his rookie year with 118 carries for 652 yards, producing 5.5 yards per rush. One way to measure the magnitude of the difference in the effectiveness of these two players — and boy was there a large difference — is to simply look at the delta in the players’ yards per carry averages. In this case, that’s 2.36 yards per carry.

Where does that rank historically? Some teams — I’m looking at the Lions in the early Barry Sanders years — gave only a handful of carries to their backup running backs. So one thing we can do is to take the difference in the yards per carry between the team’s top two running backs and multiply that number by the number of carries by the running back with the lower number of carries. In each instance, I’ve defined the running back with the most carries as the team’s RB1, and the running back with the second most carries as the RB2. In Arizona’s case, that would mean multiplying -2.36 (Mendenhall’s average, since he was the RB1, minus Ellington’s average) by 118, the number of carries Ellington recorded. That produces a value of -278. [continue reading…]

{ 28 comments }

Is Chris Johnson Better than Chris Ivory?

Over the last three years, Chris Johnson has rushed 817 times for 3,367 yards, a 4.12 yards per carry average. Over the last three years, the Jets have had running back seasons where a rusher recorded at least 150 carries: Bilal Powell and Chris Ivory in 2013, and Shonn Greene in both 2011 and 2012. Collectively, in those four seasons, the group rushed 887 times for 3,647 yards, a 4.11 yards per carry average.

If you put a lot of stock in yards per carry as a metric, it would seem as though Johnson won’t be bringing much to New York in the running game. But today we’re going to take a closer look at the production of Johnson and the Jets back. And I’ve created some graphs that I think are pretty interesting.

Because Johnson has 817 carries since 2011 and the Jets backs have 887, we can’t just compare things on a carry per carry basis (i.e., 20th best carry for each).  So instead, I’m going to look at their percentile ranks — i.e., how many yards they gained on X percent of their carries. This first chart looks at the percentile ranks for Johnson and the Jets backs over the last three years. For example, 22% of Johnson’s runs have gone for negative yards or no gain, while the 22nd percentile of Jets runs has been for one yard. In the table below, the X-axis represents percentile, and the Y-axis represents yards gained. In this chart, being higher is better, and the Jets green line is higher or even with Johnson’s blue line on about 75% of all runs. Then, at the end, things switch, with Johnson being more productive with respect to each group’s best runs. [continue reading…]

{ 11 comments }

Rushing EPA and Yards per Carry

Today I want to look at how traditional rushing statistics compare to rushing Expected Points Added, one of the main stats used over at Advanced Football Analytics. In my analysis, I used the EPA numbers for each team in each season from 2002 to 2013.

Stickiness from year to year

Yards per carry is not a sticky metric: by that, I mean, it is not very consistent from year to year. The correlation coefficient between a team’s yards per carry in Year N and yards per carry in Year N+1 was just 0.31. Sometimes the square of the correlation coefficient is described in terms of “explanatory power”: loosely speaking, this means roughly 10% of a team’s YPC average in Year N+1 can be explained by its YPC average in Year N.

Now, a lot of metrics aren’t sticky from year to year, because the NFL is a highly competitive league. In fact, Rushing EPA per play has a lower correlation coefficient from year to year at just 0.30. That’s a strike against EPA. On the other hand, Burke’s success rate metric has a CC of 0.39, which is more impressive. The CC for Net Passing Yards per Attempt year over year is 0.43. [continue reading…]

{ 28 comments }

One of my first posts at Football Perspective was one of my favorites: the top receivers and the men who threw it to them. I like referencing that post from time to time, so I decided to update the numbers through the 2013 season.

I looked at all regular season games since 1960 [1]Sorry, Don Hutson., and calculated the percentage of passing yards produced from each quarterback. Then, I assigned that percentage to the number of receiving yards for each receiver. For example, in this Raiders game from 1995, Vince Evans threw for 75% of the Raiders passing yards, and Jeff Hostetler was responsible for the other 25%. Therefore, since Tim Brown gained 161 yards, 121 of those yards are assigned to the “Brown-Evans” pairing and 40 to the “Brown-Hostetler” pairing. Do this for every game since 1960, and you can then assign the percentage of career receiving yards each receiver gained from each quarterback.

For example, 32% of Brown’s yards came from Rich Gannon, 26% from Hostetler, 12% from Jeff George, and 9% from Jay Schroeder. That breakdown isn’t too unique: in fact, of the six receivers with the most receiving yards since 1960, all six (including Brown) gained between 29% and 37% of their career receiving yards from their top quarterback.

The table below lists the top 7 quarterbacks for each receiver, although I only included quarterbacks who were responsible for at least five percentage of the receiver’s yards. It includes the 200 players with the most receiving yards since 1960. [continue reading…]

References

References
1 Sorry, Don Hutson.
{ 16 comments }

Fantasy: Running Back Workload (FBG)

Over at Footballguys.com, I try to unravel the relationship between workload and age. Eight years ago, Doug wrote three articles on the topic; sadly, I’m not sure we’ve come very far since then. So I decided to at least begin the process of measuring how much of an impact “mileage” really has on running backs.

Conventional wisdom suggests that, all else being equal, running backs with “low mileage” are more likely to age gracefully than running backs who have accumulated a significant number of carries.

This, unfortunately, is a very complicated issue to test. For example, new Giants running back Rashad Jennings is 29 years old, but he has just 387 career carries.  This makes Jennings a “young” 29, but is that better than being an “old” 28? The best way to test this question is to analyze running backs of similar quality as Jennings — but who had a lot of carries by the time they were 28 years old — and see how the rest of their careers unfolded.  The problem is that the list of running backs with a lot of carries through their age 28 season bear no resemblance to Jennings. The players with the most carries through age 28 are Emmitt Smith, Edgerrin James, Jerome Bettis, Barry Sanders, LaDainian Tomlinson, Curtis Martin, and Walter Payton, which basically serves as a who’s who of running backs who are not comparable to Rashad Jennings.

Generally speaking, the best running backs get the most carries: did you know that Jim Brown is the only player to lead the NFL in carries more than 4 times? He did it six times in his nine-year career. Along the same line of thinking, the running backs with the most carries are generally among the best running backs.  Running backs who haven’t had a lot of carries through age 28 generally either aren’t very good or have suffered multiple injuries, which makes it tough to find players who feel like true comparables to a player like Jennings.

One could argue that running back workload and running back quality are so inextricably tied that it’s impossible to accurately measure whether age or workload is more important.  But today, I want to take a step back from examining the specifics of a player like Jennings and look at the big picture.  There are some examples that appear to support the “running back mileage” theory.  Shaun Alexander had a significant number of carries through age 28, and was excellent at age 28; the fact that he then declined so significantly, so quickly, could be a sign that workload really mattered. After all, few players suffer such sharp declines when turning 29. But that’s just one data point.  What if we can bring in many more?

You can read the full article here.

{ 4 comments }

Over at Footballguys.com, I looked at which running backs have produced the most extreme fantasy splits in wins and losses.

With few exceptions, running backs generally score more fantasy points in wins than in losses.  For example, Adrian Peterson has averaged 22.2 FP/G over the last four years in wins, and 14.8 FP/G in losses, in a 0.5 PPR scoring system.  Those numbers rank Peterson in the top four in both categories, but obviously he’s been much more valuable in wins.

Some players, however, have particularly extreme splits. As Jason Lisk points out, Alfred Morris is one of those players.  Since Morris isn’t much of a receiver, he gets his value from carries and touchdowns, and both of those tend to be higher in wins. Over the past two seasons, Morris has averaged 17.1 FP/G in wins and 11.1 FP/G in losses. Marshawn Lynch is another player who is more valuable in wins: fortunately for him, those are more prevalent in Washington state than Washington, D.C. Since 2010, Lynch has averaged 17.3 FP/G in wins and 9.7 FP/G in losses.

So which running backs are most impacted by their team’s fortunes? I looked at the top 50 running backs in Footballguys.com rankings, and then excluded rookies and others players with small sample sizes.  I was left with 37 running backs, and I calculated their FP/G (using 0.5 PPR) in wins and losses since 2010.  Here’s how to read the table below. No running back fared so much better in wins relative to losses as Doug Martin.  The Tampa Bay back has played in seven wins and averaged 24.5 FP/G in those games, the highest average among the 37 running backs in this study.  Martin has played in 15 losses, and averaged just 12.1 FP/G in those games, the 10th best ranking. That’s a difference of 12.4 (24.5 – 12.1) FP/G.

You can read the full article here.

{ 0 comments }

2014 MVP Odds and Historical QB MVP Performance

On July 8th, Bovada released some early MVP odds, so I figured it would be fun to take a few minutes and examine which players seem like the best and worst bets. Bovada listed odds for 40 players. For example, Peyton Manning has odds of “3/1” which implies that he has a 25% chance of winning the MVP (if you bet $10 on Manning, you get your $10 back plus $30 from the casino). The odds for all 40 players sum to about 140%, which means there’s a healthy house cushion built into these odds. And it’s even worse than that, as Bovada did not include a “Field” category, so the 140% doesn’t even include all possibilities. In any event, I divided each player’s implied odds by 140% to get “adjusted” percentages (or vigorish-adjusted odds) of winning the MVP. Take a look: [continue reading…]

{ 20 comments }

Not-Entirely-Awful NFL Futures Bets

In the 1990s, there was a hedge fund called Long Term Capital Management that almost brought down the world economy. LTCM made enormous bets on very arcane things such as the spread between two kinds of bonds. Their whole reason-for-being was that they would find small inefficiencies in prices and borrow like crazy to take advantage of those brief opportunities. Other hedge funds did similar things, but these guys thought that they were smarter than everyone else. And, to some extent, they may have even been right. But they were also a little contradictory. What made this hedge fund interesting was not just that it employed two Noble Prize-winning economists, but two who made their name arguing that markets for financial assets were efficient. If their research was right, the inefficiencies on which they were betting should not have existed in the first place.

Now, these guys are way smarter than me, but you may have noticed that I recently wrote about how the NFL betting market appears to be pretty efficient. If that’s right, there shouldn’t be any chances to make profitable NFL bets. If the prices are right, all I’m doing is paying the commission every time I make a bet. Like the guys at LTCM, however, I think I’m smart enough to find bets that are mispriced and that offer some opportunity to make money. I’m probably overconfident and wrong about that, but it’s too much fun to try. And if I fail, which the LTCM guys spectacularly did when some of their billion dollar bets went wrong, at least the implications will not send shock waves to central bankers in Peru.

Bets I Sort of Liked But Decided Not to Pull the Trigger On

There were a series of bets on season win totals that I liked but decided did not quite make sense in the end. Some of the reasons were hard-headedly analytical and others were more visceral. Most notably, I couldn’t commit actual dollars to betting on Ryan Fitzpatrick, even though I came pretty close. [continue reading…]

{ 11 comments }

A few days ago, I was in Vegas with friends and without a car. So I took the chance to shop NFL futures odds to the extent that I felt it was worth it to walk to a given sportsbook. I decided the 3+ mile walk to the Superbook was not worth the opportunity cost in the 105 degree heat, so I didn’t get their numbers. But I did get numbers from three of the major oddsmakers: William Hill, Cantor Gaming, and MGM. Tomorrow, I’ll talk about some bets that seem potentially attractive. As I described recently, the numbers are pretty good now and don’t leave obvious opportunities for the most part, I think.

Yes, I still did like some bets. I only found one season win total I really wanted to bet on, and it’s not one of the ones I would have bet back in March. I made a few bets at the William Hill sportsbook, just a little hole in the wall at the Hooters’ Casino a little ways off the Strip, which could just as easily have been in Nevada towns forgotten by time like Laughlin or Mesquite as in Las Vegas. Then I made a few bets not too far from the beautiful people at the Cantor book in the Cosmopolitan. I spent way too much time thinking about all this stuff, which might not have been necessary if I only had that time machine and could have bet on the initial lines. But there’s also some cool stuff by looking at the teams’ odds that have changed the most in both directions.

Season Win Totals

Some interesting movements have happened in the numbers that Cantor Gaming released in March. Those changes reflect everything that happened in free agency and the draft, but also maybe some numbers that people would have bet on anyway even if nothing had changed personnel-wise.  Below are the opening numbers along with the numbers I gathered during the last week. The Cantor numbers are mostly from 6/18 because their books that I went to would only give me the numbers one at a time. I gathered about eight of those numbers because I was at least considering them as wagers. For those teams, the most recent line is the one that I posted. The other companies’ books gave me complete printouts of all their season win-total lines.

A note on the odds: Lines like -140 mean that you would wager $140 to win $100. Lines like +130 mean you wager $100 to win $130. The numbers are usually split by 20 on either side, which represents the vig, or Vegas’s commission. For example, Denver being at -115 for the over would usually go with -105 on the under. For bigger odds, the over and under can be split by more. Also, the MGM has a slightly larger vig, with a 30 split between the over and under. [continue reading…]

{ 2 comments }

There is no doubt that in modern times, passing is king. But until pretty recently, we were at the peak level in NFL history with respect to individual rushing performance. On the team level, rushing production ebbed and flows, with high points in the late ’40s, mid-’50s, and mid-’70s, but on the individual level, the 2006 season may have been the high point.

That year, Pittsburgh’s Willie Parker rushed 337 times for 1,494 yards and scored 13 touchdowns, but Parker ranked just sixth in rushing yards. He also caught 31 passes for 222 yards, but Parker ranked only 7th in yards from scrimmage. That season, the average leading rusher on the 32 teams gained 1,124 rushing yards. Again, that was average. Last year, the average leading rusher gained 912 yards. Consider that in 1991, after Emmitt Smith, Barry Sanders, and Thurman Thomas, the fourth-leading rusher was New York’s Rodney Hampton, and he gained 1,059 yards. In other words, 2006 and its surrounding seasons — even if it might not feel like it — really was a different era of football for running back statistics.

The graph below shows the average rushing yards gained by the leading rushing for each team in every season since 1932. All team seasons of fewer than 16 games were pro-rated to 16 games [1]But this does not pro-rate for injury.; the NFL line is in blue, while the AFL/AAFC line is in red. [continue reading…]

References

References
1 But this does not pro-rate for injury.
{ 22 comments }
Graham was flexed often in 2013

Graham was flexed often in 2013.

On July 3rd, arbitrator Stephen Burbank ruled that Jimmy Graham is a tight end for purposes of the NFL’s franchise tag. You can read a very good analysis of Burbank’s ruling from Jason Lisk here. But after reading Burbank’s full report, I wanted to add my thoughts. And let’s start with a high-level overview.

Football is not baseball: position designations are much more fluid in football, and they also hold less inherent meaning. You can have five wide receivers on the field in football, but you can’t play five third basemen. You can go without a tight end or fullback for long stretches in a game, but you don’t exactly see baseball teams going without a first basemen very often.

In baseball, emphasizing position distinctions make sense because of the rigidity of the designation and the inherent scarcity involved in building a team. A catcher that can hit is more valuable than a first baseman that can hit, because it’s much easier finding a first baseman that’s a productive offensive player. In football, those concepts don’t necessarily apply, which gets us to the Jimmy Graham issue. Four years ago, when writing about Art Monk, I referenced Sean Lahman’s section on Monk in Lahman’s fantastic Pro Football Historical Abstract:

Even though Monk lined up as a wide receiver, his role was really more like that of a tight end. He used his physicality to catch passes. He went inside and over the middle most of the time. He was asked to block a lot. All of those things make him a different creature than the typical speed receiver…. His 940 career catches put him in the middle of a logjam of receivers, but he’d stand out among tight ends. His yards per catch look a lot better in that context as well.

I haven’t heard anyone else suggesting that we consider Monk as a hybrid tight end, but coach Joe Gibbs hinted at it in an interview with Washington sportswriter Gary Fitzgerald:

“What has hurt Art — and I believe should actually boost his credentials — is that we asked him to block a lot,” Gibbs said. “He was the inside portion of pass protection and we put him in instead of a big tight end or running back. He was a very tough, physical, big guy.”

Monk said similar things:

“In [1981] we were pass oriented and that didn’t work so well. So we went to a ground game. About this period of time we shifted a little into more of a balanced offense. I was moved from being just a wide receiver to playing H back. I would come out of the backfield and do a lot of motion. And we had a lot of success with that.”

And here’s more from Coach Gibbs:

‘We used him almost as a tight end a lot,’ said Gibbs, ‘and not only did he do it willingly, he was a great blocker for us.’

Heck, Graham may be more “wide receiver” than Monk was. But identifying Graham a tight end or a wide receiver is  meaningless. Calling Graham a tight end doesn’t mean the Saints not “get” to put another wideout on the field, and calling him a wide receiver doesn’t mean the Saints “have” to put an extra tight end on the field.  His position classification has no impact on what the Saints do on the field.  Which left Burbank to ultimately decide something very meaningful — his compensation — based on something very meaningless. [continue reading…]

{ 19 comments }

A couple of weeks ago, Brian Burke of Advanced Football Analytics (formerly Advanced NFL Stats) wrote a great post on the value of a first down. From that post, we concluded that the marginal value of a first down is 9 yards, and we’ve previously determined that the marginal value of a touchdown is 20 yards. Therefore, we can create an Adjusted Yards per Carry statistic, which can be calculated as follows:

Adjusted Yards per Carry = (Rushing Yards + 20 * Rushing TDs + 9 * Rushing First Downs) / Rushes

If we use this metric to analyze the 2013 season, how would it look? Last year, the Eagles averaged 5.13 yards per carry and 8.29 Adjusted YPC, courtesy of the fact that the team led the NFL in rushing first downs. Philadelphia also ranked 1st in the NFL in both of those metrics and in overall rushing yards. [continue reading…]

{ 20 comments }

Last weekend, we looked at the team with the most Pro Bowlers to win a championship. Today, we look at the reverse: the team with the fewest Pro Bowlers to win it all.

As a technical matter, the Pro Bowl hasn’t always been around, so some pre-1950 teams and the 1960 Oilers (there was no Pro Bowl in the AFL’s first season) had zero Pro Bowlers. But only one team has had exactly one Pro Bowler and won the title. Here are some hints:

Trivia hint 1 Show


Trivia hint 2 Show


Trivia hint 3 Show

[continue reading…]

{ 5 comments }

Yesterday, I looked at the best AV-weighted winning percentages of offensive players. Today, we examine the same numbers but for defensive players and kickers since 1960. Again, players who entered the league prior to 1960 are included, but for purposes of this study, only their 1960+ seasons count (assuming they produced at least 50 points of AV). That’s a pretty important bit of detail to mention when it comes to the top player on the list. The player with the best AV-adjusted winning percentage since 1960 is Packers linebacker Bill Forester, who entered the NFL in 1953 but only gets credit for his 1960-1963 seasons in Green Bay (spoiler: those were pretty good ones). After him, of course, we have yet another Patriots lineman. Today it’s Vince Wilfork: [continue reading…]

{ 3 comments }

A true winner and Tom Brady

A true winner and Tom Brady.

Yesterday, I looked at the weighted career winning percentages for running backs, with the weight being based on each player’s yards from scrimmage in each season of his career. Today, I want to do the same thing but for all offensive players, using PFR’s Approximate Value ratings.

By this methodology, Dan Koppen has the highest AV-weighted career winning percentage of any offensive player since 1960. The table below shows his AV and team’s winning percentage in each season of his career. Because Koppen’s best season came in 2007, when the Patriots went 16-0, Koppen’s career winning percentage gets a big boost from that season (18.7% of his career winning percentage comes from ’07 since 18.7% of his career AV comes from that year). On the other hand, Koppen played in just one total game for the 13-3 Patriots (2011) and the 13-3 Broncos (2013), so he gets almost no credit for those performances. Of course, he doesn’t need it, because his average season, after adjusting the weights based on his AV grades, was a 13-3 season.

YearTmGGSAVRecord% of Car AVWtWin%
2003NWE161570.8758%0.07
2004NWE1616100.87511.5%0.101
2005NWE9950.6255.7%0.036
2006NWE1616100.7511.5%0.086
2007NWE151516118.4%0.184
2008NWE1616100.68811.5%0.079
2009NWE1616100.62511.5%0.072
2010NWE1616110.87512.6%0.111
2011NWE1110.8131.1%0.009
2012DEN151270.8138%0.065
2013DEN000.8130%0
Total0100%0.813

The table below shows the top 500 career AV-adjusted winning percentages among all offensive player since 1960 (minimum: 50 points of AV). As always, players who entered the NFL before 1960 are included but only their seasons beginning in 1960 count. The table below is fully sortable and searchable, so get to searching and leave your thoughts in the comments. [continue reading…]

{ 3 comments }

Steven Jackson and Running Back Records

Jackson, presumably walking off the field after a loss

Jackson, presumably walking off the field after a loss.

One of my very first posts at Football Perspective looked at the weighted career winning percentages of various running backs. You can calculate a player’s weighted career winning percentage in lots of ways, but here’s what I did:

  • Calculate the percentage of yards from scrimmage a running back gained in each season as a percentage of his career yards from scrimmage. For example, if a player gained 10% of his yards from scrimmage in 1999 and the team went 15-1 that season, then 10% of the running back’s weighted winning percentage would be 0.9375. This is designed to align a running back’s best seasons with his team’s records in those years. For example, Emmitt Smith played 2 of his 15 seasons with the Cardinals. But since he gained only 6.5% of his career yards from scrimmage in Arizona, the Cardinals’ records those years count for only 6.5% — and not, say, 13.3% — of his career weighted winning percentage.
  • Add the weighted winning percentages from each season of the player’s career to get a career weighted winning percentage.

At the time, Steven Jackson had the lowest average adjusted winning percentage of any running back in my study. Since then, Jackson played for the 7-8-1 Rams in 2012 and the 4-12 Falcons in 2013. That upped his adjusted winning percentage from 0.292 to 0.307. Among the 129 running backs in NFL history with at least 7,000 yards from scrimmage, only James Wilder had a worse career adjusted winning percentage.

The running back with the highest adjusted winning percentage is Lawrence McCutcheon, who spent the majority of his career with the Rams before end-of-career cups of coffee with Denver, Seattle, and Buffalo. The table below shows the first and last year for each running back, the teams he played for, his career yards from scrimmage, and his adjusted winning percentage. McCutcheon played on those great Rams teams of the ’70s, gaining the bulk of his yards from ’73 to ’77. As a result, his adjusted winning % is an incredible 0.741: [continue reading…]

{ 10 comments }
Previous Posts