by Chase Stuart
on July 17, 2014
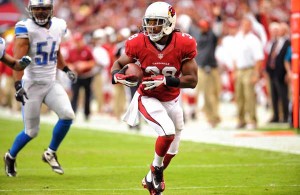
Ellington races for a long touchdown.
In
November, I wrote about the unique running back by committee taking place in Arizona. At the time,
Rashard Mendenhall was averaging 3.1 yards per carry, while backup
Andre Ellington was averaging 7.2 yards per rush on 54 carries. I thought it would be fun to revisit the Ellington/Mendenhall time share now that the season is over, and to use a slightly different methodology.
Mendenhall ended the season with 687 yards on 217 yards, a 3.2 yards per carry average. Ellington finished his rookie year with 118 carries for 652 yards, producing 5.5 yards per rush. One way to measure the magnitude of the difference in the effectiveness of these two players — and boy was there a large difference — is to simply look at the delta in the players’ yards per carry averages. In this case, that’s 2.36 yards per carry.
Where does that rank historically? Some teams — I’m looking at the Lions in the early Barry Sanders years — gave only a handful of carries to their backup running backs. So one thing we can do is to take the difference in the yards per carry between the team’s top two running backs and multiply that number by the number of carries by the running back with the lower number of carries. In each instance, I’ve defined the running back with the most carries as the team’s RB1, and the running back with the second most carries as the RB2. In Arizona’s case, that would mean multiplying -2.36 (Mendenhall’s average, since he was the RB1, minus Ellington’s average) by 118, the number of carries Ellington recorded. That produces a value of -278. [continue reading…]
Tagged as:
Andre Ellington,
Cardinals
{ }
by Chase Stuart
on November 16, 2013
Ellington races for a long touchdown.
Arizona is one of many teams in the NFL employing a running back by committee philosophy, but no team — now, or at any point in modern history — allocated time quite like the Cardinals. Through nine weeks,
Rashard Mendenhall has 105 rushes for 323 yards, giving him a miniscule 3.1 yards per carry average. Mendenhall arrived in the desert this offseason, as part of a reunion with new Cardinals head coach
Bruce Arians. The duo worked together for three years in Pittsburgh, where Mendenhall rushed for 3,309 yards and 29 touchdowns and averaged 4.2 yards per carry. But Mendenhall hasn’t been close to the best back added this offseason, as Clemson’s
Andre Ellington — a sixth round of the 2013 Draft — has 388 yards this year on 54 carries. Thanks to his spectacular 7.2 yards per carry average, he has outgained Mendenhall despite seeing roughly half as many carries.
How crazy is it for one back in a committee to average more than four more yards per carry than the other back? I ran the following query for every team since 1970:
- First, I noted the two running backs who recorded the most carries for each team
- Next, I eliminated all running back pairs where the lead back had over 150 more carries than the backup.
- I also eliminated all pairings where the lead back was a lead back in name only due to injury to the starter (otherwise, years where Maurice Jones-Drew and Darren McFadden ranked second on their team in carries would be inappropriately included). To do that, I deleted sets where the “lead” back — defined as the back with the most carries — averaged fewer carries per game than the second running back.
After running through those criteria, the table below shows all situations where the backup averaged at least one more yard per rush than the lead back. As always, the table is fully searchable and sortable. It is currently sorted by the difference between the YPC average of the backup and the starter, but you can sort by year to bring the recent instances to the top.
[continue reading…]
Tagged as:
Andre Ellington,
Cardinals,
Yards per rush
{ }

