≡ Menu

Let’s start with the obvious: Patrick Mahomes was never bad.  He had 7 games this season where he averaged at least 10.0 AY/A, 11 games where he averaged at least 9.0 AY/A, and 15 games where he averaged at least 7.0 AY/A.  His worst statistical game of the season came against a good Jaguars defense in a game that got out of hand in Kansas City’s favor early.

The Chiefs also became the first team in history to score at least 26 points in every game; the 1998 Minnesota Vikings had been the previous champion in this category, having scored at least 24 points in every game.

Mahomes finished with 50 touchdown passes, 11 more than every other quarterback in the league. He averaged 8.13 Net Yards per Pass Attempt, a half-yard better than every other full-time starter in the league (Ryan Fitzpatrick has a way of mucking up these stats), and threw for over 5,000 passing yards.  Mahomes led the league with a remarkable 8.89 ANY/A average, the 6th best in modern history.

The table below shows the final passing leaders for the 33 quarterbacks who threw enough pass attempts to qualify for the passing crown. That’s all 32 teams plus both quarterbacks for Tampa Bay. The league average ANY/A this season was a remarkable 6.32, which tops 2015 (6.26) for the most efficient passing season in NFL history. Mahomes, with an 8.89 AY/A average over 606 dropbacks, meaning he provided 1,554 Adjusted Net Yards of value over average. That easily led the league: [continue reading…]

{ 0 comments }

Saquon Barkley Has Been Inefficient In 2018

Earlier this week, I wrote about about Saquon Barkley and his remarkable traditional statistics but less than stellar efficiency metrics (in part due to New York’s offensive line woes).

The graph below shows each of Barkley’s carries this season. On the X-Axis, you can see how many yards he gained. On the Y-Axis, you can see how many Expected Points Added was gained on that carry.

As you can see, Barkley has had 6 very long runs, but the majority of his carries have produced negative EPA. This is in part because running plays are less valuable than passing plays, and in part because over half of his rushing attempts have gained 2 or fewer yards.

But this gets to a much more important question than how to evaluate Barkley (and remember, “Barkley” here is shorthand for Barkley in the Giants offense, running behind a bad offensive line): it gets to the heart of how do you evaluate running backs overall.

What do you think?

{ 0 comments }

Rosen has struggled this year

Arizona currently ranks last in each of the five major offensive categories: Points, Yards, First Downs, Net Yards per Attempt, and Yards per Carry. That is a remarkable run of futility due in no small part to the worst offensive line in football. Consider that through 15 games:

  • Arizona has scored 201 points; Buffalo ranks 31st with 227 points.
  • Arizona has gained just 3,667 yards, the fewest yards through 15 games of any team since 2008; Buffalo ranks 31st with 4,397 yards.
  • Arizona has only 227 first downs; Miami is 31st with 235 first downs.
  • Arizona averages 4.8 NY/A; Buffalo ranks 31st at 5.0.
  • Arizona averages 3.8 YPC; the Bucs and Jets round out the bottom 3 at 3.9 YPC.

[continue reading…]

{ 1 comment }

Week 16 Game Scripts: Luck, Rodgers Lead Big Comebacks

Previously:

In week 16, both New York teams fell to superstar quarterbacks. The big comebacks of the week were engineered by Andrew Luck and the Colts against the Giants and Aaron Rodgers of the Packers against the Jets. The Giants led 14-0 after the first quarter, 17-7 at halftime, 24-21 after the third, and 27-21 with one minute to go, before Luck threw the game-winning touchdown pass. The Jets led the Packers 35-20 entering the 4th quarter, before the Packers scored on three straight drives to take a 38-35 lead. The Jets forced overtime, but the Packers scored a touchdown on the opening possession of OT, Green Bay’s third straight clutch drive that ended with a TD. The full Game Scripts below: [continue reading…]

{ 0 comments }

Saquon Barkley Did Not Fix The 2018 Giants

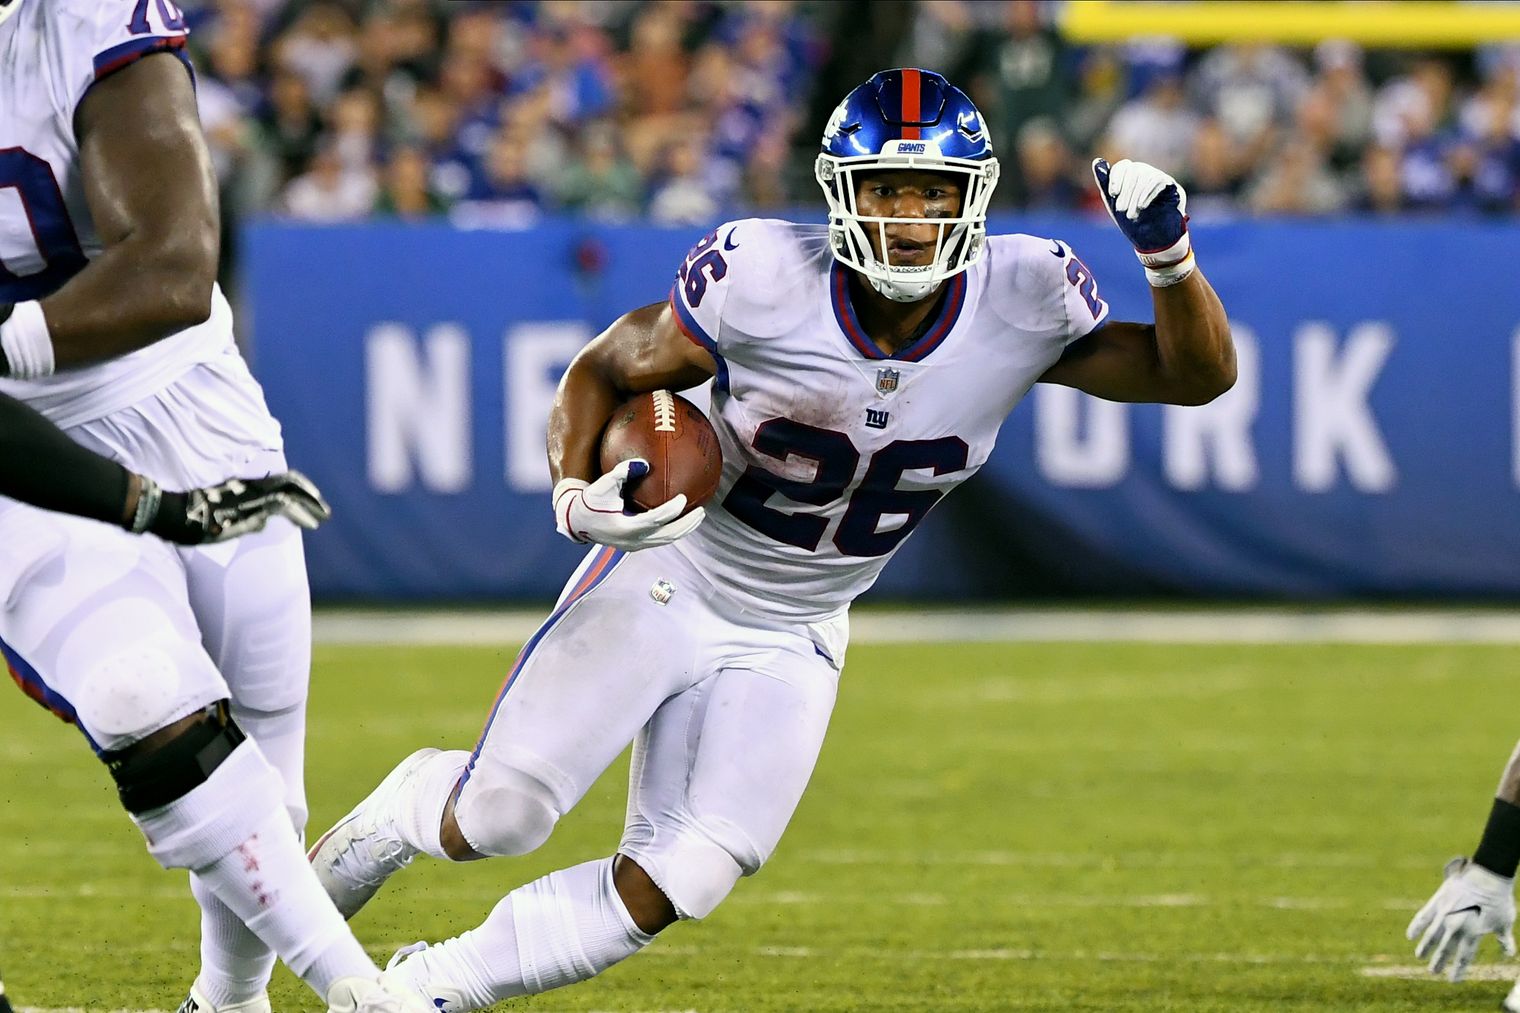
Barkley ranks 3rd in yards from scrimmage in 2018.

In 2013 and 2014, no running backs were selected in the first round. In 2015, Todd Gurley and Melvin Gordon were selected at 10 and 15, but the return of the highly drafted running back came one year later.

In 2016, Ezekiel Elliott was the 4th overall pick. He helped the Cowboys to a 9-win improvement.

In 2017, Leonard Fournette was the 4th overall pick. He helped the Jaguars to a 7-win improvement.

On their own, of course, neither player was worth that many wins. But that was part of the argument used when the New York Giants took a running back — Saquon Barkley in this instance — with the second overall pick, ahead of say, Sam Darnold. The thought process was that the Giants might have one last run in them under Eli Manning, and Barkley could have an Elliot- or Fournette-like impact for Big Blue. And there was evidence that drafting a top-5 running back typically leads to a big improvement in wins for a team; in addition to Elliott and Fournette, Reggie Bush and the three running backs selected in the top 5 of the ’05 Draft all added at least 5 wins to their teams.

On one hand, Barkley clearly didn’t lead to that sort of impact. In 2017, the Giants went 3-13; this year, New York is 5-10, pending a meaningless week 17 game against the Cowboys. On the other, Barkley has probably exceeded even the most optimistic of expectations, producing 1,884 yards from scrimmage through 15 games. Whatever you thought about Barkley the prospect, Barkley the NFL player certainly hasn’t disappointed.

But that only serves to underscore how a star running back isn’t worth a top-5 pick, especially in a draft with potential franchise quarterbacks available. Barkley has averaged 4.9 yards per carry (10th-best), rushed for 1,198 yards (3rd-best) and rushed for 10 touchdowns (5th-best): he has been a big improvement on the ground for an offense that relied on Orleans Darkwa and Wayne Gallman last year. And as a receiver, Barkley has lived up to the billing: he has 87 receptions on a 77.0% catch rate and has averaged 7.9 yards per catch. He hasn’t lost a fumble all season!

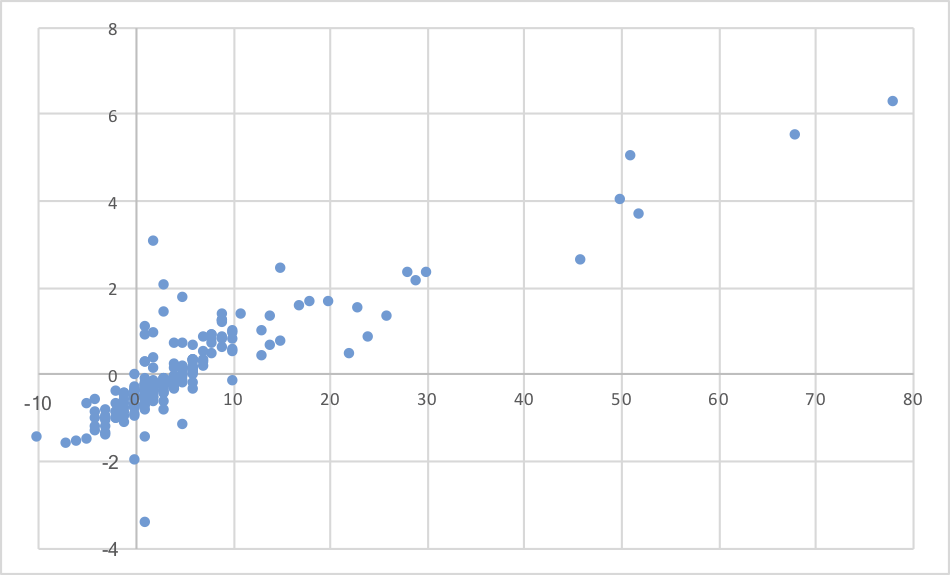
But the Giants, perhaps in part due to bad luck, have remained a bad team. New York is 2-4 in games decided by 3 or fewer points, and 4-7 in games decided by a touchdown or less, so maybe the Giants should have won 6 or 7 games already.  Barkley has made the Giants a better team — or, at least, a better offense — but there remains a limit to how much value a running back can provide in the 2018 NFL.

The biggest red herring, I think, comes in the terms of receiving yards.  Barkley has 688 receiving yards, which sounds great until you realize that Barkley has 21% of Giants targets and 24% of Giants receptions, but only 17% of Giants receiving yards and 15% of Giants first downs.  This isn’t a knock on Barkley as much as it is a knock on the position: for the most part, running backs don’t make a big contribution in the passing game, even when they have a lot of receptions.

Consider that Barkley had 113 targets.  Of those:

  • 26 were incomplete passes;
  • 16 were third down receptions that did not pick up a first down;
  • 8 were first or second down receptions that gained negative or zero yards

That’s 50 of 113 targets that did not provide value, compared to 28 of 113 targets that gained a first down.  Again, this isn’t much of a knock on Barkley the player: for a running back, it’s extremely difficult to provide significant value in the passing game. [1]By way of comparison, let’s look at Le’Veon Bell in 2016, who is known for being a big boon in the passing game. He had 118 targets last year. 24 were incomplete passes, 7 were third … Continue reading  And in the modern NFL, there’s a very real cap as to the value a running back can provide in the running game, while passers are picking up first downs with relative ease.  By comparison, Barkley has gained a first down on just 18% of all rushing plays.

Barkley looks like he may be the next great running back, but it’s not looking like he was a great choice with the #2 pick.

References

References
1 By way of comparison, let’s look at Le’Veon Bell in 2016, who is known for being a big boon in the passing game. He had 118 targets last year. 24 were incomplete passes, 7 were third down receptions that did not pick up a first down, and 9 were first/second down receptions that gained negative or zero yards. Meanwhile 35 went for first downs. That’s obviously better than Barkley, but still results in more clearly bad pass plays than clearly good ones.
{ 2 comments }

Kansas City will likely defeat the Raiders on Sunday, capping an impressive 12-4 regular season. Those four losses, however, all came against playoff teams: in New England, in Seattle, in Los Angeles against the Rams, and at home against the Chargers. Meanwhile, Kansas City will have beaten just two playoff teams: the Chargers, and whoever winds up winning the AFC North (the Chiefs went 4-0 against the AFC North, beating Pittsburgh in week 2 and Baltimore in week 14).

Does this mean the Chiefs are less likely to succeed in the playoffs than if, say, they had gone 6-0 against playoff teams and 6-4 against non-playoff teams?

In 2005, the Steelers went 2-4 against playoff teams during the regular season, but went 4-0 in the postseason (with three wins on the road) to win Super Bowl XL.

Meanwhile, the 2011 Ravens did exactly what my hypothetical 2018 Chiefs did: that year, Baltimore went 6-0 against playoff teams and just 6-4 against non-playoff teams. The Ravens defeated the Texans in the Wild Card round before falling to the Patriots in the Division round.

A number of Super Bowl champions performed poorly against playoff teams during the regular season: the 1999 Rams went 0-2, the 2007 Giants went 1-5, the 1980 Raiders went 1-4, the 2011 Giants went 1-3, and the 2005 Steelers and 2012 Ravens both went 2-4. The 2008 Steelers are a Super Bowl champion that had a losing record (3-4) against playoff teams, but went undefeated (9-0) against non-playoff teams.

Where do the Chiefs line up historically? Kansas City is 10 wins above .500 against playoff teams, and 2 wins below .500 against non-playoff teams. Add those numbers together, and the Chiefs get a score of +12. There are 60 teams in the Super Bowl era who finished +12 or higher. The most extreme case belongs to the 2011 Bengals, who went 9-0 against non-playoff teams (+9) and 0-7 against playoffs teams (-7), for a total score of 16 (9 minus -7). The full list, below:

TeamyearReg Sea W%Record vs. PTRecord vs. NonPTPlayoff RecordDiff
CIN20110.5630-79-00-116
JAX19990.8750-214-01-116
ATL20050.5000-78-1Miss14
KAN20130.6881-510-00-114
PHI20090.6880-411-10-114
SDG19920.6880-411-11-114
SDG20040.7501-411-00-114
SFO19960.7501-411-01-114
STL19990.8130-213-13-014
MIA19721.0000-014-03-014
DAL19690.8210-211-0-10-113
SDG19680.6431-58-0Miss12
OAK19700.6430-48-0-21-112
HOU20040.4380-77-2Miss12
NOR19940.4380-77-2Miss12
KAN19790.4380-77-2Miss12
CIN19760.7141-49-0Miss12
HOU19750.7141-49-0Miss12
MIA19910.5001-77-1Miss12
ATL19920.3750-86-2Miss12
CHI20120.6252-68-0Miss12
BAL20170.5630-59-2Miss12
DET20160.5630-59-20-112
BAL20090.5631-68-11-112
PIT19760.7140-310-11-112
MIA19750.7140-310-1Miss12
BAL20080.6882-59-02-112
MIA20010.6882-59-00-112
NWE19850.6882-59-03-112
RAI19840.6882-59-00-112
NYG20070.6251-59-14-012
IND20010.3751-95-1Miss12
NOR19980.3751-95-1Miss12
DET20110.6251-59-10-112
WAS19990.6251-59-11-112
NYG19880.6250-410-2Miss12
OAK19800.6881-410-14-012
DET20140.6881-410-10-112
MIN19920.6881-410-10-112
DEN19850.6881-410-1Miss12
KAN20180.7502-410-0??12
SFO20130.7502-410-02-112
PIT20100.7502-410-02-112
SFO19980.7502-410-01-112
NOR19920.7502-410-00-112
MIA19900.7502-410-01-112
NYG19890.7502-410-00-112
NYG19930.6880-311-21-112
CHI19900.6880-311-21-112
KAN19680.8571-211-00-112
OAK20160.7501-311-10-112
TEN20030.7501-311-11-112
WAS19860.7501-311-12-112
DEN20120.8132-311-00-112
NWE20110.8131-212-12-112
OAK19760.9291-112-03-012
SDG20060.8752-212-00-112
BAL19680.9291-112-02-112
CHI19860.8751-113-10-112

For Chiefs fans, the 2005 Steelers may be the most inspiring name on this list, but not the most memorable. The easy comparison is to Andy Reid’s first team in Kansas City in 2013: that Chiefs team went 10-0 against non-playoff teams but 1-5 against playoff teams and then lost its first playoff game. The big difference: that Kansas City team had to go on the road, while this Chiefs team should be home for the postseason.

{ 0 comments }

Week 16 Passing Stats: Late Season Nick Foles Is Back

Late season Nick Foles is back! The Eagles backup quarterback — and 2018 postseason hero — was your top passer in week 16. Foles set a franchise record with 471 passing yards, and averaged 9.94 ANY/A on 50 dropbacks.

The second-best quarterback of the week also wears green: it was Jets rookie Sam Darnold, who has been very good since returning from a foot injury. He threw for over 300 yards and 3 TDs in a losing effort against the Packers.

On the other side, Panthers fans don’t have to worry about a quarterback controversy. Backup Taylor Heinicke led the Panthers on a 14-play, 73 yard opening drive for a touchdown, but the team’s final 10 drives ended with 3 punts, 3 interceptions, 2 turnovers on down, 1 fumble, and 1 field goal. He finished with a 2.58 ANY/A on 55 dropbacks. More notably, Philip Rivers had one of the worst games of his career, gaining just 1.39 ANY/A on 41 dropbacks against the Ravens. [continue reading…]

{ 0 comments }

Should Aaron Jones Be Crown The 2018 YPC King?

Green Bay Packers running back Aaron Jones is on injured reserve with a sprained MCL in his right knee, so his 2018 season will end with the following stat line: 12 games played, 133 carries, 728 rushing yards, 5.47 yards per carry. And if the season ended today, Jones would be crowned the 2018 Yards per Carry king. But is that right? What makes Jones the winner? Let’s go into the fine print.

Johnny Townsend would be the YPC king if there was no minimum threshold involved: he has 1 carry for 42 yards this season.

Among players with more rushing yards than Townsend, Jarvis Landry (3-60-20.0) would be next in line.

Among players with more rushing yards than Landry, D.J. Moore (13-172-13.2) would be your YPC king.

Among players with more rushing yards than Moore, Raheem Mostert (34-261-7.7) is next up.

Among players with more rushing yards than Mostert, Josh Allen (80-536-6.7) would be the YPC king.

Now, should 500 rushing yards (or 80 carries) be enough to enable a player to qualify for the YPC title? It’s below the current threshold, which is set at an arbitrary 6.25 carries per game, or 100 carries in a 16-game season. So unless Allen has 20 carries next week, he’s not going to finish with enough carries to qualify for the crown. [continue reading…]

{ 0 comments }

Brady and the Patriots have flexed their muscles in the AFC East for a generation

Another year, another Patriots AFC East title. With a Dolphins loss to the Jaguars today, the Patriots officially clinched the 2018 AFC East title (minutes later, the Patriots defeated the Bills, which also would have clinched the title). The Patriots have now won 10 straight AFC East titles — each year from 2009 to 2018 — and have won the AFC East in 16 of the last 18 seasons.

The only two years the Patriots didn’t win the division? That came in 2008, when Matt Cassel was New England’s starting quarterback for 15 games, and back in 2002. Yes, that’s right: when Tom Brady is the Patriots starting quarterback, the Patriots have won FIFTEEN STRAIGHT division titles. And it was nearly 17 straight: the Patriots lost to the Jets in week 16, 2002, which knocked the Patriots behind New York. New England finished 9-7, and lost a tiebreaker to the Jets after New York upset Green Bay in week 17 to win the AFC East.

No quarterback/team can come close to matching that streak. Otto Graham and the Browns are the only other team to win 10 straight division titles; after that, Fran Tarkenton and the Vikings are next with 6 straight (1973-1978). And the 16 division crowns for the Brady Patriots is a mark that will never be broken. Graham and the Browns won 10 division titles, but after them, Peyton Manning and the Colts and Joe Montana and the 49ers are third with 8 division titles. Think about that for a minute: the Brady Patriots have won as many division titles as the Manning Colts and Montana 49ers combined.

Oh, and the Patriots actually set a new record today, too. Even in 2002 and 2008, the Patriots still went 4-2 in the division. And every year that New England has won the AFC East under Brady, the Patriots had a winning record in the division. By beating Buffalo today, New England is now 4-1 in the AFC East, making 2018 the 18th straight year that the Patriots have posted a winning record in division games. That breaks a tie New England had with the Cleveland Browns, who posted a winning record in 17 straight years from 1957 to 1973. The Los Angeles Rams are third on the list, having gone 14 straight years with a winning record in division games from 1967 to 1980.

{ 1 comment }

Five and a half years ago, I wrote about Julio Jones was in the process of stealing the torch from Roddy White.  In 2012, both Falcons teammates finished in the top 12 in fantasy points scored by wide receivers. At 31, White had 92 catches for 1,351 yards and 7 touchdowns, while a 23-year-old Jones in 2012 had 79 catches for 1,198 yards and 10 TDs.   From 2008 to 2012, White ranked 2nd in receiving yards, tied for 2nd in receiving touchdowns, 3rd in receptions, and 3rd in receiving yards per game.  But the young Jones was about to take the torch from him as the Falcons top target.

From 2014 to 2018, Antonio Brown ranks 2nd in receiving yards (behind Jones), 1st in receiving touchdowns, 1st in receptions, and 2nd in receiving yards per game.  Now 30 years old, Brown is still in the prime of his career, but like White, he has a teammate 8 years his younger who may be threatening his future.  In this case, it’s 22-year-old JuJu Smith-Schuster who has had a breakout season in 2018.  Both players rank in the top 12 in fantasy points by wide receivers this year, but it’s Smith-Schuster who actually leads the Steelers in both receptions and receiving yards!

Assuming Smith-Schuster winds up leading the Steelers in receiving yards, Brown will almost certainly finish with one of the best WR2 seasons in history. It also would be one of the more interesting “pass the torch” scenarios in league history (if, of course, Smith-Schuster winds up being the best Steelers receiver over the next few years). [continue reading…]

{ 0 comments }

The Ravens have turned back the clock under Lamar Jackson. Baltimore has rushed it 40+ times for 194+ rushing yards in every game under Jackson.

 
Rushing
Rk Tm Year Date Time LTime Opp Week G# Day Result OT Att Yds Y/A TD
1 BAL 2018 2018-12-16 1:00 1:00 TAM 15 14 Sun W 20-12 49 242 4.94 1
2 BAL 2018 2018-12-09 1:00 12:00 @ KAN 14 13 Sun L 24-27 OT 40 194 4.85 1
3 BAL 2018 2018-12-02 1:00 1:00 @ ATL 13 12 Sun W 26-16 49 207 4.22 1
4 BAL 2018 2018-11-25 1:00 1:00 OAK 12 11 Sun W 34-17 43 242 5.63 1
5 BAL 2018 2018-11-18 1:00 1:00 CIN 11 10 Sun W 24-21 53 267 5.04 2

In the last 30 years, only the Ravens and the 2016 Cowboys have rushed for 175 yards in five consecutive games. And Baltimore is the first team since the 1976 Steelers to rush for 190 yards in five straight games. The Ravens are seriously run-heavy.

The graph below shows the total yards for each team in the NFL over their last 5 games.  The black box shows the team’s rushing yards, and the white box shows the team’s passing yards: [continue reading…]

{ 0 comments }

Week 15 Game Scripts: Ravens Run To Victory

I am short on time today, so no commentary: below are the week 15 Game Scripts.

TeamH/ROppBoxscorePFPAMarginGame ScriptPassRunP/R RatioOp_POp_ROpp_P/R Ratio
ATLARIBoxscore40142615.2382758.5%432266.2%
MINMIABoxscore41172412.3234036.5%332062.3%
INDDALBoxscore2302311.6273940.9%422265.6%
CINOAKBoxscore3016148.4364146.8%421672.4%
TEN@NYGBoxscore170177.7224532.8%471575.8%
CHIGNBBoxscore241774.8292950%471971.2%
PHI@LARBoxscore302374.6313050.8%551875.3%
PITNWEBoxscore171074.4362559%371966.1%
HOU@NYJBoxscore292273.6341766.7%413156.9%
SFOSEABoxscore262332.4322655.2%343549.3%
BALTAMBoxscore201282.2254933.8%262155.3%
CLE@DENBoxscore171611.1332854.1%502071.4%
NOR@CARBoxscore1293-0.1373253.6%342359.6%
WAS@JAXBoxscore16133-1.7283345.9%232646.9%
BUFDETBoxscore14131-2.4273742.2%292652.7%
LAC@KANBoxscore29281-8.4432464.2%361767.9%

Under Lamar Jackson, the Ravens have become the most run-heavy team in the NFL.  Against the Bucs, Gus Edwards had 19 carries, Jackson had 18 carries, and Kenneth Dixon had 10 carries. This in a game that was tight throughout: Baltimore finished with a Game Script of just +2.2, yet ran on 2 out of every 3 plays.

{ 0 comments }

The Chicago Bears have the best pass defense in the NFL this year. The Bears held (i) Aaron Rodgers and the Packers to 4.04 ANY/A in week 15, the worst performance by Green Bay this year, (ii) Jared Goff and the Rams to an ANY/A average of -0.38, the worst performance by Los Angeles all season, and (iii) the high-powered Tampa Bay offense to 3.24 ANY/A, the worst game by the Bucs all year. Chicago also held Kirk Cousins and the Vikings to their 2nd-worst game of the year.

On the other hand, Brock Osweiler — yes, that’s right — had the best performance by any quarterback this year against the Bears, averaging 7.95 ANY/A. I went ahead and calculated how each team fared in ANY/A in each game this year, and then ranked each team’s performance in each game.  Then, I looked to see how each defense did relative to those numbers: did they hold the opponent to their worst game of the year, second worst, third worst, and so on.

Here’s how to read the table below: on average, Bears opponents had their 5th worst game of the season against Chicago. That gives the Bears the top pass defense in the league. The individual ranks and games are listed: Green Bay, the Rams, and Tampa Bay had their worst games against Chicago, Minnesota their second worst, Buffalo, Detroit, and Seattle their third worst, and so on.

This is a fun table to examine: for example, the Jaguars are having a down year, but you can easily see that they had outstanding performances against three of the top QBs in the AFC.  The Colts, Steelers, and Chiefs all had their worst passing games of the year against Jacksonville. [continue reading…]

{ 0 comments }

Week 15 Passing Stats: Rosen Hits The Floor

The Atlanta Falcons have a terrible pass defense, but no matter: Josh Rosen was still the worst passer in the league in week 15. He finished with just 90 net passing yards on 28 dropbacks, and two interceptions dropped his ANY/A to an even 0.00.  It has been a miserable year for Rosen and the Cardinals passing attack as a whole.  What’s truly remarkable is that the Cardinals are now nearly below the Bills this year in ANY/A for the season.

Buffalo, as you may recall, was one of the worst passing teams in the history of the NFL through 6 weeks.  And it didn’t get much better in weeks 7 through 9.  But since then, the Bills have improved significantly under Josh Allen, while the Cardinals have fallen.  Through 15 weeks, Buffalo is averaging 3.48 ANY/A, while the Cardinals are at 3.60 ANY/A (Buffalo is actually ahead in NY/A).  It will be a tight race to the bottom! The graph below shows the game-by-game ANY/A for both Buffalo (in blue and red) and Arizona (in red and yellow). As you can see, the Bills have been the much better passing team over the last five games. [continue reading…]

{ 0 comments }

Mullens led the 49ers to an upset over their rivals on Sunday.

Nick Mullens was an undrafted free agent who was signed by the 49ers last year, but he never made it to the club’s official roster for the 2017 season. He was cut before the start of the 2017 season, and then cut again before the start of the 2018 season. Then, after Jimmy Garoppolo tore his ACL, the 49ers brought Mullens up to the active roster. He sat behind C.J. Beathard until a wrist injury knocked him out of the lineup, vaulting Mullens into an unlikely starting role.  Since then, he’s been a remarkable find: you would expect an undrafted free agent to operate at replacement level, but Mullens has actually been an above-average starting quarterback.

And he’s been the best rookie quarterback this season, in a year where five first round quarterbacks are playing. Your first question might be: is Mullens actually a rookie? The answer is clearly yes: he is on a contract that pays $480,000 per year, which is the rookie minimum; if he was treated as a second-year player, the CBA would mandate that he receive no less than $555,000 this season. Instead he is on a contract that mirrors what 2018 UDFA rookies are seeing.  He’s also the same age as Baker Mayfield; both graduated from high school in 2013 and played four years in college; the difference is Mullens graduated in ’17 and was on a practice squad last year, while Mayfield transferred in 2014 and sat out that season. But since Mullens wasn’t on an active roster last year, this is obviously his first season in the NFL, which I think makes him a rookie for just about every purpose. [1]Compare him with Jeff Driskel, who arguably is a rookie, too, since he never actually made it on to the field his first two years in Cincinnati. But he was actually on the roster during the regular … Continue reading [continue reading…]

References

References
1 Compare him with Jeff Driskel, who arguably is a rookie, too, since he never actually made it on to the field his first two years in Cincinnati. But he was actually on the roster during the regular season and is being paid like a 3rd-year player. I could see both arguments as to whether Driskel is actually a rookie this season.
{ 1 comment }

DeSean Jackson has been putting together long runs for a long time.

In 2010, a third-year DeSean Jackson, playing with the Eagles and Michael Vick, led the NFL in yards per reception at 22.5.

In 2014, in Jackson’s first year with the Redskins, and playing with a rotating trio of quarterbacks in Robert Griffin, Kirk Cousins, and Colt McCoy, Jackson again led the league in yards per reception at 20.9.

In 2016, in Jackson’s final year in Washington, he teamed with Cousins to lead the NFL in yards per reception (17.9) for a third time.

Now, in 2018, alternating between Jameis Winston (15.2 YPC with 198 yards on 13 receptions) and Ryan Fitzpatrick (20.4 YPC with 552 yards on 72 catches), Jackson is once again leading the NFL in yards per reception (18.8).

How remarkable would it be for Jackson to lead the league in yards per reception for a fourth time in his career?  He nearly picked up a fourth crown in his second season, when he was a runner-up to Mike Wallace in 2009.  No player has ever led the NFL in yards per catch four times in their career, and Stanley Morgan (1979, 1980, 1981) and Jimmy Orr (1958, 1964, 1968) are the only players to even do it three times.

So Jackson is already in the discussion for best yards per reception player in league history, but what’s really impressive is his ability to maintain this skill in different environments.  Morgan was on the Patriots all three years, in Ron Erhardt’s vertical offense, with Steve Grogan throwing over two-thirds of passes during those years, and Matt Cavanaugh starting 12 games.   Orr teamed up with three different quarterbacks and two different teams (Bobby Layne in Pittsburgh in 1958, and Johnny Unitas in 1964 and Earl Morrall in 1968 with the Colts).

But Jackson will be with three teams, three coaches, and four different quarterback situations (not to mention, his performance in 2009 came with Donovan McNabb).  Jackson is a remarkable deep threat not dependent on any quarterback, system, or coach. And now, he’s showing that age may not be a key variable, either.

The oldest player to lead a league in yards per reception was Henry Ellard, who averaged 19.5 yards/catch with the Redskins in 1996. No 34-year-old has done it, but Jimmy Orr (25.6 in the 1968 NFL) and Don Maynard (22.8 in the 1968 AFL) did it at age 33. A 32-year-old Joey Galloway led the league in yards per catch in Dallas in 2003 (19.8), and Elbert Dubenion (31 in 1964), DeSean Jackson (30 in 2016), and Malcom Floyd (30 in 2011) are the only other 30+ year old players to win the YPC crown.

Jackson’s performance has fallen with Winston in 2018, and his performance with Winston in 2017 led to the lowest YPC average of his career. We’ll see what happens over the final two games — Jackson is going to miss today’s game due to injury — but Jackson may be on the verge of a record-breaking season.

{ 0 comments }

October 29th, 2017. The Jets hosted the Atlanta Falcons, and after the Falcons won the coin toss and deferred, the Jets received the opening kickoff. Starting at the team’s 25-year line, the Jets marched 75 yards down the field in 8 plays, scoring a touchdown on a 20-yard pass from Josh McCown to Eric Tomlinson.

That wasn’t particularly noteworthy at the time — in fact, it was the third straight game the 3-4 Jets had scored a touchdown on New York’s first drive. But since then, the Jets have consistently disappointed on opening drives. In fact, over the Jets last 21 game, their opening drives have ended in 15 punts, 3 field goals, 2 fumbles, and 1 interception: [continue reading…]

{ 0 comments }

The Chiefs are the current 1 seed in the AFC, but the Los Angeles Chargers are hot on their heels: both teams have an 11-3 record, while every other team in the AFC has at least four losses. Kansas City has outscored opponents by 119 points, the best in the AFC; the Chargers have the second best points differential in the conference, however, at +97.

How rare is it for one division to have the top two teams in a conference by points differential? It hasn’t happened in the NFL since 2012 and 2013, when the Seahawks and 49ers were the class of the NFC. In 2012, Seattle had a conference-best +167 points differential and an 11-5 record, while the 49ers went 11-4-1 with a +124 points differential and made the Super Bowl. The next year, the Seahawks went 13-3 with a +186 points differential; Seattle earned the 1 seed and won the Super Bowl, while San Francisco went 12-4 with a +134 points differential and blew a fourth quarter lead in the NFC Championship Game.

In 2007, the Giants won the Super Bowl but were not a great team; in ’08, New York was much better, beginning the season 11-1 before the Plaxico Burress incident. The Giants finished 12-4 with a NFC-best +133 points differential. But the Eagles went 9-6-1 with a +127 points differential and snuck into the playoffs, before knocking off the Giants in the second round.

Those are the only three times since realignment in 2002 that the two best teams — by points differential — in one conference resided in the same division. The last time it happened in the AFC was in 1997 and also involved the Chiefs. That year, the Broncos had a +185 points differential, the best mark in the league. But the Chiefs had the second-best points differential at +143, and stole the AFC West from a fading Denver team. The Broncos started 11-2, but lost road games as underdogs to the Steelers and 49ers, and finished 12-4. Kansas City ended the season on a 6-game winning streak, and finished 13-3; no other AFC team had more than 11 wins.

In this case, the Chiefs are more like the ’97 Broncos, with the ’18 Chargers playing the role of ’97 Chiefs. In the playoffs, Denver blew out the Jaguars in the first round in a rematch of the ’96 disaster, and then went to Arrowhead for the second round. In that game, the Broncos edged out the Chiefs 14-10, en route to the franchise’s first Super Bowl victory.

The table below shows all instances since 1970 where two teams in the same division finished with a points differential in excess of 100 points. I would expect the 2018 AFC West will join this list: [continue reading…]

{ 0 comments }

Week 14 Game Scripts: Giants Roll The Redskins

The New York Giants have not been very good this season: heading into week 14, the Giants were 4-8 and ranked 24th in points differential. But on Sunday, the Giants bludgeoned a Redskins team down to third-string quarterback Mark Sanchez, seven years after the Giants bewildered Sanchez in a season-saving victory that launched the team’s Super Bowl success.

The Giants had the best Game Script in week 14, while the Jets had the biggest Game Scripts comeback. The Jets trailed the Bills 17-6 in the 2nd quarter and 20-13 entering the 4th quarter, but came back to beat Buffalo 23-20. The full week 14 Game Scripts are below: [continue reading…]

{ 0 comments }

Parity Does Not Exist In The 2018 NFL

With three weeks left, the NFL playoff picture is nearly complete.  In the AFC, the Chiefs, Patriots, and Chargers are all going to make the postseason; in 2017, Kansas City and New England won their divisions, and the Chargers won 9 games.

The Steelers and Ravens are favorites to go to the postseason; Pittsburgh won the AFC North last year, and Baltimore won 9 games.  The AFC South will likely go to Houston, and that would be the only “surprise” in the AFC this year.  The Texans won just 4 games last year, although expectations were much higher this year with a healthy Deshaun Watson.  The Titans, who made the playoffs last year, are still technically in the hunt for the division title, which would make the AFC (lack of) turnover even more extreme.

Things aren’t much different in the NFC.  The Saints and Rams have already clinched their division titles for the second year in a row. The Seahawks and Cowboys, who each won 9 games last year, will likely be in the postseason this year.  The Bears are the Texans of the NFC, going from 5-11 to division champion with a first round quarterback from the 2017 Draft.  Nobody in the NFC wants the 6th spot, but the Vikings — who went 13-3 last year — are the current favorite.

Think about that: if the season ended today, then 10 of the 12 playoff teams in 2018 had a winning record in 2017. There is still time for the Dolphins or Colts to snag the 6 seed in the AFC from the AFC North runner up, but in the NFC, the Eagles and Panthers (who both won 11+ games last year) are on deck for the 6 seed if the Vikings falter.

How does that compare to prior years? Assuming 10 of the 12 2018 playoff teams — 83% — had a winning record in 2017, that would stand out as a pretty big outlier. It would mark a reversion to the 1980s, pre-salary cap and free agency era of the NFL, where parity didn’t play a central role. The graph below shows, for each year since 1970, the percentage of teams that made the postseason and had a winning record the prior year. [continue reading…]

{ 0 comments }

Week 14 Passing Stats: Primetime Flops

You don’t expect to see Jared Goff’s at the bottom of the weekly ANY/A rankings, at least not since his rookie year.  But Goff had the worst game of his career on Sunday night, throwing for only 180 yards while also throwing 4 interceptions and zero touchdowns against the Bears.  Savvy readers will know that since an interception is worth -45 yards in the ANY/A formula, a passer with 180 yards, no TDs, and zero INTs will have an ANY/A of 0.00, regardless of their number of attempts.

Goff also took three sacks, so he finished with an ANY/A of -0.53.  The quarterback on the opposing sideline, Mitchell Trubisky, wasn’t much better. Trubisky threw a touchdown, but picked up just 110 yards while throwing 3 interceptions; he finished with an ANY/A of -0.48 on 31 dropbacks.

And then on Monday Night Football, we saw some more bad passing from a pair of star quarterbacks.  Russell Wilson was the winning quarterback, and the Seahawks became just the second team in the last 9 years to win a game with 60 or fewer passing yards on 20 or more passing stats (the 2017 Seahawks being the other). Wilson finished with an ANY/A of 0.68 and a passer rating of 37.9, the single worst performance of his career.

Kirk Cousins was the losing quarterback on MNF, and while his final statistics don’t look too bad, they are a bit misleading.  Cousins took a strip sack with three minutes to go that was recovered and returned for a touchdown, putting Seattle up 21-0.  After that, Cousins threw for 70 yards and a touchdown on his final 6 meaningless passes; prior to that moment, he was averaging 4.45 ANY/A.  He had thrown for just 5 first downs on his first 29 passes.

The table below shows the weekly passing results: [continue reading…]

{ 0 comments }

Week 14 Was Pretty Weird

Entering week 14, the top of the 2019 NFL Draft order was San Francisco at 1, Oakland at 2, and the New York Jets at 3. All three teams promptly won in week 14. The Los Angeles Rams were 11-1, and promptly got embarrassed by the Chicago Bears; Jared Goff, who had never thrown more than 2 interceptions in a game, threw 4 interceptions against a punishing Bears defense. The Oakland Raiders won as 10.5-point underdogs against Pittsburgh, but depending on when you measure it, there was en even more shocking result. The Miami Dolphins were 9.5-point underdogs against the Patriots, trailed by 5 points with 7 seconds left and 69 yards to go, and still won.

In a week like this one, the Texans seeing their 9-game winning streak end at home against the Colts doesn’t quite register as surprising. And the Browns beating anyone, let alone the Panthers? Well, that’s not even a top-5 upset. The table below shows each upset this season, based upon the — as of right now — SRS ratings of each team this year. Here’s how to read it: in week 14, Oakland beat Pittsburgh, 24-21. Oakland has an SRS of -9.1, while the Steelers have an SRS of +5.1. That’s a difference of -14.2 points. There were 6 upsets this week, and a Minnesota upset in Seattle tonight would bring that total to 7. [continue reading…]

{ 0 comments }

On the surface, the Raiders pass defense doesn’t look that terrible. Oakland has allowed 2,920 passing yards, which is actually slightly above average (14th fewest in the NFL). Opposing passers are completing just 62.9% of passes against Oakland, which ranks as the 8th best mark in the NFL. Even in interceptions, where the Raiders are below average, the defense’s 9 interceptions still ranks tied for 21st in the league. So bad, but not particularly noteworthy.

But there are three places where Oakland’s pass defense looks really, really bad.

  • The Raiders have just 10 sacks this season and a 2.8% sack rate; both marks are easily the worst in the league. Only four teams ever have had a sack rate below 3.0% for a full season: the 2008 Chiefs (1.9%), 1981 Colts (2.6%), 2009 Jaguars (2.7%), and 1958 Packers (2.9%). There are 9 players this year with more than 10 sacks, and Khalil Mack (9 sacks in 10 games) is averaging more sacks per game than the entire Raiders defense (10 sacks in 12 games).
  • Opposing passers are averaging 13.76 yards per completion this season.  In the modern era, the average yards per completion has been declining for decades.   The Lions are allowing 12.5 yards/completion this year, the second worst rate in the NFL. How bad has Oakland been? The last time a pass defense allowed this many yards per completion was the 1990 Patriots.
  • The Raiders have allowed 29 touchdown passes, the most in the NFL.  That’s despite facing just 345 pass attempts, the fewest in the NFL.  That’s remarkable and it is because Oakland has allowed a touchdown pass on 8.4% of all passes.  That’s the worst rate of any team since the 1967 Dolphins.

Oakland has allowed 8.7 ANY/A this year, which puts the Raiders in shouting distance for the worst pass defense ever (without adjusting for era, of course). That mark is currently held by the 2015 Saints.

{ 1 comment }

Yesterday, I wrote that NFL yards per carry is at an all-time high. But running backs — while performing very, very well — are not the only reason. In fact, running backs have been responsible for just 81% of all rushing yards this year, which is the lowest since at least 2002:

[continue reading…]

{ 0 comments }

Rushing yards per carry continues to rise: a month ago, I noted that the league-wide yards per carry average was 4.34. If that held, it would set a new record, breaking the 4.29 mark set in 2011.

Since then, rushing efficiency has soared: since week 9, the Panthers are averaging over 6 yards per carry, 9 more teams are averaging over 5 yards per carry, and a total of 23 teams are averaging 4.29 YPC or better. The great rushing performance of the last month (4.61 YPC) has raised the 2018 league average mark to an incredible 4.44 yards per carry.

And yet, rushing quantity has never been lower. For the season, teams are rushing just 25.7 times per game, and even since week 9, that level is just 26.0 rushing attempts per game. This will go down as the season with the fewest rushing attempts in history, and also the season with the highest yards per carry average in history. The common theme here is passing: teams are passing more than ever, and defenses don’t seem very concerned about stopping the run. Offenses want to pass, and defenses are more than happy to allow teams to run (including via non-running back runs). That’s how you get crazy results like this.

And how crazy are these results? Well, take a look at the graph below, which shows every NFL season since 1932.  Each year is on the X-Axis, and there are two Y-Axes: the left Y-Axis shows yards per carry, and the right Y-Axis shows rushing attempts per game.  The NFL average yards per carry is shown in blue dots against that left Y-Axis, and the NFL rushing attempts per game is shown in red diamonds against the right Y-Axis.

{ 0 comments }

Previously:

I am short on time this week, so just a few notes:

The Chargers won with a -6.5 Game Script in Pittsburgh, while the Titans beat the Jets at home despite a -8.2 Game Script. The worst Game Script this year by a winning team was Green Bay at -9.3 in the season opener; the Titans game is the second lowest, followed by the Bears against the Cardinals in week 3, the Panthers in Philadelphia in week 7, and the Chargers/Steelers game. [continue reading…]

{ 0 comments }

On Sunday, the Jets lost to the Titans, 26-22. The Jets averaged 2.47 Adjusted Net Yards per Attempt, which is terrible; Tennessee averaged 7.05 ANY/A, which is a bit above average. In 2018, the average team is gaining 6.47 ANY/A. In other words, the Jets were 4.00 ANY/A below average, and Tennessee was +0.58 ANY/A above average.

Sadly for the Jets, that’s par for the course. There have been 21 games (out of 60) since the start of the 2015 season that the Jets were below average in passing offense and below average in passing defense. Here’s how to read the following graph:

X-Axis: Jets passing ANY/A, relative to league average
Y-Axis: Jets opponent’s passing ANY/A, relative to league average

Each year from 2015 to 2018 has a different data label, shown in the legend in the graph. But here’s the shorthand: dots to the left of the graph mean the Jets passing offense was bad; dots high in the graph mean the Jets passing defense was bad (because the opponent had a positive ANY/A relative to league average). Unfortunately for the Jets, things are getting worse: there are 6 large green dots (representing 2018) where the opponent was above average in ANY/A and the Jets were below average in ANY/A.

Here’s the raw data:

YearG#OppResultANY/AOpp ANY/ALg AvgRANY/AOpp RANY/A
201812TENL 22-262.477.056.47-40.58
201811NWEL 13-275.0910.426.47-1.393.95
201810BUFL 10-410.710.336.47-5.773.86
20189MIAL 6-130.513.716.47-5.96-2.76
20188CHIL 10-245.678.266.47-0.811.78
20187MINL 17-371.716.546.47-4.760.06
20186INDW 42-348.195.726.471.71-0.75
20185DENW 34-168.876.166.472.4-0.31
20184JAXL 12-314.439.36.47-2.042.83
20183CLEL 17-212.154.636.47-4.32-1.84
20182MIAL 12-205.6866.47-0.79-0.47
20181DETW 48-177.611.836.471.14-4.65
201716NWEL 6-265.185.315.91-0.73-0.6
201715LACL 7-141.717.755.91-4.21.84
201714NORL 19-312.57.675.91-3.411.76
201713DENL 0-23-0.166.335.91-6.070.43
201712KANW 38-319.7512.635.913.846.72
201711CARL 27-358.774.975.912.86-0.94
201710TAML 10-154.314.465.91-1.59-1.45
20179BUFW 34-217.486.045.911.570.14
20178ATLL 20-257.679.535.911.763.63
20177MIAL 28-316.57.355.910.591.44
20176NWEL 17-245.576.635.91-0.340.73
20175CLEW 17-145.246.195.91-0.660.28
20174JAXW 23-204.593.085.91-1.31-2.82
20173MIAW 20-610.122.65.914.21-3.3
20172OAKL 20-456.6110.365.910.74.45
20171BUFL 12-212.157.15.91-3.761.19
201616BUFW 30-107.813.446.221.59-2.78
201615NWEL 3-41-0.279.036.22-6.492.82
201614MIAL 13-342.6314.266.22-3.588.05
201613SFOW 23-174.174.866.22-2.05-1.36
201612INDL 10-412.6112.076.22-3.615.85
201611NWEL 17-229.366.526.223.150.3
201610LARL 6-944.76.22-2.22-1.52
20169MIAL 23-273.785.236.22-2.44-0.98
20168CLEW 31-286.725.566.220.51-0.66
20167BALW 24-168.483.136.222.26-3.09
20166ARIL 3-282.8276.22-3.40.78
20165PITL 13-316.449.486.220.223.26
20164SEAL 17-272.9310.246.22-3.284.02
20163KANL 3-24-1.866.896.22-8.080.67
20162BUFW 37-3111.1410.396.224.934.17
20161CINL 22-235.088.086.22-1.131.86
201516BUFL 17-222.186.076.26-4.08-0.2
201515NWEW 26-208.215.946.261.95-0.33
201514DALW 19-166.680.466.260.42-5.81
201513TENW 30-88.545.46.262.28-0.86
201512NYGW 23-207.796.926.261.530.65
201511MIAW 38-209.325.516.263.05-0.76
201510HOUL 17-243.028.366.26-3.242.1
20159BUFL 17-2244.96.26-2.26-1.36
20158JAXW 28-238.366.266.262.10
20157OAKL 20-345.7411.476.26-0.525.21
20156NWEL 23-307.886.616.261.610.35
20155WASW 34-209.542.696.263.27-3.58
20154MIAW 27-146.662.496.260.39-3.78
20153PHIL 17-243.074.416.26-3.2-1.85
20152INDW 20-76.83.656.260.54-2.62
20151CLEW 31-107.255.496.260.99-0.78

What do you think?

{ 0 comments }

It was a rough week 13 for many franchise quarterbacks.

But Patrick Mahomes was just fine, once against finishing as the top quarterback of the week.  It was yet another 4-TD, 120+ passer rating game for Mahomes, the fifth of this season.  By way of comparison, Jim Kelly and Joe Montana only had four such games in their entire careers.  Mahomes now has had a passer rating of at least 110 in 10 of 12 games this year, the second most by a player through 12 games in history (2011 Rodgers did it 11 times).

Of course, none of those stats are adjusted for era. But Mahomes is having a top-4 season for a 2nd-year quarterback since the merger even once you adjust for era, and arguably a top-2 season depending on how you feel about 2013 Nick Foles and a 28-year-old Kurt Warner in 1999. No, it’s not Dan Marino 1984, but it’s pretty clearly the best season a 23-year-old quarterback has had since Marino.

The full week 13 passing stats below: [continue reading…]

{ 0 comments }

It was not a happy birthday for Rodgers

Aaron Rodgers threw 50 passes on Sunday, but only threw for 233 yards. That’s very un-Aaron Rodgers like, who entered the day as the active leader in career yards per pass attempt. For his career, Rodgers averaged 7.87 yards per attempt prior to Sunday, but after yesterday’s performance — a 4.66 average — his career average dropped to 7.84.

Was this the worst game of Rodgers’s career? He had a game where he averaged 0.00 yards per attempt on one pass, but I don’t think you want to count that. He averaged 2.67 yards/attempt is a game against the Patriots in 2006, but he didn’t start the game and he threw just 12 passes. Maybe you prefer the 22-pass game against the 2015 Broncos as the worst Y/A game of his career, since he picked up just 3.5 yards per pass. Then again, there’s also this game against the Bills in 2014, where he averaged 4.4 yards per attempt on 42 passes; that feels even worse than the Denver game.

Because of the large variance in pass attempts, it’s hard to figure out what’s the worst Y/A game of a player’s career. But here’s one method I like: if you remove game X from a player’s career, how much does his career Y/A change? The game that causes the biggest change could be considered the best or worst game of that player’s career.

And by this methodology, the game against the Cardinals yesterday was in fact the worst game of Rodgers’s career. His career yards/attempt average is 7.840. Remove the game where he threw 1 pass for 0 yards, and his career Y/A is 7.841.  If instead you removed the 12-pass Patriots game, Rodgers’s career average would be 7.851.  If you instead removed the Denver game, his career average would be 7.858.  If the one game from Rodgers’s career you had to remove was that Bills game, his career Y/A would rise to 7.867.

But if you want to get his career Y/A average to 7.87, then you need to take out yesterday’s game.  That’s the game that has lowered his career average the most.  Take a look: [continue reading…]

{ 0 comments }

Marcus Mariota Needs To Throw More Incomplete Passes

Mariota is taken down for another sack.

Marcus Mariota is having the worst season of his career.  As a rookie in 2015, he ranked 22nd in ANY/A.  In 2016, he had a very strong year, finishing 8th in Adjusted Net Yards per Attempt. Last year, he fell back to 22nd in ANY/A, and this season, he ranks just 28th in ANY/A.

Of course, it’s important to know which statistics to examine. Mariota has completed 70.3% of his passes; before this year, his career best was a 62.2% rate as a rookie.  But there are two factors that make his completion percentage meaningless: one, completion percentage is rising league-wide, and more importantly, Mariota has taken a ton of sacks.

He has a 12.8% sack rate this year, easily the worst of his career.  What’s really remarkable is the interplay between his completion rate and his sack rate.  Mariota has thrown just 71 incomplete passes all season, while he’s taken 35 sacks.  That’s nearly a 2:1 ratio of incomplete passes to sacks!  By way of comparison, AFC South rival Andrew Luck has a ratio of nearly 13:1 — he’s thrown 138 incomplete passes and taken only 11 sacks.

There have been seven games this season where a quarterback had more sacks than incomplete passes: Mariota is responsible for 3 of those 7, and all 3 were losses (all other quarterbacks are 3-1 in such games): [continue reading…]

{ 0 comments }
Previous Posts