
As you probably know, Bill Barnwell has a new podcast over at ESPN known as The Bill Barnwell Show. I went on the show to discuss round 1 of the NFL draft; you can listen here.
Over at 538, I provided my thoughts on the trades in the first round of the 2016 NFL Draft. For example:
Cleveland gives up: eighth pick overall, sixth-round pick (No. 176 overall)
Tennessee gives up: 15th pick overall, third-round pick (No. 76 overall), second-round pick in 2017The Browns traded down and eventually selected Baylor wide receiver Corey Coleman; if he was Cleveland’s target all along, this was an excellent move — Coleman was at little risk of going before the 15th overall pick. Tennessee moved up to take offensive tackle Jack Conklin after the Baltimore Ravens began the run on offensive linemen at No. 6, with Ronnie Stanley. Cleveland extracted significant value in this move, perhaps because of a mental accounting effect, as the Titans may have viewed the picks involved as found money after the Rams trade.
Based on my marginal value chart, the Browns win the trade … even without considering the second-round pick in 2017! The 76th pick is a valuable one — more valuable than the difference between the eighth and 15th picks. If we value the 2017 second-round pick as equivalent to the 48th pick in this year’s draft, the Browns received a whopping 148 cents on the dollar for this trade. (The 48th pick is likely a worse pick than Tennessee’s 2017 second-rounder will be, but we’re eyeballing a markdown for having to wait a year.)
You can read the full article here.
Let’s use this page as an all-encompassing draft night reaction page. I’ll likely update this post a few times during the draft, but the main reason is to provide a page for the FP community to share any in-the-moment thoughts you have. Enjoy!
Jared Goff, unsurprisingly, goes #1. First player from the Pac-12 to go #1 since Andrew Luck. He’s the 13th player drafted #1 from the Pac-12 (or predecessor league).
Carson Wentz, of course, goes #2 to the Eagles. 17 years after Philadelphia selected Donovan McNabb at #2.
3) Joey Bosa is a bit of a surprise pick at 3 to the Chargers. Was the consensus #1 pick for awhile before the QB crazy occurred this spring.
4) The Cowboys go with Ezekiel Elliot, which is a surprise to me. The benefit of investing so much in the OL, and at QB and WR, is that RB should be plug and play. Using a premium pick on a RB is tough to justify in many instances, but really tough given the holes the Cowboys have on defense.
5) Jalen Ramsey was an obvious and great (to the extent any draft pick can be great) pick for the Jaguars. As Chris Brown noted on twitter, Ramsey is already an insane NFL athlete. Also, the college guys love him.
6) First offensive tackle off the board…. Baltimore needed an offensive tackle, and Ronnie Stanley (Notre Dame) makes a lot of sense. Going ahead of Laremy Tunsil, is a bit of a surprise. Will the Titans move up for him?
The Ravens have done pretty well with top ten picks:
| Rk | Year ▾ | Rnd | Pick | Pos | DrAge | From | To | AP1 | PB | St | CarAV | G | GS | College/Univ | ||
|---|---|---|---|---|---|---|---|---|---|---|---|---|---|---|---|---|
| 1 | 2003 | 1 | 10 | Terrell Suggs | LB | 20 | 2003 | 2015 | 1 | 6 | 11 | 96 | 182 | 166 | Arizona St. | College Stats |
| 2 | 2000 | 1 | 5 | Jamal Lewis | RB | 21 | 2000 | 2009 | 1 | 1 | 9 | 71 | 131 | 126 | Tennessee | College Stats |
| 3 | 2000 | 1 | 10 | Travis Taylor | WR | 21 | 2000 | 2007 | 0 | 0 | 7 | 32 | 101 | 90 | Florida | College Stats |
| 4 | 1999 | 1 | 10 | Chris McAlister | DB | 22 | 1999 | 2009 | 1 | 3 | 9 | 71 | 137 | 127 | Arizona | College Stats |
| 5 | 1998 | 1 | 10 | Duane Starks | DB | 24 | 1998 | 2006 | 0 | 0 | 5 | 35 | 97 | 67 | Miami (FL) | |
| 6 | 1997 | 1 | 4 | Peter Boulware | LB | 22 | 1997 | 2005 | 0 | 4 | 7 | 60 | 126 | 102 | Florida St. | College Stats |
| 7 | 1996 | 1 | 4 | Jonathan Ogden HOF | T | 22 | 1996 | 2007 | 4 | 11 | 12 | 94 | 177 | 176 | UCLA | College Stats |
7) San Francisco takes defensive lineman DeForest Buckner, who is an ideal fit for the 49ers 3-4 defense. Buckner was rumored to go as high as 3, so seems like a value pick.
8) We have a trade! Tennessee trades up with Cleveland. According to NFL Network, the trade was:
Cleveland gives up: 8th overall, 6th rounder (176 overall)
Tennessee gives up: 15th overall, 3rd round pick (76 overall), and 2017 2nd
The surprise? The move was for OT Jack Conklin.
9) The Bears trade up, and pay a hefty price for outside linebacker Leonard Floyd, who did have the 2nd best vertical at the combine.
10) A head-scratcher for the Giants: After paying big money to Janoris Jenkins and with Dominique Rodgers-Cromartie on the team, New York drafts… cornerback Eli Apple, who had a late first-round grade.
11) The Bucs then take a cornerback, Vernon Hargreaves III, which makes a little more sense. Most mock drafts had im going in the top 11, with almost all having him go in the top 15.
12) The Saints then took defensive tackle Sheldon Rankins, which was a heavily-mocked pick. No surprise there and it fits a need.
13) Miami ends the Laremy Tunsil free-fall; this looks like a great value pick for the Dolphins, assuming the marijuana issues are behind him.
14) Oakland takes safety Karl Joseph: the defense needed help, although this may be a reach based on mocks.
15) As I wrote yesterday, I expected one of the wide receivers to go earlier than was being mocked. The Browns triple down on Baylor, adding Corey Coleman to a passing attack that (maybe) has RG3 and (maybe) has Josh Gordon.
In 2003, Larry Fitzgerald caught 16 touchdowns in Pittsburgh’s first 8 games, making him one of only three players to reach those marks since 2000. The second was Texas Tech’s Michael Crabtree, who had 17 as a freshman in ’07 through eight games. That was eclipsed — by three whole touchdowns — last year, when Baylor’s Corey Coleman caught 20 touchdowns through 8 games. At the time, Coleman had 58 receptions for 1,178 yards and 20 touchdowns. Unfortunately, his numbers tanked after that, thanks (i) to injuries to first starting quarterback Seth Russell and then backup Jarrett Stidham and (ii) the schedule getting significantly harder.
As good as Coleman’s numbers were, though, he didn’t even lead the country in receiving yards at that time. TCU’s Josh Doctson had 71 receptions for 1,250 yards and 14 touchdowns through eight games. In game 9, Doctson had six catches for 64 yards against Oklahoma State before suffering a wrist injury in the second quarter that effectively ended his season.
Now, neither player is being projected to go in the top half of the first round. That maybe isn’t too weird, given the inflated offensive numbers for Big 12 offenses. In a mock draft on November 2nd (which is right before the seasons went downhill for Coleman and Doctson), Matt Miller had Doctson going to Dallas at 12 while Coleman wasn’t even in Miller’s mock (I don’t know if it was because Coleman was a junior or if Miller had him going in another round). A November 16th mock by Dane Brugler had Coleman getting drafted at 29, with Doctson not being selected in the first round. A November 19th draft at the San Diego Union Tribune had the duo going in the back third (23/31) of the first round, although the same author had them going 15th and 23rd a week earlier. [continue reading…]
Jared Goff and Carson Wentz are expected to be the first two picks in the draft tomorrow night. One thing you might not know about the two is that Goff is nearly two years younger than Wentz. Goff, who played three years at California but did not redshirt, was born on October 14, 1994; as a result, he’ll be 21.88 years old on September 1st of this season. Wentz was a fifth year senior for the North Dakota State Bison last year, and was born on December 27th, 1992.
There have been 103 quarterbacks drafted since 1967 in the first round of the NFL draft. Goff will be the 15th youngest as of September 1 of that season, while Wentz will be 15th oldest by that same measure. [continue reading…]
Recently, I posted a quick and dirty method to measure quarterback career value above average and above replacement. I used Adjusted Yards per Pass Attempt as the foundational stat because its inputs (yards, touchdowns, interceptions, and attempts) are on record back to 1932.
Today, I wanted to use the same model with Adjusted Net Yards per Dropback (ANY/A) as the base metric. I believe ANY/A is a more accurate reflection of quarterback production, but it does have the downside of only being recorded back to 1969 in Pro Football Reference’s database.
Thus, while the previous post covered every passer in the official stat era, this post will only cover value added since 1969. This means greats like Sammy Baugh and Sid Luckman are completely overlooked, while legends like Johnny Unitas and Joe Namath only have their worst years included (an unfortunate byproduct of this study’s limitations, to be sure).
In case you didn’t want to click back through the previous article to see the details of the formula, I’ll briefly cover the basics here: [continue reading…]
From 1993 to 2015, the New York Islanders lost eight consecutive playoff series, beginning with a loss in the conference finals to Montreal in 1993, and culminating in a heartbreaking, 7-game series loss last year to Washington. Last night, the Isles came from behind and defeated Florida, to win the series, four games to two.
So the streak stopped at eight for the Islanders; as it turns out, the longest streaks for consecutive playoff losses in NFL history is also at eight, with two of those streaks being active. [continue reading…]
Yesterday, I wrote how the NBA seemed to undervalue the three-point shot for many years. While the 3-point shot was consistently the better EV play, and the ratio of three-point shots to overall shots was increasing, it didn’t seem to increase quickly enough. As pointed out in the comments, one could make a pretty similar claim about pass/run ratio in the NFL.
It’s a little misleading to start things in 1970, since that’s really the beginning of the dead air era in football history. Pass efficiency was very high in the late ’40s and parts of the ’60s, so a chart beginning in 1970 would inaccurately imply a linear progression of the passing game. That said, because first down data is spotty the farther back we go, and because of the complexity involved in deciding how to treat the AFL, I’m going to limit myself today to the period from 1970 to 2016. [continue reading…]
In overly simple terms (ignoring things like fouls, rebounds, game theory, etc.), the expected value of a 2-point field goal attempt is the 2-point field goal percentage multiplied by 2, and the expected value of a 3-point field goal attempt is the 3-point field goal percentage multiplied by 3. Here’s a look at the EV for both 2-point and 3-point attempts in every NBA season going back to 1979-1980, courtesy of basketball-reference:

The inflection point came right around 1990; after that, the 3-point shot was associated with a higher expected value, and since ’97-’98, the 3-point shot has about 12% more EV than a 2-point shot. Now, I know just about nothing about the NBA and even less about NBA analytics, but it’s easy to draw a couple of conclusions from this chart. One would be that teams should be taking more 3-pointers, even though “traditional coaches” have not been fans of the 3-point shot. It’s easy to look at this chart and dismiss it, and say that a team shouldn’t take a bunch of 3 pointers just because the math says it makes sense. On the other hand, you have the Golden State Warriors. [continue reading…]
Florida State cornerback/safety Jalen Ramsey is going to be the first defensive back selected in the 2016 Draft. Ramsey may go as high as #3 overall to San Diego, as the first non-quarterback off the board. On a recent Bill Barnwell podcast — and by the way, he has a new podcast that you should subscribe to — Bill wondered when we will see the day when a cornerback goes first overall.
Technically, that already happened, when Colorado State’s Gary Glick was the first pick off the board in ’56 (Glick played safety, running back, and even kicked for the Steelers). But in the common era draft beginning in 1967, the highest a defensive back has been drafted is second overall, when the late great Eric Turner was drafted by the Browns. The trio responsible for that pick? GM Ernie Accorsi, head coach Bill Belichick, and
defensive coordinator Nick Saban. Those guys knew a thing or two about defensive back play, and were comfortable taking a safety with the second pick.
But in general, the first defensive back goes off the board at around the 10th pick, although it is happening a bit earlier in recent years (the median spot for the top DB has been 6 over the last 15 drafts). The graph below shows the slot where the top defensive back was taken in every draft, and no, that 1974 Draft is not a bug: [continue reading…]
A year ago, I wrote that quarterbacks going with the first two picks in the NFL Draft was a pretty unusual thing. From 1967, the start of the common draft, through 2011, it happened just four times. Since then, it has happened two more times, and now will apparently happen in 2016, too, after the Eagles sent way too many draft picks to the Browns for the right to pick second overall. We can save for another day how this was a shrewd move by Cleveland — if nothing else, the Browns do have a history of getting a boatload to move down, including in trades for Sammy Watkins and Julio Jones — and a head-scratcher for the Eagles.
This move also opens up San Diego as the team “in control” of the draft, non-QB edition. The Chargers will now take the first non-QB off the board. Unfortunately, that’s a lot less exciting than it sounds, although it may come with it the ability to extract some trade value, potentially from the Cowboys at #4. Let’s take a look at the six times since 1967 that quarterbacks went 1-2, and who was the first non-QB taken. [continue reading…]

Watt has a lot of gray ink in a short amount of time
Smith was the better player — he was an 11-time Pro Bowler and an 8-time AP first-team All-Pro, compared to just 5/2 for Greene — and consequently was a clear first-ballot Hall of Famer. For whatever reason, it took Greene 12 years, but this summer, he will finally be inducted into the Hall. Given the fact that Smith has 25% more career sacks than Greene, you probably think that Smith was the better pass rusher. To that, the Gray Ink test says not so fast, my friend. [continue reading…]
Every April 1st, friend-of-the-program Matt Waldman (@MattWaldman) releases his Rookie Scouting Portfolio. The RSP is, well, insane. It’s a 300-page draft guide that not only provides rankings and analysis of 167 players, but also provides over 1,548 pages of scouting checklists and play-by-play notes.
Matt does top-notch work year round, and I can confidently state that the Rookie Scouting Portfolio is the most comprehensive analysis of rookie draft prospects at the offensive skill positions I’ve ever seen. But it’s not just about rankings and his analysis; he makes the evaluation process as transparent as possible to the reader, by identifying:
- Players that have boom-bust potential, players who may have already maxed out their potential, or players with great upside.
- Breakdowns/rankings of players by individual skills at the position.
- Player comparisons to past NFL players based on style and builds.
- Overall rankings and comparisons in cheat sheet/table format with pertinent measurements and workout results.
- Overall rankings with written explanations in paragraph form.
- Overrated, underrated, and long-term projects.
- Fantasy-friendly tiered cheat sheets.
Matt documents what he sees with play-by-play detail. Yes, that’s a lot of work. No, you don’t have to read that part of the book to get tremendous value from the RSP. And here’s something pretty neat: Matt ranks every player graded by position and then writes a post-draft analysis with rankings assembled in a tiered cheat sheet. This is free with the RSP purchase and available a week after the NFL Draft.
The RSP is $19.95 and available at www.mattwaldman.com. Matt donates 10 percent of every sale to Darkness to Light, a non-profit that combats sexual abuse through individual community and training to recognize how to prevent and address the issue. All told, the RSP contains nearly 1300 pages this year. If you’re the type who likes to read testimonials, well, Matt has lots of those. He’s also provided a few sample evaluations from prior years that you can review.
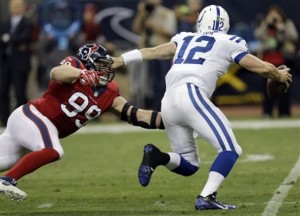
The best player in the AFC South is in this photo.
But I thought it would be interesting, especially in light of Jared Allen retiring, to look at the leaders in sacks on a trailing four year basis: [continue reading…]
References
| ↑1 | The Eagles, after starting 0-2, paid a million dollars to Memphis to essentially buy White from the league. |
|---|
You probably heard that Kobe Bryant has retired from the NBA. In his final game, he put up a whopping 60 points, albeit on a modern record 50 shot attempts. On twitter, Topher_Doll asked me what were some of the greatest final games in NFL history.
Since 1970, there have been 37 times where a player eclipsed 100 yards from scrimmage in his final game. This includes Calvin Johnson, but not Johnny Manziel, who rushed for over 100 yards in his last game but is not exactly out of the NFL just yet. The record-holder is Domanick Williams (formerly Davis) of the Houston Texans, who had a very successful but short career that was ended by a knee injury. [continue reading…]
Some thoughts as I review the 2016 schedule:
Monday Night
- There are 17 games on Monday evenings this year: two during the opening week (Pittsburgh/Washington at 7:10 Eastern, Rams/49ers at 10:20), one every other week, and as usual, none during week 17.
- Carolina, Chicago, Houston, Minnesota, the Giants and Jets, Philadelphia, and Washington each have two MNF games this year. Meawhile, the Browns, Jaguars, Chiefs, Dolphins, Chargers, and Titans do not play on Monday this season.
- Since hosting two games on Monday Night Football in 2011, the Jaguars have not played on Monday Night Football. Every other team has played on MNF at least once since 2013, but Jacksonville’s streak will extend to at least 2017 now.
- The Vikings host the Giants in week four. Minnesota has not had a home game on Monday Night since December 20, 2010. That was the second-longest stream in the NFL, a week shorter than Houston. The Texans streak will continue for another year: Houston plays two Monday Night games this year: in Denver and in Mexico (against Oakland).
Thursday Football
- There are 18 games on Thursday this year, although not all are on what is labeled the Thursday Night Football schedule. There is no game in week 17, but three on Thanksgiving — Minnesota/Detroit, Washington/Dallas, and Pittsburgh/Indianapolis — and one every other week during the season.
- Every team plays on Thursday at least once this year, with Carolina, Minesota, Dallas, and Denver getting that honor two times. The Panthers and Broncos play in the season opener and then later during the traditional TNF schedule, while the Vikings and Cowboys play (other teams) on Thanksgiving and then each other one week later on TNF. The NFL seems to be making a new trend out of this: last year the Packers and Lions played a memorable TNF game a week after both teams played on Thanksgiving, the Bears and Cowboys played seven days after both franchises played on Thanksgiving 2014.
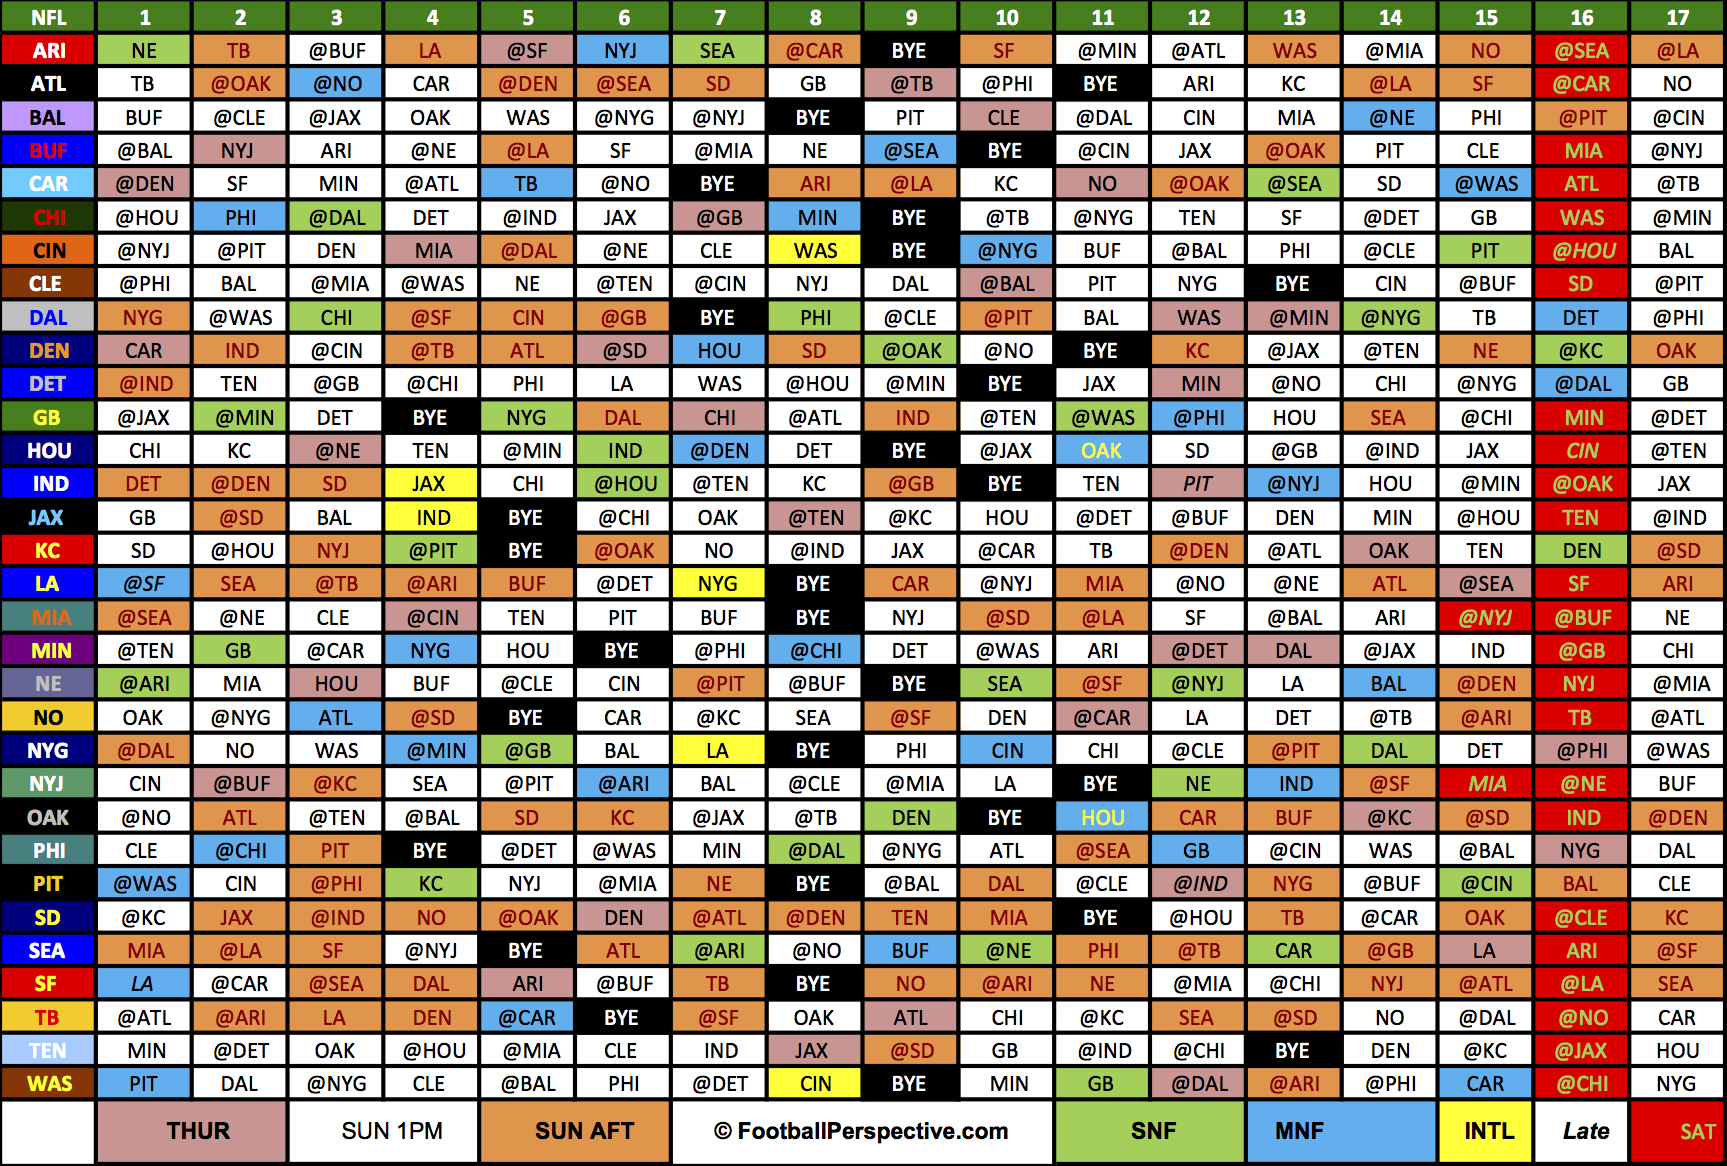
The color-coded schedule is back!
Download the Excel file here
That Excel file contains full page and wallet-sized copies of the schedule, in both color and black and white. On the wallet-sized copies, the line between weeks 8 and 9 has been enlarged — that is where you want to fold the paper in half to put in your wallet.
iPhone 6s page: http://www.footballperspective.com/wp-content/uploads/2016/04/nfl-2016-iphone-6s.png
Go to that page on your phone, then hit your power and home button at the same time to take a photo (or hit the button on the middle of the Safari browser and click ‘save image.’) The schedule has been formatted to fit an iPhone 6s screen, so you can always carry the schedule with you.
Go to that page on your phone, then hit your power and home button at the same time to take a photo (or hit the button on the middle of the Safari browser and click ‘save image.’) The schedule has been formatted to fit an iPhone screen, so you can always carry the schedule with you.
Commentary to follow, but for now, enjoy! And, of course, please report any bugs you see.

Perhaps giving Fisher more picks isn’t the answer
Today, the Rams — now in Los Angeles, of course — were on the buy side of things. And, as usual, to move up in the draft is quite expensive. THe Rams moved up from #15 to #1, and also gained a 4th (#113) and a 6th (#177) back in this year’s draft. But the price was exorbitant: Los Angeles had to give up both 2nd round picks it has this year (#43, courtesy of the Sam Bradford/Nick Foles swap last season, and #45, the team’s original selection), its third round pick (#76), and next year’s 1st and 3rd rounders. And while that doesn’t have quite the screaming headline of “Washington sends 3 first round picks for RG3,” make no mistake: the Rams gave up a massive amount to move up to #1, presumably to draft either Carson Wentz or California’s Jared Goff.
To simplify things, let’s try to cancel some things out. The 4th and 6th round picks received by the Rams this year is roughly equivalent to the 3rd giving up by Los Angeles next year; given the time value of the draft pick, a 6th round pick, it can be argued, makes up for getting to use that pick a year earlier, even if it’s a round later. I am sure both teams would have done this deal even if you take those three picks out of the mix, and it was probably included just to give Los Angeles a bit more in draft picks (instead of giving up 4 draft picks for 1 this year, now it’s 4 for 3). My hunch is the Rams were the one asking to throw in that last piece of the puzzle, even if it’s probably a better deal for Tennessee (since the time value of the draft pick is usually overstated). [continue reading…]
Yesterday, I looked at the Pythagenpat records for all teams since 2000. Since I crunched all that data, I thought it would be fun to look at the biggest outlier teams.
The 2003 Steelers were not very good. Pittsburgh went 6-10, scoring 200 points and allowing 327 points. Because of regression to the mean, the ’04 Steelers were expected to be a little better, and finish with 7.2 wins. Instead, behind a rookie Ben Roethlisberger and an outstanding running game and defense, the Steelers went 15-1, exceeding expectations by 7.8 wins.
Last year’s Panthers also went 15-1, and have a similar story. Cam Newton, the AP MVP, was more of the driving force, of course, but a great running game and defense powered the team. But based on a mediocre ’14 season, Carolina was expected to win only 7.8 games, so the 2015 Panthers exceeded expectations by 7.2 wins.
The third biggest outlier? That would be the ’07 Patriots, who went 16-0 with a projection of just 9.5 wins. The next year, New England was projected to win 10.99 games, and… went 11-5.
The table below shows each team since 2000, and their number of projected and actual wins. The table is sorted by the difference column: [continue reading…]
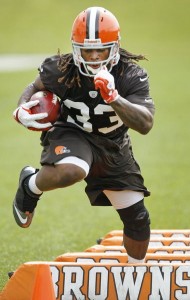
The Browns have been running in place
At MIT Sloan Sports Analytics Conference in March, unilateral fear existed inside analytics community that systemic ineptitude of Browns franchise will be too substantial for even DePodesta to repair. Failure would damage legacy of beloved industry pioneer and set field of sports data science back decades. “If you love analytics and want it to grow and succeed in the NFL, then you know Cleveland is a nightmare scenario,” states NFL executive with 20 years of experience in analytics. “Cleveland is a crazy, terrible place for this to be tested in football.”
The idea that Cleveland is too toxic to be resurrected is…. well, it’s more supported by the data than you might think. Certainly DePodesta could turn things around, but if he doesn’t, he’ll just be the next man in a long line of failed Browns executives. You won’t be surprised to learn that Cleveland has the worst winning percentage in the NFL since re-entering the league in 1999. But even accounting for the fact that the Browns have been bad, Cleveland has still underperformed to the tune of about 26 wins over the last 16 years, most in the NFL.
How did I arrive at that number?
- First, I calculated each team’s Pythagnpat winning percentage in each season beginning in the year 1999, which is based solely on the number of points scored and allowed by each team. For example, in 2014, the Browns scored 299 points and allowed 337, which translates to a 0.429 Pythagenpat winning percentage (the Browns actually beat that slightly, by going 7-9).
- Next, I ran a regression on the years 1999 to 2014, using Year N Pythagenpart winning percentage to predict Year N+1 wins. This would, in theory, help out the Browns, because Cleveland would be expected to win fewer games than the average team in Year N+1 because the Browns typically have a poor Year N performance. The best-fit formula was 0.311 + 0.376 * Yr_N_Pyth_Win%. This shows that regression to the mean is a large factor, because past performance only accounts for 38% of what goes into a team’s projection for Year N+1; the remainder is a constant for all teams.
Using Cleveland’s 2014 line as an example, the 2015 Browns would have been expected to win 7.6 games, because the 2014 team had 6.9 Pythagenpat wins, and regression to the mean drives that number towards 8 wins. But Cleveland won just 3 games last year, falling 4.6 wins shy of expectation. And that’s only the second-most disappointing season of the new Browns era: in ’08, Cleveland fell 4.7 wins shy of its Pythagenpat prediction. Take a look at every Cleveland season from 2000 to 2015 (obviously there was no prediction for ’99, since there was no ’98 team): [continue reading…]
Brian Malone, a writer for dynastyleaguefootball.com, has put together a great guest post today. You can follow him on Twitter at @BrianMaloneFF. Thanks to Brian for today’s article!
Testing the Tape
Projecting a player’s NFL potential from his college football performance is something like predicting a player’s potential as a tennis pro from his performance in the collegiate racquetball club. Sure, there’s correlation, but the variance in level of competition and style of play create ample noise. No wonder folks on Twitter spend hours debating hand size: at least it’s a standardized measure, and it’s not obviously worse than things like collegiate yards per carry.
The better approach is film study. Unfortunately, I’m not any good at it. Indeed, I don’t even know how to tell whether anyone else is any good at it. But that’s a problem we can attack. And the natural starting point is Matt Waldman’s Rookie Scouting Portfolio (RSP), which has the benefits of quantified observations, independent analysis, and a 10-year history.
The RSP includes a checklist of observed skills and abilities, including things like “Runs behind pads/Good pad level” and “Catches ball with proper hands technique.” The RSP assigns a weight to each and combines them into what I’ll call trait scores (i.e., “Power” and “Balance”) and an overall score.
Note the three steps to this process: (1) observing the skills and abilities; (2) assessing the importance of observed skills and abilities to each trait; and (3) assessing the importance of each trait to a player’s overall ability. The first step is off limits: we’ll take the observations as given. But the others are fair game: we have the tools to use Waldman’s observations, plus a little math, to build a traits-based model for predicting a prospect’s success. [continue reading…]
Over the last week, I’ve looked at the biggest quarterback declines and quarterback turnarounds when it comes to career records. But there were some limitations in those studies, so today, I want to use a new method.
I assigned 20 games of .500 play — i.e., a 10-10 record — to each quarterback’s record after every start of his career. Then I checked to see which quarterbacks had the biggest declines/improvements in record/rest-of-career record using these metrics.
Let’s take Marc Bulger as an example. He started 95 games in his career. At one point, he was 28-11, which is a 0.718 winning percentage. For the rest of his career, he went 13-43, for a 0.232 winning percentage. If we add 20 games of .500 play to his first stint, that makes him 38-21, which translates to a 0.644 winning percentage. For his rest of career, his record would go down as 23-53, a 0.303 adjusted winning percentage. That’s an adjusted winning percentage decline of 0.341, the most of any quarterback in history. [continue reading…]

The GOAT.
The table below shows all players who had at least 10 points of Approximate Value in the final season of their career (Megatron had 10 points of AV in 2015; Ferguson had 9) and whose last season came in 2014 or earlier. [1]Note that Patrick Willis had just 3 points of AV in his final year in the NFL. As it turns out, Brown ranks tied for first on this list, next to Colts defensive back Bobby Boyd.
Here’s how to read the table below. Boyd’s last season came in 1968 with Baltimore. Playing left cornerback, he accumulated 21 points of AV that year at the age of 31. He received a number of awards that season: he was 1st-team All-Conference (that’s what the + sign means) according to the Sporting News, and a 1st-team All-Pro choice by the AP, Pro Football Writers, NY Daily News, Pro Football Weekly, and the UPI. [continue reading…]
References
| ↑1 | Note that Patrick Willis had just 3 points of AV in his final year in the NFL. |
|---|
Friend of the program Bryan Frye is back for another guest post. As regular readers know, Bryan operates his own fantastic site, http://www.thegridfe.com. You can view all of Bryan’s guest posts here, and follow him on twitter @LaverneusDingle.
Floating around the internet, there are copious metrics for measuring quarterback performance. Some are very basic (passing yards, completion rate), while others are quite complex (EPA, WPA). Some are open-source (passer rating, ANY/A), while others are proprietary (DVOA, Total QBR). It seems there is a stat to cover just about every aspect of QB play, so the last thing we need is another useless number.
Well, I didn’t get that memo.
Today, I’m going to look at a somewhat abstract measurement for career value, based on adjusted yards per attempt relative to league average. I prefer ANY/A and my own TAY/P (and the different iterations of both metrics), but gaps in the record books mean we can only go so far with either. [1]Pro-Football-Reference doesn’t have ANY/A prior to 1969. I don’t have TAY/P prior to 1991; even without including first down data, I can only go back to 1963 before I run out of complete sack … Continue reading With AY/A, we can go back to 1932, the very first season of the “official stat” era in the NFL.
The methodology is simple and straightforward. I took Pro Football Reference’s AY/A Index Scores for every quarterback with at least 1500 career pass attempts. If you are familiar with PFR’s advanced passing stats, you know they are based on three seasons’ worth of data (years n-1, n, and n+1), and a score of 100 represents league average output. [2]Except in 1932, when there is no year n-1, and the current year, when there is no n+1. To find the AY/A+ score itself, you simply multiply a player’s z-score by fifteen and add the product to 100. Using this knowledge, I reverse engineered the passing Index Scores in order to find the number of standard deviations above or below average each quarterback’s AY/A was. I then multiply that number by pass attempts to come up with an abstract career value metric. I also did this for replacement level, using one standard deviation below average as the baseline for replacement play.
The formulas:
Value over average = [(AY/A Index Score – 100)/15]*Attempts
Value over replacement = [(AY/A Index Score – 85)/15]*Attempts
Like I said, this isn’t forking any lightning in the realm of quarterback analysis. It’s just a quick and dirty way to approximate career productivity based on a well-known metric.
The Results
The table below shows the abstract career value of the 182 quarterbacks who met the 1000 attempt threshold. Read it thus: Peyton Manning played 266 career games and had 9380 pass attempts. His career AY/A+ score was 116. This gives him a total value of 10005 above average and 19385 above replacement (this is the metric by which the table is sorted). Note that the table below does list all 182 quarterbacks, but for ease of scrolling, only the top 25 are displayed by default. You can change that using the dropdown arrow on the left, or you can search for your favorite passer.
| Rk | Quarterback | G | Att | AY/A+ | Val | Repl |
|---|---|---|---|---|---|---|
| 1 | Peyton Manning | 266 | 9380 | 116 | 10005 | 19385 |
| 2 | Tom Brady | 225 | 7792 | 115 | 7792 | 15584 |
| 3 | Dan Marino | 242 | 8358 | 112 | 6686 | 15044 |
| 4 | Drew Brees | 217 | 8085 | 112 | 6468 | 14553 |
| 5 | Brett Favre | 302 | 10169 | 106 | 4068 | 14237 |
| 6 | Joe Montana | 192 | 5391 | 118 | 6469 | 11860 |
| 7 | Steve Young | 169 | 4149 | 125 | 6915 | 11064 |
| 8 | Fran Tarkenton | 246 | 6467 | 110 | 4311 | 10778 |
| 9 | Aaron Rodgers | 126 | 4047 | 124 | 6475 | 10522 |
| 10 | Ben Roethlisberger | 171 | 5423 | 114 | 5061 | 10484 |
| 11 | Dan Fouts | 181 | 5604 | 113 | 4857 | 10461 |
| 12 | John Elway | 234 | 7250 | 106 | 2900 | 10150 |
| 13 | Warren Moon | 208 | 6823 | 107 | 3184 | 10007 |
| 14 | Philip Rivers | 164 | 5339 | 113 | 4627 | 9966 |
| 15 | Johnny Unitas | 211 | 5186 | 111 | 3803 | 8989 |
| 16 | Tony Romo | 155 | 4331 | 116 | 4620 | 8951 |
| 17 | Kurt Warner | 124 | 4070 | 116 | 4341 | 8411 |
| 18 | Ken Anderson | 192 | 4475 | 113 | 3878 | 8353 |
| 19 | Jim Kelly | 160 | 4779 | 110 | 3186 | 7965 |
| 20 | Donovan McNabb | 167 | 5374 | 107 | 2508 | 7882 |
| 21 | Len Dawson | 211 | 3741 | 116 | 3990 | 7731 |
| 22 | Otto Graham | 126 | 2626 | 129 | 5077 | 7703 |
| 23 | Boomer Esiason | 187 | 5205 | 107 | 2429 | 7634 |
| 24 | Sonny Jurgensen | 218 | 4262 | 111 | 3125 | 7387 |
| 25 | Roger Staubach | 131 | 2958 | 122 | 4338 | 7296 |
| 26 | Carson Palmer | 160 | 5443 | 105 | 1814 | 7257 |
| 27 | Dave Krieg | 213 | 5311 | 105 | 1770 | 7081 |
| 28 | Y.A. Tittle | 204 | 4395 | 109 | 2637 | 7032 |
| 29 | Phil Simms | 164 | 4647 | 107 | 2169 | 6816 |
| 30 | Mark Brunell | 193 | 4640 | 107 | 2165 | 6805 |
| 31 | Trent Green | 120 | 3740 | 112 | 2992 | 6732 |
| 32 | Sammy Baugh | 165 | 2995 | 118 | 3594 | 6589 |
| 33 | Roman Gabriel | 183 | 4498 | 106 | 1799 | 6297 |
| 34 | Eli Manning | 185 | 6227 | 100 | 0 | 6227 |
| 35 | Rich Gannon | 157 | 4206 | 107 | 1963 | 6169 |
| 36 | Steve McNair | 161 | 4544 | 105 | 1515 | 6059 |
| 37 | Craig Morton | 207 | 3786 | 109 | 2272 | 6058 |
| 38 | Randall Cunningham | 161 | 4289 | 106 | 1716 | 6005 |
| 39 | Troy Aikman | 165 | 4715 | 104 | 1257 | 5972 |
| 40 | Bob Griese | 161 | 3429 | 111 | 2515 | 5944 |
| 41 | John Hadl | 224 | 4687 | 104 | 1250 | 5937 |
| 42 | Jim Everett | 158 | 4923 | 103 | 985 | 5908 |
| 43 | Jeff Garcia | 125 | 3676 | 109 | 2206 | 5882 |
| 44 | Drew Bledsoe | 194 | 6717 | 98 | -896 | 5821 |
| 45 | Vinny Testaverde | 233 | 6701 | 98 | -893 | 5808 |
| 46 | Matt Ryan | 126 | 4530 | 104 | 1208 | 5738 |
| 47 | Terry Bradshaw | 168 | 3901 | 107 | 1820 | 5721 |
| 48 | Bart Starr | 196 | 3149 | 112 | 2519 | 5668 |
| 49 | Norm Van Brocklin | 140 | 2895 | 114 | 2702 | 5597 |
| 50 | Jim Hart | 201 | 5076 | 101 | 338 | 5414 |
| 51 | Daunte Culpepper | 105 | 3199 | 110 | 2133 | 5332 |
| 52 | Matt Hasselbeck | 209 | 5330 | 100 | 0 | 5330 |
| 53 | Neil Lomax | 108 | 3153 | 110 | 2102 | 5255 |
| 54 | Joe Theismann | 167 | 3602 | 106 | 1441 | 5043 |
| 55 | Jeff George | 131 | 3967 | 104 | 1058 | 5025 |
| 56 | Ron Jaworski | 188 | 4117 | 103 | 823 | 4940 |
| 57 | Chris Chandler | 180 | 4005 | 103 | 801 | 4806 |
| 58 | Ken O'Brien | 129 | 3602 | 105 | 1201 | 4803 |
| 59 | Matt Schaub | 141 | 3271 | 107 | 1526 | 4797 |
| 60 | John Brodie | 201 | 4491 | 101 | 299 | 4790 |
| 61 | Joe Namath | 140 | 3762 | 104 | 1003 | 4765 |
| 62 | Bobby Layne | 175 | 3700 | 104 | 987 | 4687 |
| 63 | Steve Beuerlein | 147 | 3328 | 106 | 1331 | 4659 |
| 64 | Jay Cutler | 134 | 4354 | 101 | 290 | 4644 |
| 65 | Brad Johnson | 177 | 4326 | 101 | 288 | 4614 |
| 66 | Steve Bartkowski | 129 | 3456 | 105 | 1152 | 4608 |
| 67 | Steve Grogan | 149 | 3593 | 104 | 958 | 4551 |
| 68 | Neil O'Donnell | 125 | 3229 | 106 | 1292 | 4521 |
| 69 | Bernie Kosar | 126 | 3365 | 105 | 1122 | 4487 |
| 70 | Brian Sipe | 125 | 3439 | 104 | 917 | 4356 |
| 71 | Steve DeBerg | 206 | 5024 | 98 | -670 | 4354 |
| 72 | Daryle Lamonica | 151 | 2601 | 110 | 1734 | 4335 |
| 73 | Danny White | 166 | 2950 | 107 | 1377 | 4327 |
| 74 | Earl Morrall | 255 | 2689 | 109 | 1613 | 4302 |
| 75 | Ken Stabler | 184 | 3793 | 102 | 506 | 4299 |
| 76 | Bert Jones | 102 | 2551 | 110 | 1701 | 4252 |
| 77 | Marc Bulger | 96 | 3171 | 105 | 1057 | 4228 |
| 78 | Kerry Collins | 198 | 6261 | 95 | -2087 | 4174 |
| 79 | Russell Wilson | 64 | 1735 | 121 | 2429 | 4164 |
| 80 | Sid Luckman | 128 | 1744 | 120 | 2325 | 4069 |
| 81 | Billy Kilmer | 170 | 2984 | 105 | 995 | 3979 |
| 82 | Chad Pennington | 89 | 2471 | 109 | 1483 | 3954 |
| 83 | Jim Harbaugh | 177 | 3918 | 100 | 0 | 3918 |
| 84 | Charley Johnson | 165 | 3392 | 102 | 452 | 3844 |
| 85 | Charlie Conerly | 161 | 2833 | 105 | 944 | 3777 |
| 86 | Jim Plunkett | 157 | 3701 | 100 | 0 | 3701 |
| 87 | Michael Vick | 143 | 3217 | 102 | 429 | 3646 |
| 88 | Joe Ferguson | 186 | 4519 | 97 | -904 | 3615 |
| 89 | Cam Newton | 78 | 2419 | 107 | 1129 | 3548 |
| 90 | Joe Flacco | 122 | 4070 | 98 | -543 | 3527 |
| 91 | Mark Rypien | 104 | 2613 | 105 | 871 | 3484 |
| 92 | Norm Snead | 178 | 4353 | 97 | -871 | 3482 |
| 93 | George Blanda | 340 | 4007 | 98 | -534 | 3473 |
| 94 | Jeff Blake | 119 | 3241 | 101 | 216 | 3457 |
| 95 | Matthew Stafford | 93 | 3691 | 99 | -246 | 3445 |
| 96 | Don Meredith | 104 | 2308 | 107 | 1077 | 3385 |
| 97 | Jay Schroeder | 118 | 2808 | 103 | 562 | 3370 |
| 98 | Aaron Brooks | 93 | 2963 | 102 | 395 | 3358 |
| 99 | Lynn Dickey | 152 | 3125 | 101 | 208 | 3333 |
| 100 | Jake Delhomme | 103 | 2932 | 102 | 391 | 3323 |
| 101 | Jeff Hostetler | 152 | 2338 | 106 | 935 | 3273 |
| 102 | Frank Ryan | 126 | 2133 | 108 | 1138 | 3271 |
| 103 | Bill Kenney | 106 | 2430 | 105 | 810 | 3240 |
| 104 | Greg Landry | 146 | 2300 | 106 | 920 | 3220 |
| 105 | Tommy Kramer | 129 | 3651 | 98 | -487 | 3164 |
| 106 | Archie Manning | 151 | 3642 | 98 | -486 | 3156 |
| 107 | Alex Smith | 126 | 3619 | 98 | -483 | 3136 |
| 108 | Jim McMahon | 119 | 2573 | 103 | 515 | 3088 |
| 109 | Brian Griese | 93 | 2796 | 101 | 186 | 2982 |
| 110 | Jim Zorn | 140 | 3149 | 99 | -210 | 2939 |
| 111 | Bobby Hebert | 118 | 3121 | 99 | -208 | 2913 |
| 112 | Jake Plummer | 143 | 4350 | 95 | -1450 | 2900 |
| 113 | Gus Frerotte | 147 | 3106 | 99 | -207 | 2899 |
| 114 | David Garrard | 86 | 2281 | 104 | 608 | 2889 |
| 115 | Babe Parilli | 189 | 3330 | 98 | -444 | 2886 |
| 116 | Jack Kemp | 122 | 3073 | 99 | -205 | 2868 |
| 117 | Billy Wade | 128 | 2523 | 102 | 336 | 2859 |
| 118 | Gary Danielson | 101 | 1932 | 106 | 773 | 2705 |
| 119 | Doug Williams | 88 | 2507 | 101 | 167 | 2674 |
| 120 | Bill Nelsen | 90 | 1905 | 106 | 762 | 2667 |
| 121 | Jon Kitna | 141 | 4442 | 94 | -1777 | 2665 |
| 122 | Andy Dalton | 77 | 2497 | 101 | 166 | 2663 |
| 123 | Elvis Grbac | 105 | 2445 | 101 | 163 | 2608 |
| 124 | Stan Humphries | 88 | 2516 | 100 | 0 | 2516 |
| 125 | Chris Miller | 98 | 2892 | 98 | -386 | 2506 |
| 126 | Wade Wilson | 125 | 2428 | 100 | 0 | 2428 |
| 127 | Milt Plum | 129 | 2419 | 100 | 0 | 2419 |
| 128 | Tom Flores | 106 | 1715 | 106 | 686 | 2401 |
| 129 | Tobin Rote | 149 | 2907 | 97 | -581 | 2326 |
| 130 | Doug Flutie | 92 | 2151 | 101 | 143 | 2294 |
| 131 | Bob Waterfield | 91 | 1617 | 106 | 647 | 2264 |
| 132 | Frankie Albert | 90 | 1564 | 106 | 626 | 2190 |
| 133 | Scott Mitchell | 99 | 2346 | 99 | -156 | 2190 |
| 134 | Erik Kramer | 83 | 2299 | 99 | -153 | 2146 |
| 135 | Ed Brown | 154 | 1987 | 101 | 132 | 2119 |
| 136 | Bill Munson | 107 | 1982 | 101 | 132 | 2114 |
| 137 | Tony Eason | 90 | 1564 | 105 | 521 | 2085 |
| 138 | Jason Campbell | 90 | 2518 | 97 | -504 | 2014 |
| 139 | Kyle Orton | 87 | 2712 | 96 | -723 | 1989 |
| 140 | Richard Todd | 119 | 2967 | 95 | -989 | 1978 |
| 141 | Andrew Luck | 55 | 2106 | 99 | -140 | 1966 |
| 142 | Rodney Peete | 104 | 2346 | 97 | -469 | 1877 |
| 143 | Eddie LeBaron | 134 | 1796 | 100 | 0 | 1796 |
| 144 | Tony Banks | 96 | 2356 | 96 | -628 | 1728 |
| 145 | Ryan Tannehill | 64 | 2248 | 96 | -599 | 1649 |
| 146 | Cotton Davidson | 111 | 1752 | 99 | -117 | 1635 |
| 147 | Ryan Fitzpatrick | 113 | 3473 | 92 | -1852 | 1621 |
| 148 | Charlie Batch | 81 | 1604 | 100 | 0 | 1604 |
| 149 | Jay Fiedler | 76 | 1717 | 99 | -114 | 1603 |
| 150 | Mike Livingston | 91 | 1751 | 97 | -350 | 1401 |
| 151 | Bubby Brister | 99 | 2212 | 94 | -885 | 1327 |
| 152 | Byron Leftwich | 60 | 1605 | 97 | -321 | 1284 |
| 153 | Don Majkowski | 90 | 1905 | 95 | -635 | 1270 |
| 154 | Steve Bono | 88 | 1701 | 96 | -454 | 1247 |
| 155 | Mike Tomczak | 185 | 2337 | 93 | -1091 | 1246 |
| 156 | Matt Cassel | 100 | 2574 | 92 | -1373 | 1201 |
| 157 | Marc Wilson | 126 | 2081 | 93 | -971 | 1110 |
| 158 | Sam Bradford | 63 | 2292 | 92 | -1222 | 1070 |
| 159 | Josh McCown | 77 | 1956 | 93 | -913 | 1043 |
| 160 | Eric Hipple | 102 | 1546 | 95 | -515 | 1031 |
| 161 | Dan Pastorini | 140 | 3055 | 90 | -2037 | 1018 |
| 162 | Vince Ferragamo | 75 | 1615 | 94 | -646 | 969 |
| 163 | Josh Freeman | 62 | 2048 | 92 | -1092 | 956 |
| 164 | Kordell Stewart | 125 | 2358 | 91 | -1415 | 943 |
| 165 | Trent Dilfer | 130 | 3172 | 89 | -2326 | 846 |
| 166 | Tim Couch | 62 | 1714 | 92 | -914 | 800 |
| 167 | David Carr | 94 | 2267 | 90 | -1511 | 756 |
| 168 | Mark Sanchez | 75 | 2267 | 89 | -1662 | 605 |
| 169 | Derek Anderson | 68 | 1543 | 90 | -1029 | 514 |
| 170 | Billy Joe Tolliver | 79 | 1707 | 89 | -1252 | 455 |
| 171 | Rex Grossman | 54 | 1562 | 89 | -1145 | 417 |
| 172 | Chad Henne | 64 | 1954 | 88 | -1563 | 391 |
| 173 | Frank Tripucka | 75 | 1745 | 88 | -1396 | 349 |
| 174 | Dave Brown | 73 | 1634 | 88 | -1307 | 327 |
| 175 | Mike Pagel | 132 | 1509 | 86 | -1408 | 101 |
| 176 | Kyle Boller | 67 | 1519 | 83 | -1722 | -203 |
| 177 | Jack Trudeau | 67 | 1644 | 83 | -1863 | -219 |
| 178 | Mike Phipps | 119 | 1799 | 83 | -2039 | -240 |
| 179 | Mark Malone | 73 | 1648 | 82 | -1978 | -330 |
| 180 | Joey Harrington | 81 | 2538 | 82 | -3046 | -508 |
| 181 | Rick Mirer | 80 | 2043 | 81 | -2588 | -545 |
I normally like to point out a few curiosities I notice in the data, but I’d rather just present the numbers and leave the comments to the readers. What sticks out to you? Oh, and one note: back in 2006, Chase did some back-of-the-envelope calculations that had Rick Mirer as the worst quarterback of all time. 10 years later, not much has changed.
References
| ↑1 | Pro-Football-Reference doesn’t have ANY/A prior to 1969. I don’t have TAY/P prior to 1991; even without including first down data, I can only go back to 1963 before I run out of complete sack data. |
|---|---|
| ↑2 | Except in 1932, when there is no year n-1, and the current year, when there is no n+1. |
Getting 62 wins is much easier the second time around
Tarkenton went 124-109-6 in his 18-year career with the Vikings and Giants. His first 62 wins took him a long time; at age 32, he was 62-86-4 after a week 6 loss to the Bears in 1972. At 24 games under .500 and with a career 0.421 winning percentage, Tarkenton was a five-time Pro Bowler with little to show for it and zero career playoff appearances.
But for the rest of his career, he won another 62 games, and he did so much quicker, going 62-23-2. That’s 41 games over .500 and a 0.724 winning percentage. That’s extremely impressive, of course, enough to make Tarkenton have a career 0.531 winning percentage. And, among quarterbacks who finished their career at .500 or better, Tarkenton is the only quarterback to ever be 24 games below .500 at any point in his career.
Although one could argue that Warren Moon had an even more remarkable career turnaround. I’ve written before about the terrible Oilers franchise that Moon joined in the mid-’80s. After 43 games, Moon had a 10-33 record. While it took Tarkenton 152 games to get to 24 games below .500, Moon was one shy of that mark in over 100 fewer games! At that point, the odds of Moon — then 30 years old — finishing his career with a winning record would have been seen as astronomically low. Yet he did just that, going 92-68 over the remainder of his career. [continue reading…]
The Dallas Cowboys are rumored to be drafting a replacement for Tony Romo with the fourth pick in the first round. In general, teams with bad offenses are the ones that draft quarterbacks, and technically, the Cowboys would fit that mold given the team’s struggles last year. But, of course, the Cowboys expect to have a good offense in 2016 with a healthy Romo, so I was curious how unusual it would be for a good team to spend a first round pick on a quarterback.
The table below shows the offensive SRS grade and the number of wins [1]Pro-rated to 16 games for non-16 game seasons. for each team that has drafted a quarterback since 1971 in the year preceding such draft. For example, the 2014 Bucs and Titans had very bad offenses and went 2-14 before drafting quarterbacks with the first two picks. That’s how things typically go, but not always. [continue reading…]
References
| ↑1 | Pro-rated to 16 games for non-16 game seasons. |
|---|
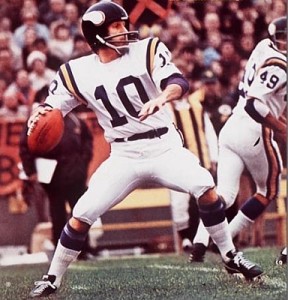
The under-appreciated Jim Hart
Kosar’s Browns defeated the Steelers in the 1990 season opener, which brought his career record to 40-23-1, or 17 games over .500. But Kosar went just 13-31 over his final 44 games; after a 0.633 winning percentage in his first 64 games, he posted a 0.295 winning percentage for the remainder of his career.
So I wondered, among quarterbacks who finished their career with a .500 record or worse, does Kosar hold the record for most games above .500 at any one point? As it turns out, that honor goes to Jim Hart. Younger fans likely know very little about Hart, but he’s one of the better quarterbacks not in the Hall of Fame. He spent 18 years with the Cardinals, and made the Pro Bowl in four straight seasons from ’74 to ’77. By 1981, he ranked third all time in career passing yards and ninth in passing touchdowns. He made it into the top 50 on Brad Oremland’s list, and snuck into the top 30 on my list.
But if you look at the raw numbers, you’re likely to be unimpressed. That’s because the bulk of his career took place during the ’70s, but also because he retired with an 87-88-5 record. But as of November 20th, 1977, Hart had a 69-47-5 record, a 0.591 winning percentage. Of course, it was all downhill from there for Hart, who went just 18-41 (0.305) for the rest of his career. [continue reading…]
Here is Colin Kaepernick’s ANY/A average in each of the last four years:

Kaepernick won’t listen to comments about his declining ANY/A
Kaepernick’s 2012-2015 represents just the 44th instance where a quarterback saw his ANY/A decline in three straight seasons (minimum 100 pass attempts each year). But he’s even an outlier in this group. He was one of just six quarterbacks who was younger than 25 at the start of the first season, joined by Pat Haden, Jeff Blake, Bernie Kosar, Rick Mirer, and Ken O’Brien. And he and Aaron Brooks are the only two players to have a dropoff of at least 0.5 ANY/A in each season.
Here’s how to read the table below, using Philip Rivers as an example. His four-year stretch began at the age of 28 in 2009, when he had an ANY/A average of 8.3. Over the next three years, that dropped to 7.77, 6.64, and then 5.45. His lowest decline in any of those seasons was 0.53 ANY/A, and this is the column by which the table is sorted. His total decline from Year 1 to Year 4 was 2.85 ANY/A. Finally, in the next season — what would be 2016 for Kaepernick — Rivers rebounded with a 7.79 ANY/A average. For players who did not have 100 pass attempts (and for Kaepernick) in season N+4, that cell is blank. [continue reading…]
Over the last couple of days, I’ve been looking at measuring the age of a team’s passing attack. On Friday, I noted that the Jaguars had the 2nd youngest passing offense in the NFL behind only Tampa Bay. And yesterday, I measured the youngest passing offenses in football history, with Jacksonville checking in at #20.
The Jaguars threw for 4,428 gross passing yards last season (or, 8,856 combined passing/receiving yards), though, so that makes them a bit more of an outlier. The table below shows all teams with at least 8,500 combined passing/receiving yards, and ranks them in ascending order based on average age: [continue reading…]
Yesterday, I measured the age of each team’s passing attack by calculating the yards-weighted age of each player who gained either a passing or receiving yard. Today, the historical results.
I’ve written a bit about Terry Bradshaw and his terrible rookie season of 1970, mostly in the context of number one picks taking a long time to break out. But here’s something that often gets lost in the mix: Bradshaw was just one of many inexperienced players on the ‘70 Steelers.
Bradshaw played as a rookie that year at age 22 (Terry Hanratty also started 6 games, and was also 22). The top 6 players in receiving yards on the ’70 Steelers were wide receiver Ron Shanklin (age 22), wide receiver Dave Smith (23), tight end Dennis Hughes (22), fullback John Fuqua (24), wide receiver Hubie Bryant (22), and wide receiver Jon Staggers (22). Incredibly, five of those six players were rookies, with Frenchy Fuqua being the sole exception — and he was drafted in 1969! In the ’70 draft, Pittsburgh took Bradshaw with the 1st overall pick, drafted Shanklin at 28, Staggers in the 5th round, and Smith in the 8th round, while both Hughes and Bryant were undrafted free agents that year. That’s unbelievable, and makes the ’70s Steelers passing attack akin to an expansion team — or rather, an expansion team with almost no access to the veteran market. As a result, Pittsburgh’s 1970 passing attack ranks as the youngest in history: [continue reading…]