≡ Menu

Five weeks in, the first edition of NCAA SRS ratings

Petty and Seastrunk have yet to break a sweat

Petty and Seastrunk have yet to break a sweat.

It’s still too early to put much faith in any computer ratings, but we can at least begin framing the discussion of which are the most impressive teams in college football. As always, thanks to Dr. Peter Wolfe for providing the final scores for every college football game. As a reminder, here’s the system for producing SRS ratings.

1) For each game not played at a neutral site, 3 points are given to the road team. After that adjustment, all wins and losses of between 7 and 24 points are recorded exactly as such. This means that a 24-10 road win goes down as +17 for the road team, -17 for the home team.

2) With one exception, wins of 7 or fewer points are scored as 7-point wins and losses of 7 or fewer points are scored as 7 point losses. So a 4-point home win goes down as +7 (and not a 1) and a 1-point home loss is a -7 (and not a -4). The one exception is that road losses of 3 or fewer (and home wins of 3 or fewer) are graded as ties. So a 21-20 home victory goes down as a 0 for both teams.

3) Wins/Losses of more than 24 points are scored as the average between the actual number and 24. This is to avoid giving undue credit to teams that run up the score. So a 75-point home win goes down as a 48-point win.

Once we have a rating for each team in each game, we then adjust each result for strength of schedule. This is an iterative process, where we adjust the ratings hundreds of times (to adjust for SOS, you have to adjust for the SOS of each opponent, and the SOS of each opponent’s opponent, and so on.) in Excel. Then we produce final ratings, where the SRS rating is the sum of the Margin of Victory and Strength of Schedule in every week.

After five weeks, what are the results? As usual, the table is fully searchable (type “-0”, for example, to see a list of undefeated teams, or SEC to see all SEC teams.) Right now, the number one team is Baylor, with an average (adjusted) Margin of Victory of 41.5 points per game against an average opponent that is 27.7 points better than average (average includes all football teams at all levels, so all FBS will have a positive grade). Among undefeated teams, no opponent has faced a tougher SOS than Alabama. Below shows all 125 FBS teams.
[continue reading…]

{ 8 comments }

Bradford looks to check down

Bradford looks to check down.

As a rookie, Sam Bradford ranked last in the league in yards per completion. That year, he averaged 9.92 YPC, 1.61 yards per completion lower than the league average of 11.53. In his second and third years — 2011 and 2012 — Bradford was a little better in that metric, but he still finished 0.65 and 0.34 yards per completion below league average in those seasons. So far in 2013, Bradford has earned his reputation as a checkdown artist: with a 10.21 YPC average, he’s averaged 1.43 fewer yards per completion than the average quarterback.

If you take a weighted average (based on his number of completions in each season), Bradford has been 0.98 yards per completion below league average over the course of his 980 career completed passes. In August, I noted that the Rams have experienced constant turnover at offensive coordinator and wide receiver since Bradford entered the league. This year, with Tavon Austin, Jared Cook, and developing talents like Chris Givens, expectations were high for Bradford. So far, we’ve seen more of the same from Bradford, which means lots of checkdowns and few big plays.

For his career, Bradford has averaged just 10.68 yards per completion. The table below shows the 164 quarterbacks since 1950 to complete at least 850 passes. The far right column represents the difference between each quarterback’s career yards per completion average minus the league average (calculated on a weighted-average basis for each quarterback based on his number of completions in each season) rate. As it turns out, Bradford ranks in the “top five” when it comes to the worst era-adjusted yards per completion averages.
[continue reading…]

{ 2 comments }

“Worldly wisdom teaches that it is better for the reputation to fail conventionally than to succeed unconventionally.” – John M. Keynes.

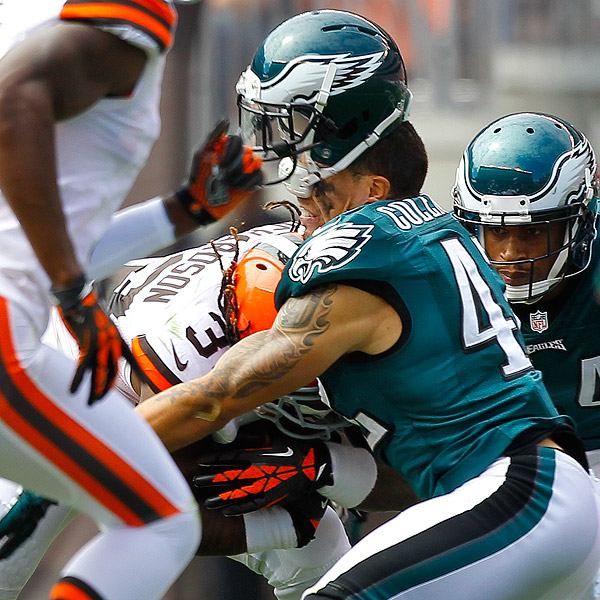
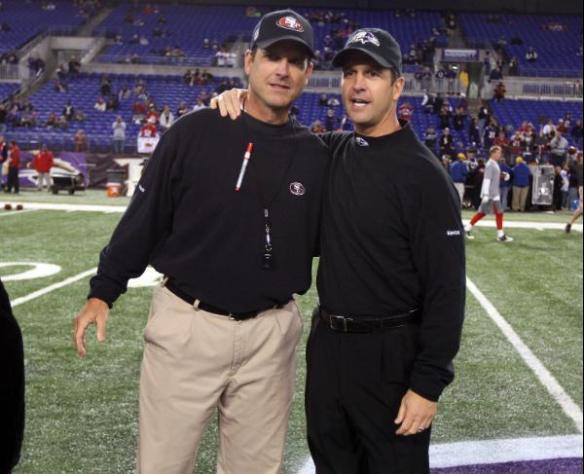
Photo via phillymag.com.

Last Thursday night, Chip Kelly was widely criticized for an unconventional decision that turned out to be unsuccessful. Trailing 10-0 in the first quarter against the Chiefs, Michael Vick threw a 22-yard touchdown pass to Jason Avant. The photo above shows how the Eagles lined up for the point after. Philadelphia’s two-point conversion attempt — a play known as the the Swinging Gate — was stopped, and it was stopped in particularly ugly fashion. That made it easy to point a finger and laugh at the college coach doing something silly.

But without the benefit of hindsight, there was nothing silly or even suboptimal about the decision. Putting aside the specifics of the play — we’ll get to that at the end — the main criticism seems to be that it was “too early” to go for two, or that the Eagles were “chasing points”, or that it was simply “unnecessary.” All of those are buzz words for saying that the Eagles should have behaved conventionally.

At a baseline level, let’s recognize that a team has a roughly 50/50 chance of converting on a two-point conversion. For a good offense with a mobile quarterback, that number may be even higher, but let’s just use the 50/50 number now. If that’s the case, then teams early in the game should be indifferent between kicking the extra point and going for two. Consider this hypothetical example: if a team had the option of kicking the extra point or flipping a coin — and heads gave them two points, tail giving them zero — would choosing to flip the coin be a poor decision?

Late in games, perhaps. But early in the game? I don’t see any reason to think that the difference between having six versus seven points on the board in the first quarter is more significant than the difference between having seven or eight points. Suppose you were told that your favorite team would score first quarter touchdowns in back-to-back games. Option 1 provides that your team would the extra point both times, while Option 2 is that your team would make the two point conversion once and fail on the attempt once. So you get eight points in one game and six points in the other.

Which would you prefer, Option 1 or Option 2? And why? And, if you prefer Option 1 to Option 2, how much more preferable is it? What would you be willing to trade to land in Option 1 — how many yards on the ensuring kickoff?

I would be indifferent between Options 1 and 2, but even if you preferred one, I don’t see how anyone could strongly prefer Option 1 to Option 2. The value to having 8 points is real, which is why it is never “too early” or “unnecessary” to go for two in a world where teams convert on two-point attempts half the time. Those are red herrings, because going for two is only a high-variance strategy; is it not a high-variance, lower-expected value option. Once you understand that, then nearly all the criticism about Kelly’s decision disappears.

As for the actual play call? I think it was a good one. Keep in mind that the Eagles did not pigeon hole themselves into going for two — based on how the Chiefs reacted to that formation prior to the snap, Philadelphia could have switched back to a normal extra point formation or simply taken a delay of game penalty with minimal harm. But Kansas City did not react well to the play pre-snap: The Eagles split two players out wide to the right, and Kansas City countered with two defenders to that side. But in the middle of the field, Philadelphia had the snapper, holder, and kicker, while the Chiefs kept four players in the middle of the field. I’m quite certain the special teams coach was not pleased with how the Chiefs responded to the situation, because that left K.C. with only five defenders to the defense’s right, while the Eagles were able to match up five blockers to that side and Zach Ertz, the eventual ballcarrier.

That’s a matchup Philadelphia should win more often than fifty percent of the time, and perhaps significantly more often than that. As it turns out, Lane Johnson blew the block, Tamba Hali made a nice play, and Kelly and the Eagles had egg on their face. Failing unconventionally has its drawbacks.

{ 4 comments }
Luck causes people to lose their minds

Luck causes people to lose their minds.

I can’t believe I’m writing this article. Everyone loves Chuck Pagano, but he made a pretty embarrassing blunder at the end of the Colts upset win in San Francisco on Sunday. The Colts led 13-7 when Andrew Luck scrambled for a six yard touchdown on 3rd-and-3 with just over four minutes left in the fourth quarter. Incredibly, Pagano then chose to kick the extra point, which my buddy and Colts fan Nate Dunlevy identified immediately as a terrible decision.

I wasn’t going to write a post about that decision, because, ya know, what could be more obvious than going for two when up by 12 points with just over four minutes left in the game? I mean, Jason Garrett got this right in the season opener. Being up by 14 points means two touchdowns doesn’t beat you, while there is almost no difference between being up 12 or being up 13 points. That doesn’t make for a very interesting post, though.

From 1999 to 2012, 36 teams scored a touchdown when leading by 6 points in the final eight minutes of the fourth quarter. Only 22 times did the team then follow that score by going for two, converting half of the time. Take a look:
[continue reading…]

{ 4 comments }

Week 3 Game Scripts and Average Field Position

The Seahawks look like the class of the NFC.

The Seahawks look like the class of the NFC.

The 2013 season started with two weeks of extremely close games; week three brought on the blowouts. On Monday Night Football, Peyton Manning, Eric Decker, Wes Welker, Demaryius Thomas, and Julius Thomas decimated the Oakland Raiders, helping Denver jump out to a 27-7 halftime lead. Yet that comes in as only the fourth most lopsided game of week three, behind the NSFW Jaguars-Seahawks contest, the Panthers 38-0 shutout of the Giants, and the Cowboys lopsided win over St. Louis. The table below shows the week three Game Scripts for each game, along with data on the number of pass attempts, rush attempts, and run/pass ratio for each team. Sacks are included as pass attempts, but all scrambles are included as running plays, something I would like to eliminate when I have more time.

Here’s how to read the Seahawks-Jaguars line. Seattle won at home against the Jaguars, 45-17, a 28-point margin of victory. The average lead for the Seahawks of every second of every game — the Game Script score — was 18.4 points. Seattle had 31 pass attempts against 35 runs, a 47% pass/run ratio. Jacksonville had 42 passes and 23 runs, a 64.6% pass/run ratio.
[continue reading…]

{ 3 comments }

Finding Comparables For Mike Glennon

Not opposed to occasional acts of piracy

Not opposed to occasional acts of piracy.

It’s official in Tampa Bay: Josh Freeman is out and Mike Glennon is in at starting quarterback. But what are the odds that Glennon actually plays well this year? I’m not very optimistic for a couple of reasons.

Vincent Jackson is a star, but he’s dealing with injuries to his ribs. On 30 passes aimed at Jackson this year, Freeman has picked up 265 yards, an average of 8.83 yards per attempt. On 23 targets to Mike Williams, Freeman has averaged 5.5 yards per pass. On his other 38 targets, Freeman’s averaged just 4.7 yards per pass. Right now, there simply aren’t enough weapons in Tampa Bay, as the Bucs desperately could use a receiving tight end and a slot receiver.

But here’s another reason not to expect much from Glennon. Since 1978, there are 30 rookie quarterbacks who are “similar” to Glennon in that they met the following three criteria:

  • Were not first round picks
  • Did not start in week 1 (i.e., they didn’t pull a Russell Wilson and win the job with a great training camp — they generally became the starter because the man in front of them was ineffective); and
  • Started at least four games as a rookie.

[continue reading…]

{ 8 comments }

New York Times: Post-Week 3, 2013

This week at the New York Times, I examine the disappointing San Francisco 49ers.

From the moment Coach Jim Harbaugh arrived in San Francisco in 2011, the 49ers have been one of the N.F.L.’s best teams.

In Harbaugh’s first two seasons, the 49ers ranked third in combined wins (24) and points differential (275), trailing only the New England Patriots and the Green Bay Packers in both categories. In those two seasons, San Francisco allowed 502 points, easily the fewest in the league. Even after losing in the Super Bowl in February, Harbaugh’s 49ers seemed poised to become the next dynasty. But after defeating the Packers in Week 1, San Francisco has been outscored, 56-10, in the last two weeks.

In Seattle, the 49ers were 3-point underdogs, and lost, 29-3. At home against the Indianapolis Colts, San Francisco was a 10 ½-point favorite, and lost by 20 points. For the season, San Francisco has fallen short of expectations — defined as the point spread in the game — by an average of 17.5 points a game (only the Giants, at 18.3 points, have been more disappointing). How have teams with similar expectations and results fared over the course of the rest of the season?

From 1990 to 2012, 14 teams have met three criteria: won at least 10 games in the previous year; on average, were favored to win the first three games of the next season; and failed to cover the spread by, on average, at least 10 points. On average, those teams won 12.5 games the previous season but just eight in the season in question, an indication that the slow start is a sign of mediocre things to come.

TeamYearPFPASpreadDifferenceN-1 RecordYear N Rec
NOR200712.734.3-1-22.710-6-07-9-0
SFO201314.728-4.2-17.511-4-1--
DEN199913.725.7-2.3-14.314-2-06-10-0
STL20021725-5.5-13.514-2-07-9-0
NOR201227.734-6.8-13.213-3-07-9-0
PIT200215.724.3-4.2-12.813-3-010-5-1
NWE200816.319.3-9.2-12.216-0-011-5-0
CHI199215.726.3-1.5-12.211-5-05-11-0
KAN200420.728.7-3.8-11.813-3-07-9-0
TEN20011223.3-0.3-11.713-3-07-9-0
WAS20001719.7-8.8-11.510-6-08-8-0
CHI20071119.3-3-11.313-3-07-9-0
PHI20031120.3-1.3-10.712-4-012-4-0
ARI20101625.7-0.5-10.210-6-05-11-0
IND200817.322.3-5-1013-3-012-4-0

The 2001 St. Louis Rams and the 2006 Chicago Bears lost in the Super Bowl, then both finished 7-9 the next season. The 2006 New Orleans Saints made it to the N.F.C. championship game, then started 2007 with four losses, and finished 7-9. Three games is a small sample size for the 49ers, but last year’s success guarantees nothing but high expectations. And only one of those 14 teams — the 2007 Saints — fell as far short of expectations (as measured by points differential relative to the point spread) as this year’s 49ers.

There might be more hope for a turnaround if San Francisco’s struggles were contained: unfortunately for 49ers fans, the team has struggled in every aspect of the game. The biggest surprise has been the fall of a dominant rush defense.

Two years ago, the 49ers did not allow a rushing touchdown until the 15th game of the season; last year, three of the team’s four linebackers (Aldon Smith, NaVorro Bowman and Patrick Willis) were named first-team All-Pro by The Associated Press, as the run defense finished in the top five in rushing yards, yards per carry and touchdowns allowed.

This season, the 49ers have allowed six rushing touchdowns. The struggles are not just at the goal line: Harbaugh’s 49ers allowed 170 rushing yards just once in his first 38 games (including the postseason). But they have allowed more than that in back-to-back weeks this season against the Seattle Seahawks and the Colts.

You can read the entire article here.

{ 6 comments }

Receiving WOWY Extended Back to 1950

A WOWY Superstar.

A WOWY Superstar.

Last week, we announced that our True Receiving Yards metric has now been calculated back to 1950, so it’s only fitting that we also compute WOWY (With Or Without You) for all of those receivers as well.

Skip the paragraph after this if you don’t care about the gory mathematical details, and just know that WOWY basically answers the question: “Did a receiver’s quarterbacks play better when they threw a lot to him, or not?”

For the brave souls who care about the calculation: WOWY starts by measuring the difference between a QB’s age-adjusted Relative Adjusted Net Yards Per Attempt in a given season and his combined age-adjusted RANY/A in every other season of his career. This is computed as an average for each team’s QB corps, using a combination of QB dropbacks during the season in question and the rest of his career as the weights (the exact formula is: weight = 1/(1/drpbk_year + 1/drpbk_other)). Finally, for each receiver we compute a weighted career average of the QB WOWY scores for the teams he played on, weighted by his True Receiving Yards in each season.

At any rate, the only players who don’t get a WOWY are those who either debuted before 1950, played with a QB who debuted before 1950, or played with a QB who ever threw to a receiver who debuted before 1950. Here are the career WOWY marks (when applicable), alongside TRY, for every 3,000-TRY receiver whose career started in 1950 or later:

[continue reading…]

{ 8 comments }

Trent Richardson – How Good Is He in Pass Protection?

Richardson exhibiting proper blocking technique

Richardson exhibiting proper blocking technique.

I have some bigger thoughts on the Trent Richardson trade, but I want to first address a statistic I’ve seen cited frequently the past few days. You’ve probably heard some variation on the following, perhaps first reported by ESPN:

Since the start of 2012 with Richardson on the field, Browns quarterbacks were sacked on 4.8 percent of dropbacks. With Richardson off the field, Browns quarterbacks were sacked on 9.4 percent of dropbacks.

Colts quarterbacks have been sacked on 6.2 percent of dropbacks since the start of last season, the ninth-highest rate in the league.

I’ll assume the numbers are accurate, but stats like that don’t mean anything out of context. The conclusion isn’t spelled out, but the reader is asked to connect the dots: Richardson is good at pass protection and Indianapolis could use an upgrade in that department, so this is another reason to like the trade for the Colts. But when is Richardson most likely to be off the field? In obvious passing situations, which happens to be the most likely time the Browns would be sacked.

Brandon Weeden and other Cleveland quarterbacks were sacked 36 times last year and 11 times in the first two games of 2013. First, we should note that Thaddeus Lewis started in week 17 last year against the Steelers — his only start of the year, and the only game Richardson has missed in his pro career. He was sacked four times on 36 dropbacks, an 11.1% rate. So let’s throw that game out, since nobody cares about Lewis’ sack rate.

According to NFLGSIS, Richardson was not on the field for 22 of the 43 sacks of Browns quarterbacks over the last year and two games. But the fine print is the real story: only five of those 22 sacks came on 1st or 2nd down, only seven came when Cleveland had the lead, and only three of those sacks occured when the Browns needed fewer than seven yards for a first down. Take a look:
[continue reading…]

{ 8 comments }

Favored to win or lose every game?

On Monday and Tuesday, I looked at the teams that had the longest streaks as either a favorite or an underdog. In the comments, James asked if I could put together a list of teams that were favored to win or lose every game in a single season.

Six teams — the ’98 Broncos, ’95 Cowboys, ’94 49ers, ’91 Redskins, ’84 49ers, and ’79 Steelers — were favorites in every game and won the Super Bowl. The ’97 49ers have the distinction of being the only team to be favored in every game during the regular season and be an underdog in the playoffs: that happened in the NFC Championship Game against the Packers.

In the table below, I’ve listed every team that was favored to win every regular season game since 1978, along with the average points spread, the team’s actual record, and their ranks in points and points allowed.

[continue reading…]

{ 8 comments }

Brady needs to channel another Tom (Flores) this season

Brady needs to channel another Tom (Flores) this season

As Jason Lisk and I wrote about before the season, Tom Brady and Ben Roethlisberger have become something of the poster children so far this year when it comes to veteran QBs working with inexperienced and otherwise less-than-notable receiving groups. And, lo and behold, each has put up career-low RANY/A marks through 2 games. But how do their receiving corps rank relative to those of other teams so far this year, and how do they stack up historically?

To take a stab at answering these questions, I turned to True Receiving Yards. For each player who debuted in 1950 or later, I computed their Weighted Career True Receiving Yards for every year, as of the previous season, to get a sense of how experienced/accomplished they’d been going into the season in question. Then, I calculated a weighted averaged of those numbers for every receiver on a given team, using TRY during the season in question as the weights. For example, here are the 2013 Patriots receivers:

PlayerAgeDebutTRY% of TmAt-the-time WCTRY
Julian Edelman27200913938%615.7
Danny Amendola2820097220%1541.9
Kenbrell Thompkins2520135615%0.0
Shane Vereen2420114412%110.9
Aaron Dobson2220134312%0.0
Michael Hoomanawanui25201051%278.8
James Develin25201341%0.0
Weighted Average560.7

The way to read that is: Julian Edelman has accounted for 38 percent of the Pats’ TRY so far. Going into the season, he had a career Weighted TRY of 615.7, so he contributes to 38% of the 2013 Pats’ weighted average with his 615.7 previous career weighted TRY; Danny Amendola contributes to 20% of the team weighted average with his 1541.9 previous career weighted TRY; etc. Multiply each guy’s previous weighted career TRYs by the percentage of the team’s 2013 TRY he contributed, and you get a cumulative weighted average of 560.7 — meaning the average TRY of a 2013 Pats receiver has been gained by a guy who had a previous career weighted TRY of 560.7.

Is that a low number? Well, here are the numbers for all of the 2013 team receiving corps (not including Thursday night’s Eagles-Chiefs tilt), inversely sorted by weighted average (asterisks indicate rookies):

[continue reading…]

{ 3 comments }

So far this season, one thing is obvious: the NFL scheduled Thursday night games every week for the express purpose of screwing with people who do data analysis. Even though week three has started, I’m not ready to close the door on week two, in which nearly every game was competitive into the fourth quarter. But that doesn’t mean the game script for every game was close.

Winner LoserBoxscorePFPAMarginGame Script
Green Bay PackersWashington RedskinsBoxscore38201817.9
Atlanta FalconsSt. Louis RamsBoxscore3124713.4
Oakland RaidersJacksonville JaguarsBoxscore199108.2
Seattle SeahawksSan Francisco 49ersBoxscore293267.7
New England PatriotsNew York JetsBoxscore131036.4
Denver Broncos@New York GiantsBoxscore4123185.5
Cincinnati BengalsPittsburgh SteelersBoxscore2010103.9
Miami Dolphins@Indianapolis ColtsBoxscore242043.3
San Diego Chargers@Philadelphia EaglesBoxscore333033.2
New Orleans Saints@Tampa Bay BuccaneersBoxscore161422.2
Houston TexansTennessee TitansBoxscore302461.3
Chicago BearsMinnesota VikingsBoxscore313011
Kansas City ChiefsDallas CowboysBoxscore17161-0.1
Baltimore RavensCleveland BrownsBoxscore1468-0.8
Buffalo BillsCarolina PanthersBoxscore24231-1
Arizona CardinalsDetroit LionsBoxscore25214-1.3

Steven Jackson was injured early in his revenge game against the Rams (and is expected to miss two-to-four weeks), but consider: Atlanta had 45 pass attempts against just 16 running plays in a game in which their average lead was 13.4 points. And that was with a gimpy Roddy White! Last year, I noted that the Falcons were the most pass-happy team in the NFL after adjusting for game script, and it appears that the model hasn’t changed in 2013.

There weren’t any huge comebacks this week, a byproduct of all the competitive games. The Cardinals scored nine points in the fourth quarter to beat the Lions, in a game where Detroit’s offense was shut out in the second half. Matt Stafford and company gained just 90 yards and four first downs on 24 second half plays, enabling the Cardinals to steal a win. Half of the team’s six second half drives were three and outs, one was a fumble on the second play, and the final drive was five plays and ended on downs. The only successful drive of the half was a 51-yard march that put the Lions at the Cardinals 27, but David Akers’ field goal attempt was blocked.

But while the offense had an off day, there’s a hidden factor that explains why Detroit didn’t score more than 14 offensive points (DeAndre Levy intercepted a Carson Palmer pass for 66 yard touchdown, accounting for the other seven points).
[continue reading…]

{ 3 comments }

This guy was pretty good.

This guy was pretty good.

About a month ago, Chase & I developed a stat called True Receiving Yards, which seeks to put all modern & historical receiving seasons on equal footing by adjusting for the league’s passing YPG environment & schedule length, plus the amount the player’s team passed (it’s easier to produce raw receiving stats on a team that throws a lot), with bonuses thrown in for touchdowns and receptions. It’s not perfect — what single stat in a sport with so many moving parts is? — but it does a pretty good job of measuring receiving productivity across different seasons and across teams with passing games that operated at vastly different volumes.

Anyway, today’s post is basically a data dump to let everyone know we’ve extended TRY data back to 1950 (before, it was only computed for post-merger seasons). Here are the new all-time career leaders among players who debuted in 1950 or later (see below for a key to the column abbreviations):
[continue reading…]

{ 13 comments }

New York Times: Post-Week 2, 2013

My article this week revolves around how Phil Emery has reshaped the Bears. It’s too early to grade any general manager, but the early returns are promising in Chicago.

In January 2012, the Chicago Bears were looking for a new general manager. That search concluded with the hiring of Phil Emery, a relative unknown who had been serving as Kansas City’s director of college scouting. Emery did not make immediate splashes, but one year later, he made two bold decisions that could have easily turned the Chicago faithful against him.

The Bears went 10-6 in 2012, but Emery chose to fire Coach Lovie Smith. The move was not without controversy; Marty Schottenheimer and Steve Mariucci had been the only coaches in the last 20 years to be fired after winning 10 games.

Bears players liked Smith, and replacing him was going to be challenging no matter whom Emery hired. But Emery went a step further: he didn’t hire an aspiring young offensive coordinator or the next great college coach. Instead, he went to the Canadian Football League to find Marc Trestman, coach of the Montreal Alouettes.

The next decision might have been even more courageous. Emery and Trestman got into a public contract dispute with Brian Urlacher, the on-field face of the Bears for the last decade. Chicago could have re-signed Urlacher, whose contract was expiring, but new management offered (in Urlacher’s words) a lowball contract to retain him.

As it turns out, Emery and Trestman read the market correctly: Urlacher retired after finding that no team was willing to spend big money on an aging linebacker. The new leaders risked alienating fans and losing the good will that new hires typically receive. But no one is spending much time these days thinking about whether Emery should have retained Smith or Urlacher. That’s because the Bears are 2-0 and one of the more exciting teams in the N.F.L.

You can read the full article, along with some other bits of statistical trivia, here.

{ 1 comment }

Longest streaks as an underdog

Yesterday, I looked at the longest streaks as a favorite. The ’99 to ’02 Rams were the record holder, as the team was favored in an astounding 57 consecutive games. Unfortunately for the franchise, things weren’t so great in the post-Kurt Warner era. In fact, five years after that streak ended, the Rams started a new record-setting streak. Starting in week 14 of the 2007 season, St. Louis was an underdog in 43 consecutive games. The streak finally ended when the 2010 Rams hosted the 1-6 Carolina Panthers. Incredibly, 100 games of Rams history can be broken down into two really long streaks of greatness and futility.

The 43-game streak spanned six quarterbacks: Brock Berlin, Marc Bulger, Trent Green, Kyle Boller, Keith Null, and Sam Bradford. The table below shows the 20 longest streaks for all teams since 1978.
[continue reading…]

{ 5 comments }

Longest streaks as a favorite

The GSOT

The GSOT.

On its own, this week five game against San Francisco doesn’t stand out as anything special. The 0-4 Rams were traveling to San Francisco with Jamie Martin at quarterback, who led the team to just 10 points the previous week in Dallas after Kurt Warner broke his pinky finger. The 49ers were coming off of a bye week, and would send Jeff Garcia and Terrell Owens to the Pro Bowl, while Garrison Hearst and Kevan Barlow led a top-six ground game. San Francisco should have, and did, win convincingly.

The reason that’s a notable game is precisely because the 49ers were six-point favorites. That marked the first time since week 2, 1999 — when the Rams had not yet been recognized as the Greatest Show on Turf — that St. Louis was not favored to win a game. For the final 14 regular season games and the three playoff games in 1999, all seventeen games in 2000, all 19 games in 2001, and the first four games in 2002 — a stretch of 57 straight games — the Rams took the field as favorites. That’s the longest streak since 1978, and perhaps ever. And I’m not sure if this makes that fact more of less impressive, but all things considered, the Rams’ record wasn’t that great during the stretch. Part of the reason for the streak was that St. Louis generally had a weak schedule those years, but continually being favored to win games without a great record is an interesting (and rare) sign of respect.

TeamStreakYear StartYear EndRecordStreak Ender
STL571999200240-17-0 vs. SFO
SFO391984198630-9-0 vs. MIA
DAL361981198326-10-0 vs. SFO
PIT351978198026-9-0 vs. HOU
SFO341989199029-5-0 vs. NYG
CHI331985198728-5-0 vs. DEN
SFO291991199324-5-0 vs. DAL
SFO281994199521-7-0 vs. DAL
WAS281991199223-5-0 vs. KAN
DAL271993199423-4-0 vs. SFO
DAL231995199616-7-0 vs. PHI
GNB211997199816-5-0 vs. MIN
DEN211998199917-4-0 vs. TAM
NWE202007200819-1-0 vs. NYJ

[continue reading…]

{ 9 comments }

Post-Week 3 College Football Ratings: Part II

Earlier today, I explained my methodology for coming up with college football ratings after three weeks. Here are the current ratings. These ratings are not capped for margin of victory (but do include a home field adjustment). That’s why Oregon tops Alabama (for now). These ratings exclude all FCS games except games where FBS teams lost to FCS teams, which are included (and all FCS teams are given a rating of -20). Here’s how to read the Alabama line. The Crimson Tide are ranked #2, and had a preseason rank (based on the Vegas point spreads) of #1. Alabam was considered 20.1 points better than average before the season; now they’re considered 21.4 points better than average, making them the top team in the SEC. Oregon jumped Alabama because the Ducks beat Virginia 59-10 and Tennessee 59-14.

RkTmPre RkPre SRSSRSConfConf Rk
1Oregon216.328.2P121
2Alabama120.121.4SEC1
3Florida St98.117.1ACC1
4Baylor35-1.115.2B121
5Georgia311.211.9SEC2
6Mississippi184.310.2SEC3
7Texas A&M411.210SEC4
8LSU68.89.3SEC5
9Oklahoma137.29.2B122
10Clemson145.98.9ACC2
11UCLA3008.7P122
12South Carolina78.68.2SEC6
13Oklahoma St127.28.1B123
14Ohio State5117.7B101
15Washington34-0.66.9P123
16Georgia Tech37-1.46.6ACC3
17Louisville271.56.4AAC1
18Arizona31-0.16.4P124
19Florida108.15.1SEC7
20Wisconsin203.94.7B102
21Michigan1753.9B103
22Miami FL261.63.4ACC4
23Stanford117.73.3P125
24Southern Cal155.53.2P126
25Arizona St222.73.2P127
26Northwestern290.71.9B104
27Texas Tech45-4.21B124
28Texas88.40.9B125
29Notre Dame165.50.8IND1
30Brigham Young41-20.5IND2
31Virginia Tech232.40.2ACC5
32Vanderbilt39-1.80.2SEC8
33Central Florida51-7.50.2AAC2
34TCU213.40B126
35Penn State33-0.6-0.1B105
36Nebraska194-0.5B106
37West Virginia46-5-0.9B127
38Missouri40-2-1.1SEC9
39North Carolina32-0.3-1.8ACC6
40Utah St55-7.9-2.7MWC1
41Auburn48-5.8-2.8SEC10
42Tennessee42-3.6-3.2SEC11
43Illinois89-14.9-3.3B107
44Oregon St251.7-3.4P128
45Navy75-12.5-3.5IND3
46Indiana67-11-3.6B108
47North Carolina St52-7.6-4ACC7
48Arkansas47-5.3-4.6SEC12
49Kansas St281.3-4.7B128
50Michigan St241.9-5B109
51Cincinnati43-4.1-5.3AAC3
52Mississippi St44-4.1-5.5SEC13
53Fresno St38-1.7-5.6MWC2
54Maryland49-7-5.8ACC8
55Washington St84-13.9-6.3P129
56Utah56-7.9-6.7P1210
57Boise St36-1.3-7MWC3
58Minnesota62-9.2-7.5B1010
59Rutgers59-8.2-7.5AAC4
60Pittsburgh53-7.6-8.1ACC9
61East Carolina64-9.4-8.3CUSA1
62Bowling Green63-9.3-8.8MAC1
63Syracuse50-7.1-9.1ACC10
64Houston80-13-10.4AAC5
65Virginia65-9.7-10.6ACC11
66Iowa57-8-10.8B1011
67Ball St68-11-10.9MAC2
68Rice78-12.8-11.6CUSA2
69Toledo79-12.9-12.2MAC3
70Duke74-12.5-12.4ACC12
71Colorado102-20.1-12.9P1211
72Boston College70-12-13ACC13
73Northern Illinois60-8.5-13.1MAC4
74California81-13.1-13.6P1212
75Marshall92-16.4-14.2CUSA3
76San José St86-14.3-14.5MWC4
77Louisiana-Monroe72-12.3-14.7SUN1
78Wyoming111-22.5-15MWC5
79Kentucky85-13.9-15.3SEC14
80SMU69-11.2-15.6AAC6
81Tulsa54-7.8-15.8CUSA4
82Purdue66-10.2-16.7B1012
83Hawai`i90-15.5-16.8MWC6
84Iowa St61-9.2-16.9B129
85Wake Forest73-12.5-17.2ACC14
86Louisiana-Lafayette77-12.8-17.5SUN2
87Middle Tennessee St87-14.8-17.6CUSA5
88North Texas110-22.5-18CUSA6
89Ohio U.91-15.5-18.1MAC5
90Arkansas St82-13.3-18.4SUN3
91Texas-San Antonio114-22.8-18.5CUSA7
92Kansas101-19.9-18.7B1210
93Akron117-25.5-18.9MAC6
94Colorado St94-18-19.7MWC7
95Temple95-18.2-19.8AAC7
96Texas St-San Marcos115-24.3-19.9SUN5
97San Diego St58-8.1-20.6MWC8
98UTEP96-18.8-20.6CUSA9
99Connecticut83-13.5-20.8AAC8
100Western Kentucky104-20.9-20.8SUN6
101Western Michigan112-22.6-20.9MAC7
102Memphis99-19.5-21.3AAC9
103Florida Atlantic118-26.9-21.6CUSA10
104Troy106-21.2-22.1SUN7
105Air Force76-12.5-22.2MWC9
106Kent St97-19.3-22.3MAC8
107New Mexico109-22.3-22.4MWC10
108Buffalo105-21-22.5MAC9
109Army107-21.5-22.7IND4
110Nevada88-14.8-22.7MWC11
111Louisiana Tech93-17.6-23.3CUSA11
112Alabama-Birmingham113-22.7-23.5CUSA12
113South Florida71-12.2-24.7AAC10
114Eastern Michigan108-21.6-25.2MAC10
115Southern Miss100-19.8-25.4CUSA13
116UNLV98-19.4-25.8MWC12
117Central Michigan103-20.4-29.2MAC11
118Florida Int'l116-25-32.4CUSA14
119Massachusetts121-36.6-35.3MAC12
120New Mexico St119-32.1-36.6IND5
121Miami OH120-33.9-40.8MAC13
122Idaho122-47.5-43.6IND6

To come up with the rankings, I placed a 50% weight on the preseason ratings and a 50% weight on the actual results. In a week or two, I’ll completely ignore the preseason ratings and calculate things the way I normally do. At that point, teams like Texas will really drop.

{ 7 comments }

Post-Week 3 College Football Ratings: Part I

With three weeks in the books, it’s time to unveil some college football ratings. This is part one — I plan to post Part II on Sunday afternoon.

It’s still too early to create meaningful SRS ratings, but there’s a workaround solution. You may recall that back in the summer, I created implied college football SRS ratings based on the Las Vegas spreads for 247 games. Those spreads were stale, but thanks to RJ Bell, founder of Pregame.com, I was able to get the final pre-game lines for those 247 games. I used those lines to build implied pre-season SRS ratings for 83 FBS teams, shown below:

RkTmGMOVSOSSRSConf
1Alabama1022.5-2.420.1SEC
2Oregon1121.7-5.416.3P12
3Georgia10110.311.2SEC
4Texas A&M78.62.611.2SEC
5Ohio State1016.7-5.611B10
6LSU94.14.88.8SEC
7South Carolina109.6-18.6SEC
8Texas1110-1.68.4B12
9Florida St913.2-5.18.1ACC
10Florida96.61.58.1SEC
11Stanford108.1-0.47.7P12
12Oklahoma St99.3-2.17.2B12
13Oklahoma107.3-0.17.2B12
14Clemson98.4-2.55.9ACC
15Southern Cal1110-4.55.5P12
16Notre Dame128.3-2.85.5IND
17Michigan95.9-0.95B10
18Mississippi6-2.87.14.3SEC
19Nebraska54.3-0.34B10
20Wisconsin63.50.43.9B10
21TCU91.91.53.4B12
22Arizona St103.7-12.7P12
23Virginia Tech620.42.4ACC
24Michigan St73.9-21.9B10
25Oregon St104.9-3.21.7P12
26Miami FL83.1-1.61.6ACC
27Louisville913.7-12.21.5AAC
28Kansas St82.4-1.11.3B12
29Northwestern94.1-3.40.7B10
30UCLA111.9-1.90P12
31Arizona105-5.1-0.1P12
32North Carolina5-10.7-0.3ACC
33Penn State81.6-2.2-0.6B10
34Washington100.9-1.5-0.6P12
35Baylor6-4.83.7-1.1B12
36Boise St36.2-7.5-1.3MWC
37Georgia Tech6-4.63.1-1.4ACC
38Vanderbilt5-8.16.3-1.8SEC
39Missouri4-11.89.8-2SEC
40Brigham Young80.1-2.2-2IND
41Tennessee7-8.54.9-3.6SEC
42Cincinnati24.3-8.4-4.1AAC
43Mississippi St6-11.37.2-4.1SEC
44Texas Tech3-10.56.3-4.2B12
45West Virginia8-6.31.3-5B12
46Arkansas7-11.46.1-5.3SEC
47Auburn8-8.93.1-5.8SEC
48Maryland1-2-5-7ACC
49Syracuse4-10.63.6-7.1ACC
50Central Florida2-12.55-7.5AAC
51North Carolina St3-12.24.6-7.6ACC
52Pittsburgh4-124.4-7.6ACC
53Tulsa1-157.2-7.8CUSA
54Utah7-12.14.2-7.9P12
55Iowa6-10.32.2-8B10
56San Diego St2-14.56.4-8.1MWC
57Rutgers2-6.3-1.9-8.2AAC
58Iowa St7-11.22.1-9.2B12
59Minnesota6-7.8-1.4-9.2B10
60Virginia5-14.54.8-9.7ACC
61Purdue3-15.55.3-10.2B10
62Indiana1-2211-11B10
63Boston College3-18.56.5-12ACC
64South Florida3-13.81.6-12.2AAC
65Wake Forest2-19.57-12.5ACC
66Navy2-4.5-8-12.5IND
67Air Force1-185.5-12.5MWC
68Houston1-14.51.5-13AAC
69California9-17.84.7-13.1P12
70Connecticut2-16.83.2-13.5AAC
71Washington St8-17.33.4-13.9P12
72Kentucky6-21.67.7-13.9SEC
73Nevada3-16.82-14.8MWC
74Illinois4-17.52.6-14.9B10
75Colorado St2-180-18MWC
76Temple3-19.21-18.2AAC
77UNLV3-9.5-9.9-19.4MWC
78Memphis1-211.5-19.5AAC
79Southern Miss1-18.5-1.3-19.8CUSA
80Kansas3-25.55.6-19.9B12
81Colorado7-21.31.2-20.1P12
82Central Michigan1-1-19.4-20.4MAC
83Army1-9-12.5-21.5IND

[continue reading…]

{ 7 comments }

What the Week 1 Passing Records Mean for 2013

In week 1, records were set for the most passing touchdowns (63) and team passing yards (8143) thrown in a single week in league history. Is this a sign that 2013 will represent the next stage in the evolution in the passing game, or are offenses typically ahead of defenses early on?

To compare week 1 of this season to other weeks in NFL history, we need to examine all statistics on a per team game basis to account for bye weeks and number of teams. But after calculating the per team game numbers, I multiplied the result by 32 to make the numbers easier to digest. The first graph shows the average number of passing touchdowns in week N of each season since 1970. As you can see, week 1 doesn’t stand out as typically being passer-friendly. On average, there were roughly 41.5 touchdowns per team game (after multiplying by 32) in week 1 of each season from 1970 to 2012, which is nearly identical to the average (40.9) the rest of the year:

[continue reading…]

{ 1 comment }

The Early Returns On Mike Shula Are Not Good

The Panthers ran a slow offense against Seattle

The Panthers ran a slow offense against Seattle.

Tom Brady and the Patriots ran 89 plays in week one. Chip Kelly’s Eagles ran 53 plays in the first half. The Denver hurry-up offense picked up 510 yards, and would have run more than their 68 plays had Peyton Manning stopped throwing touchdowns and prematurely ending drives.

But if it seemed like week one was played at turbo speed, you probably didn’t watch the Seahawks-Panthers game. Carolina finished with a league-low 49 offensive plays. For those who didn’t closely monitor the coordinator situation in Carolina, here’s a bit of background. Rob Chudzinski was the Panthers offensive coordinator the past two seasons. His team’s inconsistent play and poor record drew ire from some fans, but the overall impressive nature of the Carolina offense landed him the top job in Cleveland. With head coach Ron Rivera on the hot seat, he simply promoted quarterbacks coach Mike Shula to offensive coordinator. Here’s what my buddy and Footballguys.com co-writer Jason Wood had to say about the change back in June:

Mike Shula last called plays in the NFL in 1999, his final season coaching under Tony Dungy in Tampa Bay. Since then, Shula is better known as the guy who preceded Nick Saban at the University of Alabama and less for his abilities as an NFL offensive difference maker. In spite of his limited recent experience, … it was his relationship with and tutelage of Cam Newton that made him the obvious choice for the OC position.

Schematically, Shula is keeping the foundation of Chudzinski’s offense in place, but in an effort to expedite the pace he has simplified the terminology. By doing so, Cam Newton can get in and out of the huddle far faster and the Panthers can try to dictate tempo in a way that was impossible a season ago. Cam Newton explained in a recent interview, “Twins Right, Key Left, 631 Smash M sounds completely different than Twins Right Tampa…It comes out of your mouth faster. You get in the huddle, it’s the same exact play.”

The early returns on the up-tempo offense are not good — how did the team run just 49 plays against Seattle? Carolina was one of the few teams to have success on the ground in week one — the Panthers rushed for 134 yards on 5.2 yards per carry, placing them in the top six in both metrics. And while Cam Newton didn’t have a great game, he completed 70% of his passes, which usually leads to lots of plays. How does a team that runs well and throws only seven incomplete passes score just 7 points and get limited to 49 plays? As it turns out, Mike Shula bears some of the blame.
[continue reading…]

{ 6 comments }

New York Times: Post-Week 1, 2013

For the past few years, I have written a weekly in-season article for the New York Times’ football blog, The Fifth Down. The Fifth Down has been folded into the regular sports section, so you can find my weekly articles on the NYT Sports Page. The main subject in my article this week revolved around Chip Kelly’s NFL debut and the failure of the running game in week one. But since today is also game day, here is an excerpt about a bit of trivia for the Jets-Patriots game:

Belichick against Rookies

The Patriots defeated Buffalo and rookie quarterback EJ Manuel on Sunday, 23-21. On Thursday Night, rookie Geno Smith and the New York Jets travel to New England in hopes of pulling off a big upset. Rookie quarterbacks are now just 4-11 in games against Bill Belichick’s Patriots, although one of those wins came from the last Jets rookie to start against New England: Mark Sanchez. New York is a thirteen-point underdog in week two, which is par for the course. With the exception of a meaningless week 17 game against Vince Young and the Tennessee Titans in week 17, 2006, no team with a rookie quarterback has ever been favored to beat Belichick’s Patriots. At thirteen points, that makes Smith’s Jets the largest underdog of any of these rookie-led teams.

YearWkOppQuarterbackLoc.BoxscoreLineW/LPFPA
20131BUFEJ ManuelHomeBoxscore10Loss2123
20126SEARussell WilsonHomeBoxscore4Win2423
201211INDAndrew LuckRoadBoxscore10Loss2459
201213MIARyan TannehillHomeBoxscore9Loss1623
201217MIARyan TannehillRoadBoxscore10Loss028
20109CLEColt McCoyHomeBoxscore4Win3414
20092NYJMark SanchezHomeBoxscore3.5Win169
200911NYJMark SanchezRoadBoxscore11Loss1431
200617TENVince YoungHomeBoxscore-3Loss2340
20048PITBen RoethlisbergerHomeBoxscore3Win3420
200413CLELuke McCownHomeBoxscore11Loss1542
200420PITBen RoethlisbergerHomeBoxscore3Loss2741
200315JAXByron LeftwichRoadBoxscore6Loss1327
200213DETJoey HarringtonHomeBoxscore6Loss1220
200117CARChris WeinkeHomeBoxscore6.5Loss638

For his career, Belichick is 18-9 as a head coach or defensive coordinator against rookie quarterbacks.

You can read the full article here.

{ 6 comments }

Wilson pulled out a close victory against Carolina

Wilson pulled out a close victory against Carolina.

Regular readers know all about Game Scripts, the term I’ve used to represent the average margin of lead or deficit over the course of every second of a game. Let’s use the Seahawks-Panthers game to explain how to calculate the Game Script score.

Steven Hauschka’s field goal with 9:40 left in the second quarter was the first score of the game; that means for the first 20 minutes and 20 seconds, the score was tied. Cam Newton responded with a touchdown drive, hitting Steve Smith for a three-yard score with 3:20 left in the half. So for six minutes and twenty seconds, the Panthers trailed by three. It wasn’t until 2:26 left in the third quarter that the next score occurred, courtesy of Hauschka’s second field goal of the day. This means the Panthers led by four for fifteen minutes and fifty-four seconds. Russell Wilson threw the game-winning touchdown with 10:21 remaining, the final score of the day. This means for 7:05, the Seahawks trailed by a point, and then for 10:21, Seattle led by five points (following an unsuccessful two-point conversion attempt).

As it turns out, that gives us a Game Script of exactly 0.00. In other words, on average, this game was tied. Here’s how to do the math:

TmMarginDurationMargin*Duration
Seattle020.330
Seattle36.3319
Seattle-415.90-63.6
Seattle-17.08-7.1
Seattle510.3551.8
Average60.000

By comparison, the Jacksonville-Kansas City game was much more one-sided:

  • With 12:32 left in the first quarter, J.T. Thomas blocked Dustin Colquitt’s punt, which resulted in a Jaguars safety.
  • That lead lasted all of three minutes and twenty-three seconds, which is how long it took for Alex Smith to find Donnie Avery for a five-yard score with 9:09 left in the first.
  • Next, Smith connected with Junior Hemingway for a three-yard touchdown with 1:40 left in the first quarter.
  • With 6:29 left in the second quarter, Jamaal Charles punched it in for a short touchdown, bringing the score to 21-2.
  • The final score of the day was a Tamba Hali pick six of Blaine Gabbert, with 12:51 left in the fourth quarter.

[continue reading…]

{ 16 comments }

Yards per Carry and Points per Drive

I’ve written a couple of times about “yards per carry” as a key statistic to grade running backs. The usual argument in favor of using YPC is that a running back who rushes for 1200 yards on 300 carries is less valuable, all else being equal, than one who rushes for 1200 yards on 250 carries. But when it comes to running backs and yards per carry, “all else” is is never equal. Two players come to mind whenever yards per carry is cited for running backs: Eddie George and Curtis Martin.

From 1996 to 2002, George led the league with 2,421 carries. Only Martin (2,236) was within 300 carries of George. In NFL history, Eric Dickerson is the only player to ever record more carries during a player’s first seven seasons. But some would have you believe that George wasn’t very good during those seven years, because he averaged just 3.71 yards per carry. During that stretch, the Titans went 68-44, giving them the fourth best record in the NFL and the second-best mark in the AFC during that span. But, the yards-per-carry proponents would argue, Jeff Fisher didn’t know what he was doing when he kept handing the ball off to George, play after play, game after game, year after year.

In 1998, the Jets went 12-4 and earned a first-round bye; New York went 12-1 in Vinny Testaverde’s thirteen starts, and finished in the top five of the league in points, yards, and first downs. That season, Curtis Martin received 369 carries despite missing one game due to injury. Martin rushed 25+ times in seven games and recorded at least 17 carries in every game that year… and averaged only 3.49 yards per carry. There are some who would have you believe that the Hall of Fame head coach didn’t quite know what he was doing that year, and the Jets would have been even better had the team called Martin’s number less frequently.
[continue reading…]

{ 12 comments }

Instant Analysis: Jets top Tampa Bay in week 1

Jets BucsThirteen months ago, Tampa Bay head coach Greg Schiano said that he didn’t ever want to be the least penalized team in the league. I don’t think Sunday’s game was exactly what Schiano had in mind.

The Jets and Bucs battled in one of the closest games on Sunday, if not necessarily one of the most well-played ones. I was at the game, rooting on the home team, and can file this game under “all’s well that ends well.” While there are many takeaways from the game, the Bucs’ discipline problems will dominate discussion in Tampa Bay this week.

The Buccaneers looked unprepared at the start of the game and sloppy throughout. The Bucs were having some problems with Josh Freeman’s headset, which might explain why the team had to call timeout after an incomplete pass on the fourth snap of the game. But Tampa Bay followed that timeout with a delay of game (how?), which was followed by another delay of game (how??). That was followed by a sack, a false start, and then another false start.

The discipline problems continued throughout the game. Freeman wasn’t prepared for a Jeremy Zuttah snap, which resulted in a safety (and another penalty when Freeman kicked the ball out of the end zone). New Buc Dashon Goldson committed a brutal personal foul on Jets tight end Jeff Cumberland on one drive; on the next, the other safety, Mark Barron, was flagged for unnecessary roughness on an eight-yard pass to Jeremy Kerley on 3rd-and-21. That gave the Jets a first down, and let to New York’s only offensive touchdown of the game, a seven-yard throw from Geno Smith to ex-Buc Kellen Winslow.

Leading 14-12 in the fourth quarter, the Jets had 3rd-and-6 from their own 27. Smith couldn’t find anyone and ran out of bounds, but a defensive holding kept the drive alive (which led to a field goal). But despite all the penalties, Tampa Bay still managed to gain the lead in the game’s final minute. With 15 seconds remaining, the Jets had the ball at their own 45, a good 15-20 yards away from field goal range. Geno Smith scrambled and ran out of bounds with seven seconds left, placing the Jets at the Tampa Bay 45-yard line. But after the play, second-year linebacker Lavonte David was flagged for a personal foul, putting the Jets in field goal range. Nick Folk connected from 48 yards out, and David’s blunder is up there with Dwayne Rudd‘s helmet toss as the most costly penalties of the last 15 years.
[continue reading…]

{ 10 comments }
Spoiler: the quarterback plays a big role in passing yards.

Spoiler: the quarterback plays a big role in passing yards.

In May, I wrote that the scoring team is responsible for roughly 60% of the points it scores, while the opponent is responsible for 40% of those points. In other words, offense and defense both matter, but offense tends to matter more.

I was wondering the same thing about passing yards. When Team A plays Team B, how many passing yards should we expect? As we all know, Team A can look very different when it has Dan Orlovsky instead of Peyton Manning, so I instead chose to look at Quarterback A against Team B. Here’s the fine print:

1) I limited my study to all quarterbacks since 1978 who started at least 14 games for one team. Then, I looked at the number of passing yards averaged by each quarterback during that season, excluding the final game of every year. I also calculated, for his opponent, that team’s average passing yards allowed per game in their first 15 games of the season.

2) I then calculated the number of passing yards averaged by each quarterback in his games that season excluding the game in question. This number, which is different for each quarterback in each game, is the “Expected Passing Yards” for each quarterback in each game. I also calculated the “Expected Passing Yards Allowed” by his opponent in each game, based upon the opponent’s average yards allowed total in their other 14 games.

3) I then subtracted the league average from the Expected Passing Yards and Expected Passing Yards Allowed, to come up with era-adjusted numbers.

4) I performed a regression analysis using Era-Adjusted Expected Passing Yards and Era-Adjusted Expected Passing Yards Allowed as my inputs. My output was the actual number of passing yards produced in that game.
[continue reading…]

{ 10 comments }

Did you know these two are brothers?

Did you know these two are brothers?

John Harbaugh is a Super Bowl-winning head coach. He might represent the new archetype for owners when it comes to hiring a head coach. He outcoached his brother in Super Bowl XLVII. But that doesn’t mean his fourth down decisions on Thursday Night were above criticism.

1) Punting is not the way to beat Manning

Facing 4th and 5 from the Broncos 40-yard line, Harbaugh elected to punt up 14-7 with 8 minutes left in the second quarter. Last year, I highlighted one of the most difficult fourth down decisions coaches have to make: 4th-and-7 from between the 34- and 38-yard lines. In the thin air of Denver and with strong-legged Justin Tucker, we can safely include this scenario in that definition of No Man’s Land. Facing 4th-and-5 is a lot easier than 4th-and-7, so going for it would have been my preferred choice. The Ravens elected to punt, but let’s consider the other two options.
[continue reading…]

{ 4 comments }

The Ebb and Flow of the NFL Passing Game Since 1932

One of the two greatest quarterbacks of the first half of the 20th century

One of the two greatest quarterbacks of the first half of the 20th century.

The game played by Peyton Manning and Joe Flacco last night bears little resemblance to the game Sammy Baugh played. Teams pass much more frequently and efficiently than ever before. And there are external effects, too: In 2011 and 2012, the average carry went for 4.3 yards, the first two years the average has ever been so high. But the details are often lost when discussing how the game has changed, and today’s post will help to refine exactly how, and in what way, the game has changed.

Nine men have thrown for 4,900 passing yards in a season. Seven of them did so in either 2011 or 2012. How did we get here? The NFL has turned into a pass-heavy league, but these changes didn’t happen overnight: a series of rules changes since the berth of the league have promoted the pass-happy environment we see today. The first ever playoff game came in 1932, pitting the Chicago Bears against the Portsmouth Spartans, predecessors of today’s Detroit Lions. The game was scoreless until the fourth quarter, when Bronko Nagurski threw a controversial pass to Red Grange for the game-winning touchdown. The pass was controversial because in 1932, a player needed to be at least five yards behind the line of scrimmage in order to be eligible to pass. The league eliminated the rule after the game [1]There must be an inverse relationship between passing prowess and rule volatility, since it took the NFL twelve years to get rid of the Tuck Rule., allowing quarterbacks and other passers to be able to pass from anywhere behind the of scrimmage.

In 1934, a slimmer and more aerodynamic football was introduced to make life easier for quarterbacks. In the 1940s, most teams switched from the single-wing to the T-Formation, which placed the quarterback in the center of the offense and helped promote the passing game. Sammy Baugh in Washington and Sid Luckman in Chicago dominated the league, and the Redskins or Bears won the title every year from 1940 to 1943. During World War II, every franchise was playing with depleted rosters, so the league experimented with a rule change that would permit liberal substitutions. Finally, in 1950, the league finally decided to go with free substitution rules on a permanent basis. As pro football historian Sean Lahman explains:

For the NFL’s first three decades, versatility was the most important trait for a player. Your starting quarterback had to be quick enough to play safety, your running backs tough enough to play linebacker. The downside to this approach was that a player with one specific skill – say blazing speed – might not be enough of an all-around player to crack the starting lineup. With free substitution legalized, specialization became the norm…. Free substitution helped the passing game immensely because it allowed coaches to use quick players at offensive end who weren’t big enough to play defense. Their speed could be used as a weapon, and many teams moved to formations that featured three ends and just two backs.

The changes produced immediate results, and by 1954, the passing game had exploded. For the first time in league history, the league average completion percentage topped fifty-percent, and the average pass attempt gained 7.2 yards. By point of reference, teams averaged 7.1 yards per pass attempt in 2012.
[continue reading…]

References

References
1 There must be an inverse relationship between passing prowess and rule volatility, since it took the NFL twelve years to get rid of the Tuck Rule.
{ 25 comments }

Straight cash, homey.

Straight cash, homey.

In 1998, 21-year-old Randy Moss made a stunning NFL debut, racking up 17 touchdowns and 1,260 True Receiving Yards, the 2nd-best total in football that season. The Vikings’ primary quarterback that year, Randall Cunningham, was a former Pro Bowler and MVP, but all that seemed like a lifetime ago before the ’98 season. He’d been out of football entirely in 1996, and in 1997 he posted an Adjusted Net Yards per Attempt average that was 1.2 points below the league’s average (for reference’s sake, replacement level is usually around 0.75 below average). With Moss in ’98, though, Cunningham’s passing efficiency numbers exploded: he posted a career best +3.2 Relative Adjusted Net Yards per Attempt, miles ahead of his perfectly-average overall career mark. If we adjust for the fact that Cunningham was also 35 at the time (an age at which quarterbacks’ RANY/A rates tend to be 1.1 points below what they are at age 27), Cunningham’s 1998 rate was actually 4.3 points better than we’d expect from the rest of his career, a staggering outlier.

The following year, Jeff George took over as the Vikings primary quarterback, and he promptly posted a Relative ANY/A 2.2 points higher than expected based on his age and the rest of his career. [1]Cunningham’s RANY/A was also 1.0 better than expected in limited action. George left Moss and Minnesota after the season, and he would throw only 236 passes the rest of his career, producing a cumulative -0.6 RANY/A in Washington before retiring.

From 2000-04, Moss was the primary target of Daunte Culpepper, whose RANY/A was 0.7 better than expected (based on Culpepper’s career numbers) when Moss was around. [2]That number is an average weighted by the number of TRY Moss had in each season Although he’d enjoyed one of the best quarterback seasons in NFL history in 2004, Culpepper was never the same after Moss was traded to Oakland; in fact, he never even had another league-average passing season, producing a horrible -1.2 RANY/A from 2005 until his retirement in 2009. [3]To be fair, Culpepper tore his ACL, MCL, and PCL halfway through the 2005 season, which also was a factor in his decline.

Moss’s stint with the Raiders was famously checkered — although Kerry Collins’ RANY/A was 0.6 better than expected in 2005, Aaron Brooks played 2.5 points of RANY/A below his previous standards in 2006 — but we all know what happened when he joined the Patriots in 2007. With Moss, Tom Brady’s RANY/A was a whopping 1.3 points higher than expected from the rest of his career, and Moss also played a big role in Matt Cassel’s RANY/A being +1.0 relative to expectations after Brady was lost for the season in 2008.

While Moss’s post-Pats career hasn’t exactly been the stuff of legends, the majority of his career (weighted by True Receiving Yards) saw him dramatically improve his quarterbacks’ play relative to the rest of their careers. In fact, his lifetime WOWY (With or Without You) mark of +1.1 age-adjusted RANY/A ranks 3rd among all receivers who: a) had at least 3,000 career TRY, b) started their careers after the merger, and c) played exclusively with quarterbacks who started their careers after the merger. And the first two names on the list are possibly explained by other means. The table below lists all 301 receivers with 3,000 career TRY. The table is fully sortable and searchable, and you can click on the arrows at the bottom of the table to scroll. The table is sorted by the QB WOWY column.
[continue reading…]

References

References
1 Cunningham’s RANY/A was also 1.0 better than expected in limited action.
2 That number is an average weighted by the number of TRY Moss had in each season
3 To be fair, Culpepper tore his ACL, MCL, and PCL halfway through the 2005 season, which also was a factor in his decline.
{ 7 comments }

Emerging From the Shadows

In 2008, the tightest division in college football was the ACC Atlantic. All six teams finished either 5-3 or 4-4. Boston College started 2-3 in conference play, but won the division after winning at Florida State, at Wake Forest, and against Maryland in the last three weeks of the regular season. The Eagles were not a very talented team; this was the year after Matt Ryan left for the draft, and the offense underwhelmed in his absence. As you can probably guess, it was the team’s defense that guided them to the ACC Championship Game:

Boston College did not have good quarterback play, but made up for decreased offensive production with a top-notch defense, whose three shutouts tied U.S.C. for the most in the F.B.S. All told, the 2008 B.C. defense ranked among the best in program history, ranking in the top 10 nationally in total defense (fifth), rush defense (seventh), pass efficiency (seventh), first downs allowed (sixth) and interceptions (first). It carried the team through the travails of an often average offense.

And there was no question who was the star of the 2008 Eagles defense: junior linebacker Mark Herzlich. After such a dominant season, he could have declared for the draft and been a first round pick; instead, Herzlich chose to return for his senior season. Then, tragedy stuck in mid-May: Herzlich was diagnosed with Ewing’s Sarcoma, a malignant tumor usually discovered in bone or soft tissue. Here was Matt Hinton’s article after hearing the news:

Even for relatively diehard fans, it might have been possible to get through the last couple seasons knowing Mark Herzlich only as “the guy with the crazy facepaint,” but that would be missing the lead: The 6’4″, 240-pound Boston College linebacker was the defensive player of the year in a conference that had six defenders picked in the first two rounds [1]The list: Raji, Aaron Curry, Alphonso Smith, Ron Brace, Clint Sintim, and Everette Brown. of this year’s draft, and might have joined teammate B.J. Raji in the top-10 if he hadn’t decided to come back for his senior season at B.C.

And here was how Paul Myerberg described Herzlich in the summer of 2009:

His accolades are numerous: 2008 A.C.C. defensive player of the year, Butkus Award finalist, first-team all-A.C.C. and third-team all-American; these awards come as a result of his team-leading 110 tackles (13 for loss), 3 sacks, 6 interceptions and 8 pass breakups. As great an all-around linebacker as you’ll find on the F.B.S. level, Herzlich will be sorely missed on the field and in the locker room.

[continue reading…]

References

{ 1 comment }
Picture1

The consensus view on John Elway is clear. He was the greatest draft prospect ever, a league MVP, a two-time Super Bowl champion, a Hall of Famer, and one of the most clutch quarterbacks in football history.

But that’s not necessarily what the numbers say. In my quarterback ranking system, which rewards efficiency and longevity and adjusts for era, Elway only ranked as the 26th best regular-season quarterback of all time. If you’re so inclined, it’s not hard to find the numbers to argue that Elway – at least until Mike Shanahan returned to Denver as head coach in 1995 — was overrated. Consider:

  • Over the first 10 years of his career, Elway threw 158 touchdowns and 157 interceptions.
  • Elway never led the NFL in passer rating, completion percentage, touchdowns, yards per attempt, or Adjusted Net Yards per Attempt. Elway didn’t finish in the top ten in passer rating until his eleventh season in the league. In Net Yards per Attempt, Elway ranked in the top 10 just once from 1983 to 1994 (a first-place finish in ’87); in ANY/A, Elway’s only top ten finishes during his first ten seasons were in ’86 (10th) and ’87 (4th).
  • Elway ranks fourth all-time in passing yards, but that’s because he ranks fourth in career pass attempts. While he led the NFL in passing yards in 1993, Elway only finished in the top five in passing yards four times in his career: 1985 (2nd), 1987 (4th), 1990 (5th), and 1995 (5th).
  • Elway ranked 2nd in passing touchdowns in 1993, the only time he finished in the top 5 in that metric from 1983 to 1995. Despite throwing the fourth most pass attempts in NFL history, he ranks only 7th in passing touchdowns. In eight of sixteen seasons, including seven of his first ten years, Elway produced a below-average touchdown rate.

Here’s another interesting stat: from 1983 to 1992, the Broncos were slightly better on defense than offense. Over that time period, Denver’s Offensive SRS average was +1.01 while their Defensive SRS was +1.32. On average, the Broncos ranked 12th in points scored and 11th in points allowed. Those Denver teams are remembered as Elway’s teams — and perhaps rightly so — but the defense was just as valuable as the offense. [1]On the other hand, it’s worth pointing out that the ’83-’92 Broncos won more games than their Pythagorean record would have predicted, so perhaps Elway was responsible for more wins … Continue reading
[continue reading…]

References

References
1 On the other hand, it’s worth pointing out that the ’83-’92 Broncos won more games than their Pythagorean record would have predicted, so perhaps Elway was responsible for more wins than his passing numbers would indicate.
{ 99 comments }
Previous Posts