by Chase Stuart
on November 8, 2017
Today’s guest post comes from Miles Wray, a long-time reader of the site. He’s written an interesting post on special teams today, but you may know him as the host of the daily NBA podcast The 82 Review. You can also find him on Twitter @mileswray. What follows are Miles’ words: as always, we thank our guest writers for their contributions.
Bill Belichick Found Another Way to Bleed Yards From Opponents

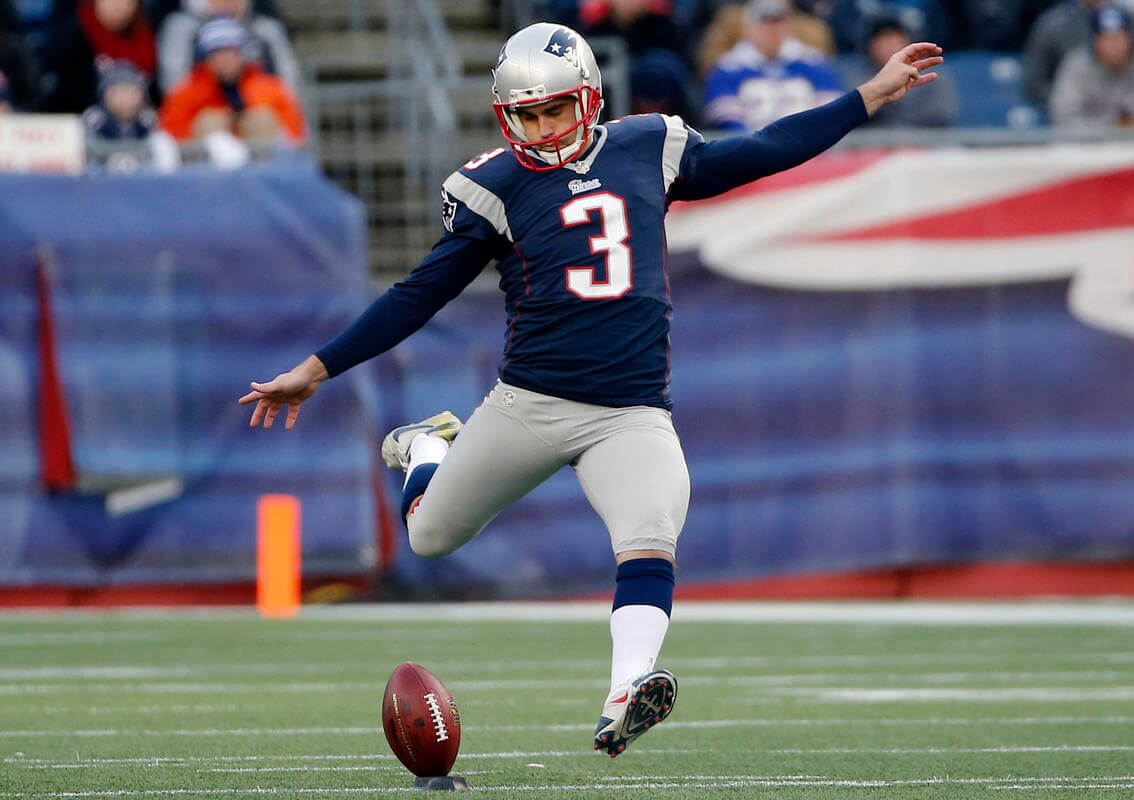
Gostkowski, probably not kicking a touchback
Anytime the New England Patriots are at the top — or the bottom — of a league-wide leaderboard, no matter how insignificant that leaderboard is, it’s worth taking notice. The odds are that
Bill Belichick and Ernie Adams are thinking a few steps ahead of every other team in the league, and are leveraging yet another corner of the game to their advantage.
Since the Patriots offense remains incredibly explosive, it’s pretty reasonable that they would be near the top of the league in the total number of kickoffs returned (i.e., opponent kickoff returns). New England has 47 kickoffs this year, or nearly double the number of a struggling offense like the Cleveland Browns (26). But how about this: the Patriots are dramatically ahead of everybody else in the league in the percentage of their kickoffs that are returned.
Since kickoffs were moved from the 30- to the 35-yard-line in 2011, it’s more common than ever to see a kickoff boomed out the back of the endzone. These plays have become so routine it’s basically part of the commercial break now. But not for the Patriots. The Patriots seem to be inviting their opponent to return their kicks.
I went through the kickoff statistics for each team in the league, and discarded any onside kicks, any short kicks in the last 10 seconds of the first half (which are often intentionally squibbed), and any kicks where the just-scored/kicking-off team had been penalized, moving the kickoff to the 30-, 25-, or 20-yard line. The remaining “clean” kickoffs give the best indication of a team’s intentional special teams strategy over time.
This season, most teams have about a third of their kickoffs returned. Only three teams have had over half of their kickoffs returned; the Patriots are alone at over 60%: [continue reading…]
Tagged as:
Guest Posts,
Kickers,
Patriots,
Special Teams
{ }
by Chase Stuart
on May 28, 2016
On Thursday, I looked at the quarterbacks with the most game-winning touchdown passes that came in the fourth quarter or overtime. Yesterday, I did the same for all touchdowns scored, either as a running touchdown, receiving touchdown, or otherwise. Three years ago, I looked at the same concept but for field goals: today, we revisit that post.
At the time, Morten Andersen was the career leader with 35, while Adam Vinatieri was hot on his trails with 30. Well, Vinatieri didn’t have a single game-winning field goal after the third quarter of any game in 2013 or 2014, but he then did it three times in two months last year (against Jacksonville in overtime from 27 yards, a 55-yarder against the Broncos with 6 minutes left, and a 43-yarder in the final minute against Atlanta.
Of his 33 game-winning field goals, 16 have been from 40+ yards away, with five of those being from 50+ yards, while his average game-winning field goal has come from 37.1 yards: [continue reading…]
Tagged as:
Field Goals,
Special Teams
{ }
by Chase Stuart
on March 24, 2016
Yesterday, the NFL approved a one-year rule to kickoffs to change the spot of the snap after a touchback to the 25-yard line. Last year, 56% of all kickoffs were not returned, and the average starting field position following kickoffs was heavily impacted by the 2011 rule change that moved kickoffs from the 30 to the 35 yard line:

This change goes in the other direction, albeit with competing interests. On one hand, this provides a significant incentive for kickoff returners to take a knee. Many kickoffs are boomed several yards into the end zone; at this point, the odds are pretty low that an average return five yards deep will make it out ahead of the 25-yard line. [continue reading…]
Tagged as:
Special Teams
{ }
by Chase Stuart
on October 7, 2015
The Indianapolis Colts won a game without Andrew Luck in week four, but that doesn’t mean the defense is any good or that the offense can survive without Luck. In fact, this was the rare game where the Colts got outplayed on both sides of the ball and still win. It sure helps to have two All-Pro specialists on the team.
Take a look at the boxscore from the game. The Colts won by 3 points, and PFR provides an expected points summary of many aspects of the game play. By definition, the sum of those values have to equal +3 for the Colts, and -3 for the Jaguars. On offense, the Colts were 3.57 points below average, and therefore, the Jaguars were 3.57 points above average on defense. Indianapolis had a similar performance on defense, where it was 3.23 points below average, and Jacksonville was 3.23 points above average. [continue reading…]
Tagged as:
Special Teams
{ }
by Chase Stuart
on September 8, 2015
Six years ago, I took my first crack at analyzing field goal kickers. I have been meaning to update that article for each of the last three offseasons, and with the sun setting on the 2015 offseason, I didn’t want to let this slip yet again.
Ranking field goal kickers is not difficult conceptually, but it can be a bit challenging in practice. One thing I’ve yet to refine is the appropriate adjustments for playing surface, stadium, time of game, temperature, and wind. That’s a lot of adjustments to deal with, all on top of the most obvious adjustment: for era.
But as I understand it, Rome was not built in a day; further, I believe that a journey of a thousand miles begins with one step. As a result, I’m okay with only getting part of the way there for now, and punting (which is very, very different from kicking) the rest of this process to next offseason.
Let’s begin with the obvious: era adjustments are really, really, important. To provide some examples, I looked at the field goal rates at four different increments: 22-24 yard kicks, 31-33 yard attempts, kicks from 40-42 yards away, and finally, field goal attempts from 49-51 yards. In the graph below, I’ve plotted the success rate at those four distances for each year since 1960, along with a “best-fit” curve at each distance. Take a look: [continue reading…]
Tagged as:
Kickers,
Special Teams
{ }
by Chase Stuart
on August 25, 2015
Yesterday, I looked at a new way to measure punting statistics. Let’s review by using the top single performance from 2014, which surprisingly came from Jets second-year punter Ryan Quigley in a 31-0 loss to San Diego. Yes, the Jets were terrible, but that doesn’t mean it was Quigley’s fault! He had 8 punts, and all but 1 was an above-average punt. Let’s review:
- Punt 1: Quigley punts from the Jets 39-yard line. On average, when a team punts at the 39, the opposing team takes over at the “78.9” yard line, which means just a hair in front of that team’s 21-yard line. Instead, Quigley pinned San Diego back to their 11; that 51-yard punt therefore provided 11.1 more yards of field position than we would expect.
- Punt 2 was a 44-yard punt from the Jets 29. On average, punts from the 29 pin the other team back at their 29.7 yard line. The 44-yarder had no return, giving San Diego the ball at their 27, so Quigley added 2.3 yards of field position over average.
- Punt 3 was from the Jets 20, so San Diego would have been expected to take over at their 38.4-yard line. Instead, following a whopping 64 yard punt, a 2-yard return, and 9-yard lost by San Diego due to an illegal block, and the Chargers were back at their own 9-yard line. That goes down as +20.4 for Quigley. Is it fair to give the punter credit when the return team loses yards on a penalty? I don’t know, although I’m not sure if that’s more or less fair than return yards that team gains (or yards the punting team loses due to a penalty). Think of these more as punt unit ratings than punter ratings, I guess.
- Okay, even I don’t have the energy to go through all 8 punts. But on the other 5, Quigley gained 16.8 yards over expectation, 11.9, 10.4, 10.2, and on one bad punt, -6.0.
[continue reading…]
Tagged as:
Punters,
Special Teams
{ }
by Chase Stuart
on August 24, 2015
Yes, you read that title right. Not only is today about punters, guess what? Tomorrow will be, too. Today, I want to dive into punting statistics. The two key numbers the media focuses on with punters are usually net punting average and gross punting average. But both numbers are pretty heavily influenced by field position. [continue reading…]
Tagged as:
Punters,
Special Teams
{ }
by Chase Stuart
on April 2, 2014
Two weeks ago, I looked at the best punt returners in NFL history; today, a look at the top kickoff returners. Again, we begin with a graph of the league average yards per kickoff return from 1941 through 2013. The variation here has been relatively minor, falling in a 5-yard window from 18.9 yards per return to 23.7.
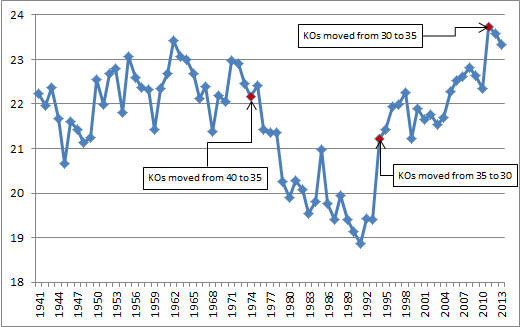 [continue reading…]
Tagged as:
Devin Hester,
Josh Cribbs,
Kickoff Returners,
Mel Gray,
Returners,
Special Teams
{ }
by Chase Stuart
on March 17, 2014
Six years ago, I wrote a series of posts looking at the best returners in NFL history. Today, I want to update that list by examining the best punt returners in NFL history. As with most statistics, yards per punt return has fluctuated throughout most of NFL history. The graph below shows the average in this metric from 1941 through 2013:
 [continue reading…]
Tagged as:
Devin Hester,
Punt Returners,
Returners,
Special Teams
{ }
by Chase Stuart
on September 20, 2013
So far this season, one thing is obvious: the NFL scheduled Thursday night games every week for the express purpose of screwing with people who do data analysis. Even though week three has started, I’m not ready to close the door on week two, in which nearly every game was competitive into the fourth quarter. But that doesn’t mean the game script for every game was close.
| Winner | | Loser | Boxscore | PF | PA | Margin | Game Script |
| Green Bay Packers | | Washington Redskins | Boxscore | 38 | 20 | 18 | 17.9 |
| Atlanta Falcons | | St. Louis Rams | Boxscore | 31 | 24 | 7 | 13.4 |
| Oakland Raiders | | Jacksonville Jaguars | Boxscore | 19 | 9 | 10 | 8.2 |
| Seattle Seahawks | | San Francisco 49ers | Boxscore | 29 | 3 | 26 | 7.7 |
| New England Patriots | | New York Jets | Boxscore | 13 | 10 | 3 | 6.4 |
| Denver Broncos | @ | New York Giants | Boxscore | 41 | 23 | 18 | 5.5 |
| Cincinnati Bengals | | Pittsburgh Steelers | Boxscore | 20 | 10 | 10 | 3.9 |
| Miami Dolphins | @ | Indianapolis Colts | Boxscore | 24 | 20 | 4 | 3.3 |
| San Diego Chargers | @ | Philadelphia Eagles | Boxscore | 33 | 30 | 3 | 3.2 |
| New Orleans Saints | @ | Tampa Bay Buccaneers | Boxscore | 16 | 14 | 2 | 2.2 |
| Houston Texans | | Tennessee Titans | Boxscore | 30 | 24 | 6 | 1.3 |
| Chicago Bears | | Minnesota Vikings | Boxscore | 31 | 30 | 1 | 1 |
| Kansas City Chiefs | | Dallas Cowboys | Boxscore | 17 | 16 | 1 | -0.1 |
| Baltimore Ravens | | Cleveland Browns | Boxscore | 14 | 6 | 8 | -0.8 |
| Buffalo Bills | | Carolina Panthers | Boxscore | 24 | 23 | 1 | -1 |
| Arizona Cardinals | | Detroit Lions | Boxscore | 25 | 21 | 4 | -1.3 |
Steven Jackson was injured early in his revenge game against the Rams (and is expected to miss two-to-four weeks), but consider: Atlanta had 45 pass attempts against just 16 running plays in a game in which their average lead was 13.4 points. And that was with a gimpy Roddy White! Last year, I noted that the Falcons were the most pass-happy team in the NFL after adjusting for game script, and it appears that the model hasn’t changed in 2013.
There weren’t any huge comebacks this week, a byproduct of all the competitive games. The Cardinals scored nine points in the fourth quarter to beat the Lions, in a game where Detroit’s offense was shut out in the second half. Matt Stafford and company gained just 90 yards and four first downs on 24 second half plays, enabling the Cardinals to steal a win. Half of the team’s six second half drives were three and outs, one was a fumble on the second play, and the final drive was five plays and ended on downs. The only successful drive of the half was a 51-yard march that put the Lions at the Cardinals 27, but David Akers’ field goal attempt was blocked.
But while the offense had an off day, there’s a hidden factor that explains why Detroit didn’t score more than 14 offensive points (DeAndre Levy intercepted a Carson Palmer pass for 66 yard touchdown, accounting for the other seven points).
[continue reading…]
Tagged as:
Average Field Position,
Cardinals,
Game Scripts,
Lions,
Special Teams
{ }