≡ Menu

Production Mattered More For OCs than DCs This Cycle

There will be 7 new head coaches in 2018, with Jon Gruden, Oakland Raiders (former HC, most recently at ESPN) joining three 2017 offensive coordinators and three 2017 defensive coordinators.

Offensive Coordinators

Matt Nagy, Chicago Bears (formerly KC OC; Chiefs ranked 4th in DVOA, 5th in my passing efficiency ratings, 4th in my rushing efficiency ratings, and 3rd in my offensive efficiency ratings).

Pat Shurmur, New York Giants (former MIN OC; Vikings ranked 5th in DVOA, 7th in passing efficiency, 19th in rushing efficiency, and 7th in offensive efficiency.

Josh McDaniels, Indianapolis Colts (former NE OC; Patriots ranked 1st in DVOA, 2nd in pass efficiency, 8th in rush efficiency, and 2nd in offensive efficiency [hire pending Super Bowl LII]

The Nagy and McDaniels hires speak for themselves: both coached top-5 offenses, and arguably top-3 offenses.  As for Shurmur, he coordinated an offense that was led by two undrafted free agents. Shurmur (9-23 with the Browns) and McDaniels (11-17 with the Broncos) each have previous coaching experience, while Nagy, who turns 40 in April, spent all of his 30s working under Andy Reid.

Defensive Coordinators
[continue reading…]

{ 5 comments }

In 2017, just 15 of the 352 starts (4.3%) by the New England Patriots came from rookies.  Just four rookies produced any points of Approximate Value for the 2017 Patriots: three defensive linemen (Adam Butler, Deatrich Wise Jr., and Eric Lee) combined to just 10 points of AV, with third-string TE Jacob Hollister gaining 1 point. No team got less out of rookies in 2017 than New England, which makes sense given that (a) New England did not have a first or second round pick, (b) the team had just four picks (with only Wise producing AV or a start), and (c) the Patriots had quality starters at most positions throughout the team, leaving few opportunities for rookies to steal playing time.

For the Eagles, rookies didn’t contribute much more. Kicker Jake Elliott, backup CB Rasul Douglas, backup RB Corey Clement, and DE Derek Barnett (the team’s first round pick who played on 41% of snaps) each produced 3 points of AV, the most for any Eagles rookie. Linebackers Joe Walker and Nathan Gerry, and wide receiver Mack Hollins, each had two points of AV, with third-string QB Nate Sudfeld and backup OL Elijah Qualls bringing one point of AV.

Rookies produced only 8% of the AV by all Philadelphia players this year. Yes, every player is valuable, but compared to the rest of the NFL, the Super Bowl participants — again — didn’t get much from rookies.

The table below shows the percentage of team AV that came from rookies for all teams this year. The Saints were the only team in the top 5 that made the playoffs, although the Bills, Jaguars, and Chiefs also saw substantial contributions from rookies. [continue reading…]

{ 5 comments }

Ed Feng of The Power Rank has contributed today’s post. As always, we thank our guest contributors for their hard work.


Before Super Bowl XXV, Bill Belichick had a plan. The Giants defensive coordinator wanted his defense to let Bills running back Thurman Thomas rush for 100 yards.

The Giants defense was appalled. They prided themselves on a tough, physical brand of defense.

Nevertheless, the short, stout coach looked up into the eyes of Lawrence Taylor and Pepper Johnson and said, “You guys have to believe me. If Thomas rushes for a hundred yards, we win this game.”

In case his defense didn’t listen, Belichick took it upon himself to make sure Thomas got his yards. He took out a lineman and linebacker for two extra defensive backs, playing a 2-3-6 defense.

Did Belichick go insane? I thought so when I first read this story in David Halberstam’s book Education of a Coach.

However, Belichick’s strategy has analytics on its side. Let me explain. [Editor’s note: See also this article by Chase about Super Bowl XXV.] [continue reading…]

{ 35 comments }

The New Patriots Dynasty and Its Core Four

The lone holdover on the last two dynasties in the NFL.

From 2001 to 2004, the Patriots won three out of four Super Bowls, which was widely considered to form a dynasty. Sure, New England missed the playoffs in ’02, but the Patriots matched the ’90s Cowboys by winning three Super Bowls in just four seasons.

Well, the Patriots have been so good since then that it’s sometimes hard to realize that the Patriots are on the verge of forming another dynasty. After all, with a win in Super Bowl LII, New England will join the ’01-’04 Patriots and the ’92-’95 Cowboys as the only teams to win three Super Bowls in four years.

Which, you know, is pretty remarkable.

Also remarkable? Just four players in this run — QB Tom Brady, safeties Devin McCourty and Patrick Chung, and tackle Nate Solder — played in at least 40% of Patriots regular season snaps in 2014, 2016, and 2017.  The table below shows the percentage of offensive or defensive snaps by each player on New England in 2014, 2016, and 2017. [continue reading…]

{ 7 comments }

Super Bowl Squares: How To Win During Super Bowl LII

Three years ago, I wrote a detailed breakdown about Super Bowl squares. Well, it’s that time of year again, so I’m going to repost that article here to help you cheat to win at your Super Bowl party.

Every Super Bowl squares pool is different, but this post is really aimed at readers who play in pools where you can trade or pick squares (surely no pool has a prohibition on this!) I looked at every regular season and postseason game from 2002 to 2013. [1]Yes, this means your author was too lazy to update things for the 2014, 2015, or 2016 seasons. I suppose the rule change moving back the extra point would probably change things ever so slightly, … Continue reading The table below shows the likelihood of each score after each quarter, along with three final columns that show the expected value of a $100 prize pool under three different payout systems. The “10/” column shows the payout in a pool where 10% of the prize money is given out after each of the first three quarters and 70% after the end of the game; the next column is for pools that give out 12.5% of the pool after the first and third quarters, 25% at halftime, and 50% for the score at the end of the game. The final column is for pools that give out 25% of the pot after each quarter — since I think that is the most common pool structure, I’ve sorted the table by that column, but you can sort by any column you like. To make the table fully sortable, I had to remove the percentage symbols, but “19, 6.7, 4.1, 2” should be read as 19.0%, 6.7%, 4.1%, and 2.0%. [continue reading…]

References

References
1 Yes, this means your author was too lazy to update things for the 2014, 2015, or 2016 seasons. I suppose the rule change moving back the extra point would probably change things ever so slightly, given the small increase in missed extra points.
{ 1 comment }

After the 2015 season, there were seven new head coaching hires. All seven were offensive head coaches, as part of a three-year coaching sandwich that focused on one side of the ball.

  • Adam Gase to the Miami Dolphins was one of three high-profile hires.  But after a strong first season, the shine has worn off in South Beach. Gase’s Dolphins struggled everywhere except the scoreboard for awhile, but after a 6-10 season in year two, Miami looks no closer to finding long-term success than it was prior to Gase.
  • Another sexy hire was Hue Jackson to Cleveland, who was also the lone minority hire from 2014-2015. Unfortunately, Jackson has been hired to be the Browns head coach as many times as he’s won games as the Browns head coach.
  • After being fired by the Eagles, Chip Kelly still landed in San Francisco as a high-profile hire. Of course, he flamed out quickly, going 2-14 in his lone season with the 49ers. He’s now the UCLA head coach after taking the 2017 season off from coaching.
  • The New York Giants promoted Ben McAdoo from offensive coordinator to head coach; that went well for a year, but McAdoo couldn’t even last a full two years despite making the postseason in year one
  • Dirk Koetter joined McAdoo as offensive coordinators that were promoted to take over for fired head coaches. Koetter, like Gase and McAdoo, was much better in year one than in year two. He wasn’t fired, but a 4-11 start in 2017 put him on the hot seat.
  • Mike Mularkey went 2-7 as the Titan’s interim head coach in 2015, and then somehow got the fulltime job.  After an impressive 2016 and an up-and-down 2017, Mularkey’s Titans made the playofs…. but he was still fired after the season, to make room for Mike Vrabel. Random factoid that may only interest me: three of the last four Tennessee coaches were named Mike, and in the last 30 years, all Titans coaches have been named Mike, Ken, Jeff, Jack, or Jerry.

[continue reading…]

{ 19 comments }

Nick Foles is no stranger to great games. He has the greatest passing game in Eagles history, recorded on November 3rd, 2013 against the Raiders. Foles completed 22 of 28 passes for 406 yards and 7 touchdowns, with just one sack for one yard and zero interceptions. That translates to a whopping 18.79 Adjusted Net Yards per Attempt.

We can adjust that result for both era and quality of defense: Oakland’s pass defense was bad that season, allowing 7.41 ANY/A to opposing passers, but even still, that means Foles still averaged well over 11 more ANY/A against the Raiders than the average passer that season. Over the course of his 29 dropbacks, Foles provided 330 ANY above expectation, easily the best game in Eagles history. In fact, it’s one of just eight games since 2002 with over 300 ANY over expectation, joining three Peyton Manning games (against the Broncos in both the ’03 and ’04 playoffs, and with the Broncos against the Ravens in the 2013 Kickoff Classic), two Ben Roethlisberger games (Packers 2009, Colts 2014), and performances by Drew Brees (Patriots, 2009) and Kurt Warner (Packers, 2009 playoffs).

But then, against the Vikings, Foles had another masterpiece. And what made this one particularly special was that it came against a really good Minnesota defense. During the regular season, the Vikings allowed just 4.57 ANY/A, second best in the NFL. But in the NFC Championship Game, Foles was 26 for 33 for 352 yards with 3 TDs and no interceptions, with one sack for six yards. That translates to 406 Adjusted Net Yards on 34 dropbacks, or 11.94 ANY/A. That is 7.37 ANY/A above what the average opposing QB produced against the Vikings during the regular season; over the course of 34 dropbacks, that translates to 250 Adjusted Net Yards of added value.
[continue reading…]

{ 27 comments }

Super Bowl Betting History

Super Bowl LII features the New England Patriots and the Philadelphia Eagles. The Patriots are favored by 5 points (the line opened at NE -5.5) and the over/under is 48 points. There have been 51 prior Super Bowls, so how do those lines compare?

  • On average, the point spread has been 6.9 points with an over/under of 44.2 points. The average final score? Winning team 30.2, losing team 16.1. In the Patriots era (i.e., 2001-2016), the average spread has been 5.4 points, with an over/under of 48.4 points, nearly perfectly matching this year’s numbers.
  • Underdogs are 16-34 straight up in Super Bowls (the Seahawks/Patriots Super Bowl line was a push). The last 8 Super Bowl champions all covered the spread, in part because of low lines (none higher than 5 points) and in larger part because four of the last five Super Bowl champions were underdogs. Overall, underdogs are 22-26-2 against the spread.
  • There have been just six Super Bowls where the spread mattered (i.e., the underdog covered the spread but still lost): Steelers/Cowboys in ’75, 49ers/Bengals in ’88, Cowboys/Steelers in ’95, Patriots/Panthers in 2003, Patriots/Eagles in 2004, and Steelers/Cardinals in 2008.
  • The “over” has hit in 4 of the last 5 games, bringing the Over’s mark to 27-24 overall.

The table below shows the full results. [continue reading…]

{ 27 comments }

In the regular season, Marcus Mariota threw 13 touchdown passes, Blake Bortles threw 21 touchdown passes, and Nick Foles threw 5 touchdown passes. If the Patriots win Super Bowl LII, New England will have done so by beating teams starting quarterbacks who threw just 39 touchdown passes in the regular season.

How unusual is that? Well, no Super Bowl champion has faced quarterbacks in the playoffs who threw fewer than 40 touchdowns since 1982, which was the year the regular season was shortened to 9 games by the player strike.  Washington faced four quarterbacks who combined for 38 touchdowns in the regular season; that’s an average of 9.5 per team, but on a per-16 team game basis, those quarterbacks still averaged 16.9 touchdowns.

If we look at things on a per team and per-16 team game basis, the Patriots opposing QBs — who threw for 13 TDs per team per 16 team games — would be the third lowest in history, and the lowest since 1979. [continue reading…]

{ 14 comments }

Super Bowl LII Notes and Trivia

The matchup for Super Bowl LII is set. The 13-3 New England Patriots will be facing the 13-3 Philadelphia Eagles in Minneapolis, Minnesota in two weeks.

  • This is a matchup of the two #1 seeds, which is starting to become a thing again. The 1993 Bills/Cowboys was the last matchup of #1 seeds in the Super Bowl for a long time, until the 2009 Colts/Saints game. From ’94 to ’12, that was the only matchup of #1 seeds in the Super Bowl, but since then, it happened in 2013 (Seahawks over Broncos), 2014 (Patriots over Seahawks), 2015 (Broncos over Panthers) and now 2017.
  • For the 8th time, Tom Brady, Bill Belichick, and the New England Patriots are going to the Super Bowl. Remarkably, Brady has made the Super Bowl in half of his 16 seasons as the Patriots starting quarterback. He will, of course, extend his own record by playing in his eighth Super Bowl: no player has made seven, while Mike Lodish and Don Beebe each made six (Lodish played in all six; Beebe played in three).

Brady has made the Super Bowl in half of his seasons as a starter; the other seasons haven’t been so bad, either:

[continue reading…]

{ 17 comments }

Conference Championship Sunday: Live Blog

There are only three games left this season, and two of those are taking place today. So I’ll be turning the site today into a live blog with posts throughout the game, starting at 3pm.

11th Super Bowl Appearance for Bill Belichick

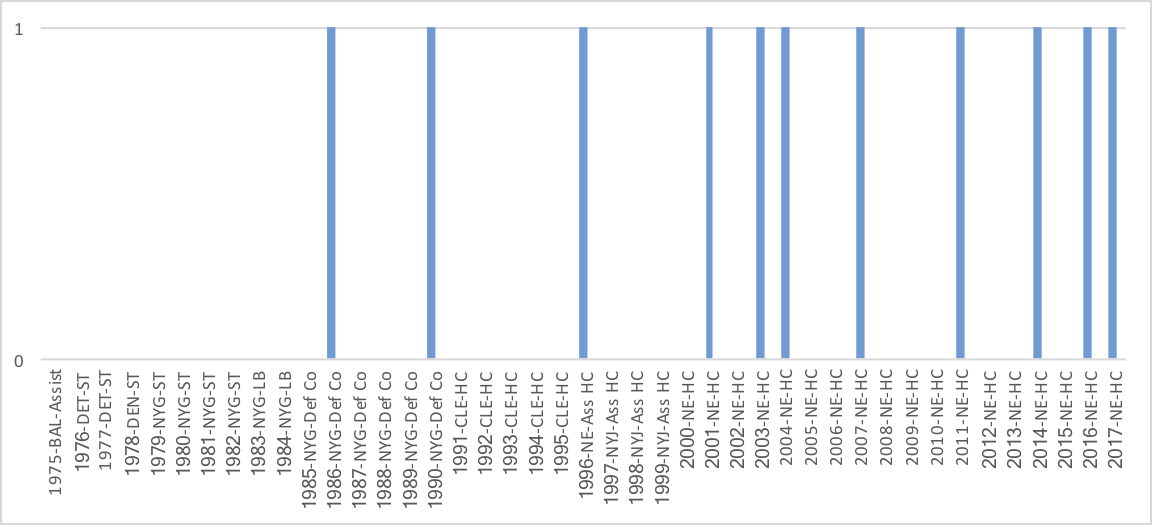
This will be the 11th Super Bowl appearance for Bill Belichick, which is of course a record for a coach or player or owner. The graph below shows the number of Super Bowl appearances for Belichick by year:


Tommy U?

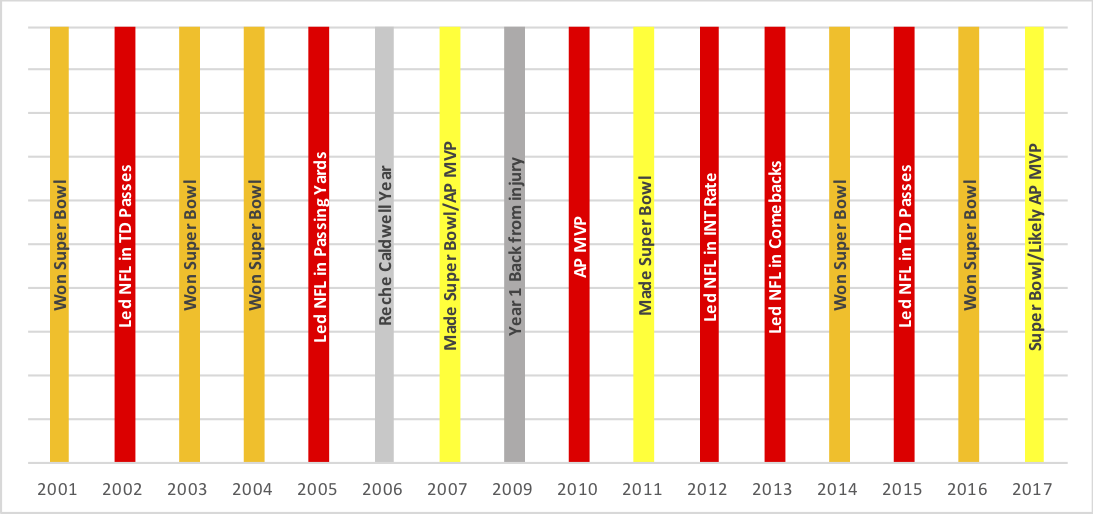
The last QB to lead the NFL in passing and win the championship in the same season was Johnny Unitas in 1961. That’s right: no quarterback in the Super Bowl era has ever done that. But Tom Brady beat Philip Rivers (by 62 yards) to win the passing yards crown for the third time in his career (’05, ’07).

If Brady wins the Super Bowl and the AP Most Valuable Player award, he’ll also be the first quarterback to do that in the same season since Kurt Warner in 1999. After Matt Ryan last season and Cam Newton in 2015, AP MVPs have made 8 of the 17 Super Bowls since then, but are 0-8 in those games (despite being favored in 6 of those 8).

6:15 Update

There was a 9-year stretch where the Brady/Belichick Patriots didn’t win any Super Bowls, but now the Brady/Belichick Patriots are on the verge, for the 2nd time, of winning 3 Super Bowls in 4 years.

5:35 Update

Great drive by Brady and the Patriots, overcoming a 3rd-and-18 and no Gronk to drive down for a touchdown.

The Jaguars can’t just run the clock out. With 8:44 left, and clinging to a 3-point lead, Jacksonville can’t deploy the Bills game end-game strategy again and expect to win.

5:05 Update

Much of the story today can be explained via third down conversions. The Patriots are just 1-for-8 on third down, while the Jaguars are 6-for-10. On the other hand, field position is starting to turn New England’s way. Field position had been even, but Jacksonville’s second drive of the second half started at the 10, after a 3-and-out the Patriots drive started at the 46, and then even after a 3-and-out, NE was able to pin Jacksonville down to its own 9.

After an ugly first down play, Jacksonville has now recovered and is driving. A big third down conversion from Bortles just now.
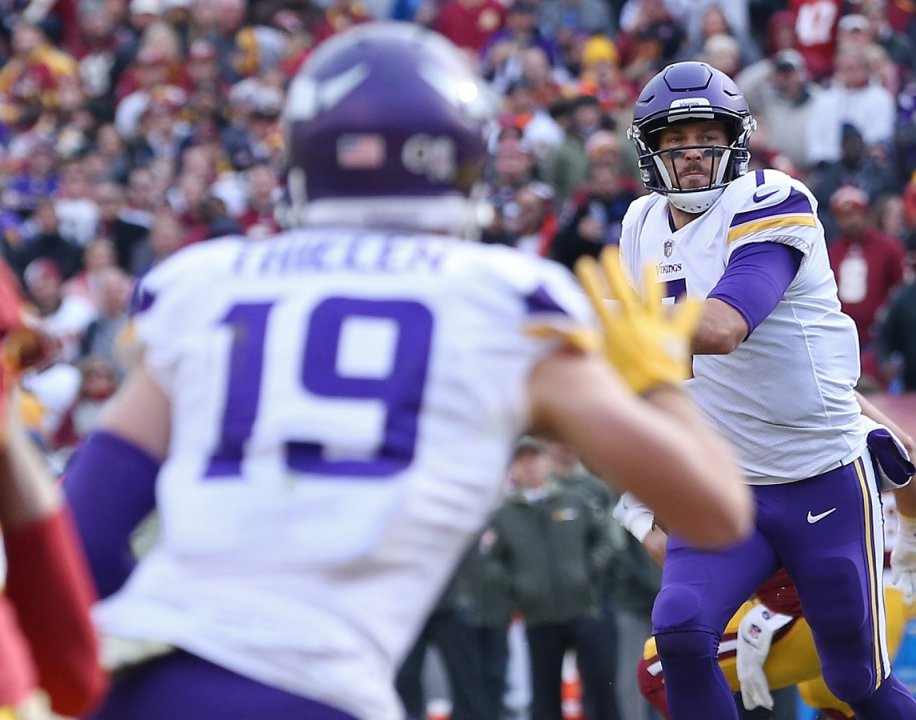
Keenum and Foles

Nick Foles and Case Keenum both entered the NFL in 2012, and both have started just under 40 games in the regular season. Of the 34 passers with 1,000 attempts since 2012, Foles ranks 18th in ANY/A while Keenum ranks 25th.

But while Foles has a slightly higher ANY/A average (6.22 to 5.99), the players obviously got there in very different ways. The graph below shows their career ANY/A average after each week of each season since 2012.

Also, Keenum has started 14 regular season games for both the Rams with Jeff Fisher and the Vikings. The splits are, well, remarkable:

Passing Table
Yrs Age Tm G GS QBrec Cmp Att Cmp% Yds TD TD% Int Int% Lng Y/A Y/C Y/G Rate Sk Yds NY/A ANY/A Sk%
2 yrs 27-28 RAM 16 14 7-7-0 272 447 60.9 3029 13 2.9 12 2.7 65 6.8 11.1 189.3 79.5 27 168 6.04 5.45 5.7
1 yr 29 MIN 15 14 11-3-0 325 481 67.6 3547 22 4.6 7 1.5 65 7.4 10.9 236.5 98.3 22 136 6.78 7.03 4.4

4:00 Update

Based on my efficiency ratings, the Patriots defense ranked 21st against the pass, 30th against the run, and 26th overall. New England’s defense ranked 5th in points allowed, but that was always highly misleading.

The Jaguars have 13 first downs on three drives and have 14 points. The Jaguars offense also has been underrated (it ranked a misleading 5th in points scored, but it was no worse than an average offense despite being referred to by many as a liability), but looks outstanding today. The short of it? Jacksonville’s offense has feasted on bad defenses this year, and they are doing that again today.

3:40 Update

The Patriots defense was bad this year, particularly at preventing first downs. Jacksonville now has 7 first downs through two drives, after a 7-play, 5-first down, 76-yard drive for a touchdown.

Bortles looks pretty good, and the Patriots defense looks pretty bad.

3:30 Update

The Jaguars are underdogs today (although on paper they may be the better team). But an underdog wants to limit possessions as part of a David strategy. So far, that seems to be going okay for Jacksonville — the first three drives for these teams took over 12 minutes, as there were just two incomplete passes.

3:10 Update

Pats choose to go for it on 4th-and-2 from the 30 on the first drive of the game. This feels like the right call, given that a field goal is not a given.

Brady throws a lob pass to Amendola on a wheel route for a 20-yard pickup.

3:00

Only four teams since 1978 have won multiple playoff games despite being a touchdown underdog.

The Tom Coughlin-led 2007 Giants won three such games, including a win in the Super Bowl over the Brady/Belichick Patriots.

The Coughlin-led 1996 Jaguars were the first team to win two such games; the Brady/Belichick 2001 Patriots were the second, and the 2012 Ravens — including a win over the Brady/Belichick Patriots — were the third.

Jacksonville won as a 7-point underdog in Pittsburgh last week, and is a 7.5-point underdog today in Foxboro.

Pre-Game Thoughts

As for now, what are your predictions?

If I had to rank the eight units we are going to see today, I would go:

Tier 1:

Jaguars defense

Vikings defense

Patriots offense

Tier 2:

Eagles defense

Tier 3:

Vikings offense

Tier 4:

Jaguars offense

Tier 5:

Patriots defense

Tier 6:

Eagles offense

As for the head coaches, the Patriots have the clear advantage, while the Eagles May have a slight advantage. New England and Philadelphia are arguably the less talented teams but are at home, which means this should be two great games.

My predictions:

Jacksonville 24, New England 20

Philadelphia 17, Minnesota 16

{ 5 comments }

Carson Wentz was the Eagles quarterback for the first 13 games of the season, but after tearing his ACL in his left knee, Nick Foles has taken over as the Philadelphia starting quarterback.

In Minnesota, Sam Bradford started the opening game of the season, but missed the next month of the season with a knee injury. Bradford then surprisingly started a week 5 game against the Bears but was not himself; he aggravated his knee during that game, and has not played since. In his absence, Case Keenum has had a remarkably productive season, and now the Vikings and Eagles are facing off in the NFC Championship Game.

That means this will be the first conference championship game in NFL history featuring two starting quarterbacks who were not their team’s starting quarterbacks in week 1 of the regular season.

In fact, in the last 10 years, just three teams have made the conference championship game with backup quarterbacks, and two of those instances have asterisks. The Steelers and Patriots made the AFCCG in years where their starting quarterbacks began the year on the sidelines due to suspension, making Ben Roethlisberger and Tom Brady backup quarterbacks in name only. [continue reading…]

{ 8 comments }

You will not be surprised to learn that the Patriots led the NFL this season with 389 first downs. That’s the 9th most since 2002, and New England has three other teams ahead of the 2017 version. The Patriots offense is always great in large part because the Patriots always pick up a ton of first downs.

The graph below shows the number of first downs for each team this season.  The Jaguars, perhaps surprisingly, ranked tied for 7th with a Saints offense that was much better:

The Jaguars allowed just 257 first downs, the fewest in the NFL. [continue reading…]

{ 6 comments }

Calais Campbell had 16 points of AV while playing with the Arizona Cardinals in 2016. He signed a monster four year, $60 million contract with $30 million guaranteed with the Jaguars in the first week of free agency. But this didn’t prove to be a massive overpay of an aging veteran. On the contrary, Campbell has been a revelation and Defensive Player of the Year candidate; for the second year in a row, he produced 16 points of AV in 2017.

Andrew Whitworth had a similar pedigree but was in a slightly different situation. he signed a contract with the Rams after a decade of strong play with the Bengals. Whitworth received Pro Bowl or some All-Pro recognition in 2014, 2015, and 2016, but at 36, he wasn’t the sought after free agent that Campbell was. But Whitworth, who signed a 3-year, $33.75M contract, managed to exceed expectations in his first year in Los Angeles. Whitworth was the left tackle for the highest scoring offense in the league and was the plurality choice at first-team All-Pro left tackle by the AP.

And then there is Case Keenum. He signed a one year, $2 million contract with the Vikings on April 4 to almost no fanfare. Now? Keenum is starting in this year’s NFC Championship Game.

The table below shows the leaders in AV in 2017 among players who were on different teams in 2016. [continue reading…]

{ 2 comments }

2017 Approximate Value Released

With the All-Pro votes now in, the initial 2017 Approximate Value numbers have been released by PFR. Thanks to the tireless work of Mike Kania and the P-F-R staff, PFR has now generated the Approximate Values for every player in the NFL this year. For the uninitiated, you can review how AV is calculated here. And if you’re so inclined, you can thank Mike and/or the PFR staff on twitter.

Here are your leaders: [continue reading…]

{ 15 comments }

The playoffs. Less than two minutes to go. You need a score to win, but you’re far away from the end zone. And then a miracle happens.

There have been just 8 touchdowns in NFL playoff history that meet the following four criteria:

  • The touchdown came in the final two minutes of regulation or at any point in overtime;
  • The touchdown was at least 50+ yards;
  • The touchdown tied or gave the team the lead;
  • The touchdown was scored by the winning team.

Here are those eight scores. [continue reading…]

{ 15 comments }

Drew Brees Loses Another Playoff Game Drew Brees Style

In his first playoff game, Drew Brees threw a game-tying touchdown pass to Antonio Gates with 11 seconds remaining to force overtime against the Jets. In overtime, Brees and the Chargers drove 48 yards down the field, and converted two third downs, to set up a game-winning 40-yard field goal. Unfortunately for Brees, Nate Kaeding missed the kick, and the Jets won in overtime.

In his second playoff game, Brees had an efficient performance in a win over the Eagles. The next week, New Orleans faced an excellent Bears team in frigid conditions in Chicago. Brees’ teammates lost two fumbles, rushed for a total of 48 yards, and allowed 37 points in an NFCCG loss.

Brees’ next three playoff games were all in 2009, when he threw 8 touchdowns and no interceptions as the Saints won the Super Bowl.

His next playoff game? That was the BeastQuake game when Marshawn Lynch rumbled for a 67-yard touchdown in the 4th quarter. The Saints lost 41-36, despite Brees throwing for 404 yards and 2 touchdowns with no interceptions.  This would not be the last time Brees would lose a game despite his team scoring over 30 points.

The next playoff game of his career was his best, at least statistically.  Even with era and defensive adjustments, it ranked as one of the 10 best passing games in postseason history: He threw for 466 yards and 3 TDs on 43 attempts in a 45-28 win over the Lions.

The next week Brees lost in one of the classic games in modern postseason history. Take a look at the boxscore:

This was the first game in playoff history with four lead changes in the final five minutes. Brees had a monster game against a great 49ers pass defense, and gave his team the lead in the final two minutes. Alas, that was not enough. This would not be the last time that would happen, either.

Two years later, Brees and the Saints won in Philadelphia as underdogs. This was, statistically, the worst playoff game of his postseason career. On the other hand, he and the Saints were a dome team playing a night game in Philadelphia in freezing conditions, and after a rough first half, the Saints scored two touchdowns and two field goals in five second half possessions. On the final drive, he picked up two first downs to set up the game-winning field goal.

The next week wasn’t good: he was 24/43 for 309 yards and 1 TD which oh wait it was against the 2013 Seahawks. In Seattle. So yeah, that was a pretty good game in a losing effort.

That brings us to 2017. In the first round of the playoffs, Brees went 23/33 for 376 yards and 1 TDs in a 31-26 win over Carolina. And then yesterday against the Vikings? After a miserable first half, Brees and the Saints scored three touchdowns on the team’s first four drives of the second half. The final touchdown put New Orleans ahead by 1 point with 2:20 to go.

Minnesota answered with a 9-play, 40-yard drive that culminated with a 53-yard field goal. New Orleans got the ball back, down 2 with 89 seconds left and one timeout, and drove 50 yards for the field goal. The Saints took a 24-23 lead with 25 seconds remaining.

With 10 seconds remaining, the Vikings had the ball at their own 39 yard line with no timeouts left. And then this happened:

Well, this happened:

One of the greatest plays in playoff history. An instant classic. And yet, once again, Brees was left holding the short straw. Does this boxscore look familiar?

There have been two games in NFL postseason history with four lead changes [1]I am excluding ties, but if you include them, only one other game gets in there. in the final five minutes. And Brees was on the losing end in both of them.

As a reminder, in 13 playoff games:

  • The other team has scored 28+ points 6 times, and Brees is 2-4 in those games This includes the only two games in playoff history with four lead changes in the final five minutes and the BeastQuake game where the Saints scored 36 points.
  • Brees’ teams are 5-2 when the opponent scores under 28 points. The two losses include a game against one of the best pass defenses in NFL history and a game where his kicker missed a 40-yard field goal in overtime.
  • The average score of a Drew Brees playoff game is 28.8 to 26.8. While with the Saints, that jumps to 29.8 to 27.4.

In the last 10 postseasons, there have been 27 games with at least 56 points combined (i.e., an average of 28 points per team). Brees’s Saints have been involved in six of those 27 games. Keep in mind that there have been 214 playoff games over that stretch, and New Orleans has only been in 10 of them.

That means 60% of all Drew Brees playoff games see 56+ points scored, compared to 10% of all other games.

Brees is one of just four quarterbacks with a career passer rating in the playoffs over 100 and has averaged 324 passing yards per game in the playoffs, easily the most of all time. His stat line — 354/537, 4,209 yards, 29 TDs, 9 INTs, 100.7 passer rating, 22 sacks — looks like that of an MVP candidate, especially when you consider that’s in only 13 games. Pro-rated to 16 games, and it’s 5,180 yards with 36 TDs and 11 INTs on 661 attempts. Those are nearly identical to the numbers he put up in an MVP caliber 2013 season.

In other words, Drew Brees in the playoffs plays like the best version of Drew Brees in the regular season, which is pretty darn incredible. But what’s even more incredible is the string of events that have left him with just a 7-6 record. For that 7-6 record, he can thank Kaeding, Lynch, Vernon Davis, Stefon Diggs, and going up against two of the best defenses of the last 15 years.

References

References
1 I am excluding ties, but if you include them, only one other game gets in there.
{ 116 comments }

The Patriots Season Begins Now

Belichick checks to see if it’s AFCCG time yet

There’s no denying that New England is the greatest regular season team in modern NFL history. From 2001 to 2017, the Patriots have had a 0.768 winning percentage in the regular season; that’s over 10% higher than the second-best team, the Steelers at 0.660.

That’s also the best winning percentage over any 17-year period in history, better than the 1946-1962 Browns (an AAFC-aided 0.756), the 1933-1949 Bears (0.749), and the 1966-1983 Raiders (0.743).

Oh, and the last 8 years? The Patriots have won 80% of their games, the best of any NFL team in any 8-year stretch (the AAFC-aided Browns posted a 0.865 winning percentage from 1946-1953). More incredibly, the Patriots are now going to their 7th-straight AFC Championship Game.

Since losing to Mark Sanchez and the Jets in the Division Round of the playoffs to end the 2010 season, the Patriots have: [continue reading…]

{ 15 comments }

Will Any Backup Quarterbacks Play This Weekend?

On Monday night, Alabama head coach Nick Saban added to his already remarkable legacy with an aggressive coaching decision.  In the national championship game, Saban benched starting quarterback Jalen Hurts — a player who the team was 25-2 with under center and who had thrown one interception in his last 16 games — at halftime of the national championship game. With the Crimson Tide down 13-0, Saban inserted true freshman Tua Tagovailoa into the game, and a couple hours later, Alabama was again national champions and Tagovailoa was the offensive player of the game.

Will any head coach do that this weekend? On the surface, there are three obvious candidates, and four obvious “not gonna happen” situations.

The most concerning quarterback situation is in Philadelphia, where Nick Foles is the starter after Carson Wentz was lost for the season.  If Foles struggles the way he did the last two weeks of the regular season, you can see why the Eagles would consider making a similar switch. [continue reading…]

{ 7 comments }

Something was missing from the 2017 season: a quarterback who threw a lot of interceptions but also threw for a lot of yards. At a basic level, you might assume that these two statistics would be inversely related. After all, a bad quarterback would throw a lot of interceptions and not throw for a lot of yards, while a good quarterback shouldn’t throw many interceptions but should throw for a lot of yards.

But in a competitive environment, such absolutes rarely hold up. Some quarterbacks will have to be aggressive to be effective (high average yards per pass but also a high interception rate), while some will choose to be conservative (low average yards per pass but also a low interception rate). But in 2017, we missed that. For example:

  • Marcus Mariota ranked had the 4th worst (i.e., highest) interception rate and ranked 14th in net yards per attempt. By 2017 standards, that stands out as aggressive.
  • The quarterbacks who 5th-through-8th in interception rate all ranked below-average in net yards per attempt.  Again, these quarterbacks were not necessarily very aggressive, just not very good.
  • Ben Roethlisberger (12th worst interception rate, 7th best net yards per attempt average), Derek Carr (10th, 15th), Blake Bortles (14th, 12th), and Jameis Winston (13th, 8th) join Mariota as the only passers to rank in the bottom 15 in interception rate and top 15 in net yards per attempt.

Conversely, Tom Brady, Jared Goff, Drew Brees, and Alex Smith all had very low interception rates and very high net yards per attempt averages, with all four ranking in the top 7 of both metrics. Philip Rivers ranked 2nd in NY/A and 9th in interception rate. Case Keenum ranked 4th in interception rate and 10th in NY/A.

Really, the only two outliers when it came to great interception rates were Tyrod Taylor (1st in interception rate, 25th in NY/A) and Jacoby Brissett (tied for 6th in interception rate, 28th in NY/A).

The chart below shows the 32 qualifying passers in 2017. The Y-Axis displays net yards per attempt; the X-Axis displays interception rate.  You’ll notice a lack of any dots in the upper right section of the graph, which is where the very aggressive passers would go:

[continue reading…]

{ 31 comments }

2017 AP All-Pro Teams Announced

A few days ago, the AP announced the 2017 All-Pro teams. For the second year in a row, there was no fullback position, replaced by a “Flex” spot that can basically go to any running back, wide receiver, or tight end. This year, 38 of the 50 votes went to a running back, 8 went to a wide receiver, and 4 to a tight end. On both offense and defense there are 12 first-team All-Pros: on offense, it’s five offensive lineman, a quarterback, two running backs, two wide receivers, one flex, and one tight end. On defense, there are 2 first team edge rushers, 2 interior defenders, 3 linebackers, 2 cornerbacks, 2 safeties, and one defensive back.

The full list, below.

Offense

Quarterback

Tom Brady, New England, 47; Carson Wentz, Philadelphia, 2; Russell Wilson, Seattle, 1.

Running Backs

Todd Gurley, Los Angeles Rams, 46; Le’Veon Bell, Pittsburgh, 3; Kareem Hunt, Kansas City, 1.

Wide Receivers

Antonio Brown, Pittsburgh, 50; DeAndre Hopkins, Houston, 42; Julio Jones, Atlanta, 5; Adam Thielen, Minnesota, 3.

Flex

Le’Veon Bell, Pittsburgh, 26; Alvin Kamara, New Orleans, 9; Travis Kelce, Kansas City, 2; Kareem Hunt, Kansas City, 2; DeAndre Hopkins, Houston, 2; Julio Jones, Atlanta, 2; Rob Gronkowski, New England, 2; Jarvis Landry, Miami, 1; Tyreek Hill, Kansas City, 1; Keenan Allen, Los Angeles Chargers, 1; Todd Gurley, Los Angeles Rams, 1; Doug Baldwin, Seattle, 1.

Tight End

Rob Gronkowski, New England, 40; Travis Kelce, Kansas City, 10.

[continue reading…]

{ 4 comments }

Guest Post: Adam Steele on Quarterback MVP Shares

Adam Steele is back for another guest post. You can view all of Adam’s posts here. As always, we thank him for contributing.


In this post, I will attempt to estimate how many MVP awards each QB has “deserved” over the course of his career. I wanted to accomplish this task using very basic statistics, so the only inputs are pass attempts, passing yards, and TD passes. I can’t stress enough that this is aimed at providing rough estimates and not definitive answers.

Methodology

The metric I will use for this study is my own creation, Positive Yards Per Attempt (PY/A). I chose this over ANY/A for several reasons:

  • It is available back to the early days of the NFL, whereas ANY/A only goes back to 1969; I prefer to employ a uniform measurement for players of every era.
  • Sacks (invalid) and interceptions (unstable and invalid) are poor measures of QB performance, while Y/A and TD% are both statistically valid. (Proof)
  • If I used ANY/A, a number of unworthy seasons would appear MVP caliber due to fluky INT rates (looking at you, Damon Huard).
  • MVP voters typically focus on yards, TD passes, and wins (shame on them), but largely ignore interceptions and sacks.

With my justifications out of the way, let’s get to the actual formula:

  1. PY/A = (Passing Yards + TD Passes *20) / Attempts.
  2. Each QB season is compared to league average, giving us Relative PY/A (RPY/A). At this juncture, all seasons below +1 RPY/A are discarded, as I consider that the minimum baseline for a great season.
  3. I don’t want anyone receiving MVP Shares for lighting it in limited action (Todd Collins in 2007, for example), so I added a minimum threshold for attempts in a season. From 1978-present, the minimum is 300 attempts, and from 1950-1977 the minimum is 200 attempts. I purposely did not prorate 1982 and 1987 because I don’t think MVP awards in shortened seasons should be worth as much as full seasons.
  4. I excluded the AFL and AAFC because those leagues had watered down competition, and also because I’m lazy. Seasons before 1950 are excluded for the same reasons.
  5. I want to emphasize QB’s who play all or most of a season, which is accomplished by subtracting the minimum baseline from each QB’s attempts in a season. For example, a modern QB who attempts 525 passes in a given year will have his attempts adjusted down to 225 (525-300). This ensures that a QB who plays excellently over 2/3 of a season doesn’t get too much credit, but still gets some (such as Kurt Warner in 2000).
  6. RPY/A is multiplied by adjusted pass attempts to calculate MVP Value.
  7. League MVP Value is summed in each season, and each quarterback’s MVP Value is divided by the league total. This is his MVP Share. The divisor is capped at 500 and floored at 200, which results in some seasons producing more or less than one MVP Share. This last modifier was necessary due to vast discrepancies in yearly MVP Value totals, as I don’t want historically great seasons penalized too much for occurring within a loaded field (such as 2011 or 1976). The 68 seasons from 1950-2017 produced a grand total of 60.2 MVP Shares, which feels quite reasonable (we can pretend the other 7.8 MVP awards went to non-quarterbacks).

Here are the top 100 MVP Share seasons since 1950:

QuarterbackYearTeamAttYardsTDPY/ALgPY/ARPY/AMVPValMVPShare
Steve Young1994SFO46139693510.137.542.59256.01.00
Dan Marino1984MIA56450844810.727.972.75462.00.92
Steve Young1993SFO4624023299.967.402.56252.70.90
Peyton Manning2004IND49745574911.147.943.20433.40.87
Matt Ryan2016ATL53449443810.688.012.67390.80.85
Aaron Rodgers2011GNB50246434511.048.052.99402.00.80
Kurt Warner2001STL54648303610.167.542.62398.50.80
Boomer Esiason1988CIN38835722810.657.702.95171.60.77
Lynn Dickey1983GNB48444583210.538.042.49274.20.76
Y.A. Tittle1963NYG36731453610.538.621.9161.00.31
Tom Brady2007NWE57848065010.047.692.35375.30.75
Earl Morrall1968BAL31729092610.828.032.7930.40.11
Joe Namath1972NYJ3242816199.867.692.1728.10.14
Kurt Warner1999STL49943534110.377.542.83364.20.73
Peyton Manning2013DEN6595477559.988.001.98351.80.70
Brett Favre1995GNB5704413389.087.561.52140.40.70
Johnny Unitas1964BAL30528241910.508.182.326.60.03
Fran Tarkenton1967NYG3773088299.737.911.8263.10.30
Sonny Jurgensen1961PHI41637233210.498.571.92106.70.35
Steve Young1992SFO4023465259.867.632.23125.50.63
Philip Rivers2008SDG4784009349.817.722.09194.00.59
Ken Anderson1975CIN3773169219.527.522.0077.00.25
Bert Jones1976BAL34331042410.457.443.0186.40.17
Craig Morton1969DAL30226192110.067.962.102.20.01
Norm Van Brocklin1954RAM26026371311.148.292.85-74.0-0.37
Dan Fouts1985SDG4303638279.727.861.86111.80.56
Daunte Culpepper2004MIN54847173910.037.942.09270.30.54
Carson Palmer2015ARI53746713510.008.171.83196.70.54
Roger Staubach1973DAL28624282310.107.422.68-23.5-0.09
Ken Stabler1976OAK29127372711.267.443.82-25.4-0.05
Tom Brady2011NWE6115235399.848.051.79245.70.49
Drew Brees2011NOR6575476469.748.051.69246.30.49
Jim Kelly1991BUF4743844339.507.611.89154.90.49
Philip Rivers2010SDG5414710309.827.871.95229.00.48
Joe Montana1989SFO38635212610.477.952.52130.70.48
Boomer Esiason1986CIN4693959249.467.781.68114.90.47
Aaron Rodgers2014GNB5204381389.898.101.79173.80.47
Mark Rypien1991WAS4213564289.807.612.19144.00.45
Drew Brees2009NOR5144388349.867.812.05224.70.45
Peyton Manning2005IND4533747289.517.561.95145.40.45
Warren Moon1990HOU5844689339.167.841.3290.90.45
Terry Bradshaw1977PIT3142523179.127.281.8411.80.05
Johnny Unitas1965BAL28225302310.608.532.07-19.3-0.10
Vinny Testaverde1996BAL5494177338.817.461.3587.20.44
John Brodie1970SFO3782941249.057.561.4938.20.19
Brett Favre1997GNB5133867358.907.461.4493.70.43
Norm Van Brocklin1960PHI28424712410.398.242.15-18.4-0.08
Daunte Culpepper2000MIN4743937339.707.522.18205.30.41
Philip Rivers2009SDG4864254289.917.812.10204.60.41
Randall Cunningham1998MIN42537043410.327.692.63203.80.41
Jim Everett1989RAM5184310299.447.951.49106.80.39
Ken Stabler1974OAK3102469269.647.242.4014.00.03
Peyton Manning2012DEN5834659379.267.921.3496.20.38
Trent Green2002KAN4703690268.967.511.4576.50.38
Peyton Manning2006IND5574397319.017.641.3795.10.36
Tony Romo2014DAL43537053410.088.101.98132.30.36
Otto Graham1953CLE25827221111.407.473.93-123.1-0.26
Tony Romo2007DAL5204211369.487.691.79173.80.35
Milt Plum1960CLE25022972110.878.242.63-81.5-0.35
Drew Brees2008NOR6355069349.057.721.33110.60.34
Don Meredith1966DAL3442805249.557.811.7432.60.10
Johnny Unitas1957BAL30125502410.078.401.670.70.00
Y.A. Tittle1962NYG37532243310.368.981.3828.50.14
Steve Young1998SFO5174170369.467.691.77167.10.33
Dan Marino1986MIA6234746449.037.781.2580.80.33
Steve McNair2003TEN4003215249.247.421.8282.00.32
Terry Bradshaw1978PIT3682915289.447.501.9463.90.32
Ben Roethlisberger2009PIT5064328269.587.811.77158.60.32
Ken Anderson1974CIN3282667189.237.241.9927.70.07
Len Dawson1971KAN3012504159.327.531.790.80.00
Johnny Unitas1959BAL3672899329.648.291.3523.50.12
Greg Landry1971DET2612237169.807.532.27-49.5-0.19
Craig Morton1981DEN3763195219.617.851.7657.80.29
Norm Snead1967PHI4343399299.177.911.2634.80.16
Steve Young1997SFO3563029199.587.462.1262.70.29
Frank Ryan1966CLE3822974299.307.811.4940.20.13
Russell Wilson2015SEA4834024349.748.171.57104.30.28
Aaron Rodgers2012GNB5524295399.197.921.2768.00.27
Terry Bradshaw1979PIT4723724268.997.681.3153.30.27
Vince Ferragamo1980RAM4043199309.407.881.5254.10.27
Drew Brees2006NOR5544418268.917.641.2768.60.26
Steve Beuerlein1999CAR5714436369.037.541.49132.80.27
Norm Van Brocklin1950RAM23320611810.397.792.60-107.2-0.54
Jared Goff2017RAM4773804289.157.851.3053.10.27
Steve Grogan1979NWE4233286289.097.681.4150.40.25
Dan Fouts1978SDG3812999249.137.501.6351.00.26
Otto Graham1951CLE2652205179.607.841.76-26.6-0.13
Boomer Esiason1985CIN4313443279.247.861.3849.80.25
Roger Staubach1978DAL4133190258.937.501.4348.60.24
Bob Griese1977MIA3072252228.777.281.493.40.02
Kurt Warner2000STL34734292111.097.523.57120.80.24
Aaron Rodgers2009GNB5414434309.307.811.49118.10.24
Joe Ferguson1975BUF3212426259.127.521.6012.60.04
Fran Tarkenton1964MIN3062506229.638.181.452.70.01
Billy Wade1958RAM3412875189.498.161.3313.50.07
John Hadl1973RAM2582008229.497.422.07-44.9-0.17
Roger Staubach1979DAL4613586278.957.681.2743.50.22
Norm Van Brocklin1953RAM2862393199.707.472.23-17.2-0.04
Bobby Thomason1953PHI3042462219.487.472.014.00.01
Donovan McNabb2004PHI4693875319.587.941.64108.20.22

And now the MVP Share career list (the Seasons column represents the number of different seasons each QB received more than zero MVP Shares):

QuarterbackMVPShareSeasons
Peyton Manning3.5711
Steve Young3.156
Johnny Unitas2.146
Aaron Rodgers2.005
Drew Brees1.968
Tom Brady1.927
Brett Favre1.808
Kurt Warner1.794
Philip Rivers1.684
Boomer Esiason1.504
Norm Van Brocklin1.506
Dan Fouts1.446
Y.A. Tittle1.354
Ken Stabler1.305
Dan Marino1.293
Daunte Culpepper1.163
Terry Bradshaw1.165
Roger Staubach1.135
Tony Romo1.126
Ken Anderson1.105
Fran Tarkenton1.084
Craig Morton1.024
Carson Palmer0.864
Joe Montana0.853
Matt Ryan0.851
Lynn Dickey0.812
Joe Namath0.782
Jim Kelly0.773
Sonny Jurgensen0.762
Earl Morrall0.742
Trent Green0.744
Otto Graham0.734
Bob Griese0.715
Ben Roethlisberger0.645
John Brodie0.592
Bert Jones0.571
Jim Everett0.562
Vinny Testaverde0.542
Russell Wilson0.523
Don Meredith0.502
Greg Landry0.463
Mark Rypien0.451
Warren Moon0.451
Billy Wade0.432
Randall Cunningham0.411
Steve McNair0.382
Frank Ryan0.362
Milt Plum0.351
Donovan McNabb0.333
Steve Grogan0.313
Len Dawson0.301
Norm Snead0.291
John Hadl0.282
Steve Beuerlein0.282
Chris Chandler0.274
Vince Ferragamo0.271
Jared Goff0.261
Eli Manning0.252
Jeff George0.252
Bart Starr0.242
Joe Ferguson0.241
Bobby Layne0.233
Matt Schaub0.232
Bill Nelson0.222
Bobby Thomason0.221
Chad Pennington0.201
Alex Smith0.181
George Ratterman0.171
Jake Delhomme0.171
Tommy Kramer0.171
Matt Hasselbeck0.162
Bob Berry0.142
Jay Schroeder0.141
Joe Theismann0.141
Neil Lomax0.141
Andy Dalton0.131
Ken O'Brien0.121
Rudy Bukich0.121
Jeff Garcia0.111
Ron Jaworski0.111
Carson Wentz0.101
Charley Johnson0.101
Danny White0.091
Robert Griffin0.091
Steve Bartkowski0.091
Troy Aikman0.091
Mark Brunell0.081
Wade Wilson0.071
Chris Miller0.061
Elvis Grbac0.061
Matthew Stafford0.061
Michael Vick0.061
Mike Livingston0.061
Nick Foles0.061
Billy Kilmer0.052
Brian Griese0.052
Jim Harbaugh0.051
John Elway0.051
Adrian Burk0.041
Bobby Hebert0.041
Brad Johnson0.041
Dave Krieg0.042
Marc Bulger0.041
Richard Todd0.041
Bernie Kosar0.031
Jim Hart0.031
Tommy Maddox0.031
Bob Lee0.021
David Garrard0.011
Doug Flutie0.011
Steve Spurrier0.011
Jeff Hostetler0.001

I’ll leave the commentary up to you guys!

{ 37 comments }

The Philadelphia Eagles are the #1 seed in the NFC, and they got there despite nearly half of their team’s starts coming from players who were on other teams. Of the 352 starts (16 * 22) for the team this season, 166 came from players who are not lifelong Eagles. Eighteen players had 11+ starts for Philadelphia, with half of those players not being homegrown. Note: All players in today’s post are included if they played a single game for a team this year or in prior years, regardless of whether or not they are no longer on that team (in say, the case of Adrian Peterson). Call this the lazy way out. [continue reading…]

{ 1 comment }

This duo took the NFC by storm in 2011.

We know that, in general, home teams are favorites in the postseason. But home teams are almost always the favorites in the division round, because those teams are coming off of a bye. In the wild card round, it’s not unusual to see road teams favored: that didn’t happen this year, but it’s easy to see why bad division winner can be an underdog against the best wild card team. It’s happened 20 times since 1990, and in 2015, three of the four home teams were underdogs in the wild card round, and the fourth was a one-point favorite. And all four home teams lost.

The conference championship game features, in theory, the two best teams in the conference; it’s not hard to understand that sometimes, the best team isn’t the #1 seed, and they can wind up being road favorites. It’s happened eight times since 1990, mostly recently two seasons ago. The Broncos were home underdogs to the Patriots in the 2015 AFCCG and won; New England was the better team on paper but lost a H2H tiebreaker for the 1 seed. The Falcons were home dogs in the 2012 AFCCG to the 49ers and lost; San Francisco was 4 points better in the SRS than Atlanta that year, but the Falcons won the 1 seed because they had a much easier schedule than the 49ers and outperformed their Pythagorean win total. The Packers might have been the best team in the NFC in 2010, but lost the NFC North by one game to the Bears; Green Bay won the Super Bowl and was a road favorite in the 2010 NFCCG in Chicago. In short, it happens.

But what rarely happens is seeing a top two seed coming off of a bye be a home dog. In fact, since the NFL expanded to 6 playoff teams per conference in 1990 and instituted byes for the top two seeds, it’s happened just three other times. [continue reading…]

{ 1 comment }

Dan Quinn and the Atlanta Falcons pulled off a big upset on Wild Card weekend, winning 26-13 in Los Angeles against the heavily favored Rams. The win was driven in large part by special teams: Atlanta picked up 40 yards of field position on punts, Falcons kicker Matt Bryant was 4/4 on field goals, including from 51 and 54 yards away, and the Rams lost two fumbles on special teams, with one muff and one fumble by Pro Bowler Pharoh Cooper.

Special teams was the story of the game, but the narrative nearly shifted to a monumental mistake by Quinn.  With just under 6 minutes left in the game, the Falcons scored a touchdown to take a 25-13 lead.  Up by 12 with 5:54 remaining, going for 2 is the obvious choice. The difference between a 12-point lead and a 13-point lead with 6 minutes left isn’t much; meanwhile, the difference between a 13-point lead and a 14-point lead is huge.  The Rams were very unlikely to have three possessions left and to tie the game with a touchdown and two field goals, but a Los Angeles touchdown, followed by a stop, followed by another Rams TD was certainly on the table.  That would win the game if the Rams were down 12 or 13, but only force overtime if the Rams were down by 14.

Yet, remarkably, Quinn chose to kick the extra point.  Since the start of the 2012 season, there had been 12 instances where a team scored a touchdown to take a 12-point lead with less than 7 minutes left in the game.  Even overly conservative coaches mostly got this right: they went for two in 9 of 12 cases.

The three exceptions were notable:

In week 2 of the 2016 season, the Jets took a 36-24 lead over the Bills with just over four minutes remaining.  I tweeted that the Jets needed to go for 2 after scoring, was incredulous after they did not, and then hoped the Jets media would ask Bowles about it after the game. It turns out that they did, and Bowles admitted making a mistake.

Bowles on Friday said he “should’ve” gone for two in this spot. Why didn’t he?

“I was occupied doing something with the defense,” he said. “When I turned around and looked at it, that was my bust. I’ll be better going forward.”

Another example came in 2013, when (at the time) everyone’s favorite coach, Chuck Pagano, pulled off a big upset but made this same mistake.  I wrote about that at the time, too:

I can’t believe I’m writing this article. Everyone loves Chuck Pagano, but he made a pretty embarrassing blunder at the end of the Colts upset win in San Francisco on Sunday. The Colts led 13-7 when Andrew Luck scrambled for a six yard touchdown on 3rd-and-3 with just over four minutes left in the fourth quarter. Incredibly, Pagano then chose to kick the extra point, which my buddy and Colts fan Nate Dunlevy identified immediately as a terrible decision.

I wasn’t going to write a post about that decision, because, ya know, what could be more obvious than going for two when up by 12 points with just over four minutes left in the game? I mean, Jason Garrett got this right in the season opener. Being up by 14 points means two touchdowns doesn’t beat you, while there is almost no difference between being up 12 or being up 13 points.

The final example involved the Browns in a 37-24 win over Buffalo.  Cleveland recorded a pick six with just under two minutes left to take a 36-24 lead.  Maybe Rob Chudzinski was so surprised by the score that he simply made a brainfart the way Bowles did.  In some ways, the mistake was minimized, because the odds of the other team scoring two touchdowns in less than two minutes are much lower than two touchdowns in six minutes.  On the other hand, there’s literally no justification at all for not going for two in that case, because the opponent can’t have three possessions. [continue reading…]

{ 11 comments }

With the 2017 season in the books, I wanted to review the top offenses and defenses from the regular season. Today we will look at how each team did in the four major categories: passing offense, rushing offense, passing defense, and rushing defense.

Passing Offense

The base stat we use to measure passing offenses is Adjusted Net Yards per Attempt, but if we want to be even more precise, we should incorporate first downs. As a result, the formula is:

(Passing Yards (net of sack yards lost) + Passing Touchdowns * 11 + First Downs * 9 – Interceptions * 45) divided by (Attempts + Sacks)

In the table below, we are using team passing yards, which already deducts sack yards lost. And since every touchdown is automatically a first down, this means that all touchdowns are worth 20 adjusted yards. But to not make them worth 29 yards, we have to only credit each touchdown with 11 yards.

Drew Brees and the Saints had the top passing offense by this measure, although the Patriots and Chargers passing attacks weren’t far behind. The Browns were, by a large margin, the worst passing offense in the NFL, with the Broncos and Packers joining them in the bottom three. [continue reading…]

{ 20 comments }

Keenum and Thielen are an unlikely pair driving the best team in the NFC.

This year’s Super Bowl will be played in Minneapolis, Minnesota at U.S. Bank Stadium, the second-year facility that hosts the Minnesota Vikings during the regular season. That game will be the 52nd Super Bowl, and 44 of the first 51 were played at the home stadium of an AFL or NFL team.

First, let’s look at the seven — well, really three- exceptions where the game was played at a non-NFL/AFL site. In two of the three cases, a home region team has made it to that Super Bowl.

  • The Oilers played at Rice Stadium for their first three seasons before moving to the Astrodome. Super Bowl VIII, featuring the Dolphins and Vikings, was award to Houston and Rice Stadium (likely over the Astrodome because of the larger seating capacity). The Oilers went 1-13 that season.
  • The Super Bowl concluding the 1979 season was played at the Rose Bowl, which has been the site for 5 Super Bowls.  That year, the Los Angeles Rams won the NFC. The Rams played home games at the Coliseum, a mere 25 minutes from the Rose Bowl.
  • Park in San Francisco.

  • Five years later, the 49ers — who played home games at Candlestick Park — won the NFC.  That year, the Super Bowl was played at Stanford Stadium in Palo Alto, the only other non-NFL venue to host a Super Bowl.  Stanford Stadium is just 30 miles from Candlestick Park in San Francisco.

In the other 44 instances prior to 2017, the host team (or teams, in the case of the Jets and Giants with regards to Super Bowl XLVIII) failed to make the postseason in 37 times. That leaves 7, and now 8, instances where the team that hosted the Super Bowl also made the postseason. Let’s review, in descending order of likelihood of making that year’s Super Bowl.

#8: 2016 Houston Texans (Super Bowl LI played at NRG Stadium)

The Houston Texans made the playoffs last season, but the 9-7 Texans had a points differential of a 6.5-win team. Brock Osweiler and the Texans actually won their first playoff game, but it came against a Raiders team down Derek Carr and starting third string QB and rookie Connor Cook.  Houston lost as 16-point underdogs to New England in the Divisional Round, and was never a real Super Bowl threat.

#7: 1998 Miami Dolphins (Super Bowl XXXIII played at Pro Player Stadium)

The ’98 Dolphins went 10-6, but were never viable contenders for the Super Bowl. Miami lost the AFC East to the Jets and played in a conference with the eventual Super Bowl champion Broncos.  But Miami still had Dan Marino and young versions of Jason Taylor, Zach Thomas, and Sam Madison. After beating the Bills in the Wild Card round by stopping Buffalo on a last-minute goal-line stand, the Dolphins were trounced the following week in Denver, 38-3.

#6: 2000 Tampa Bay Buccaneers (Super Bowl XXXV played at Raymond James Stadium)

Tampa Bay made it to the NFC Championship Game the prior year, and went 10-6 in 2000 behind Shaun King and, more importantly, a dominant pass defense.  The Bucs made the playoffs as a Wild Card entrant, and had to travel to Philadelphia in the first round.  Playing in brutal weather with 11 degree wind chill, Tampa Bay was held to 199 yards and 3 points in a loss.

#5: 1994 Miami Dolphins (Super Bowl XXIX played at Joe Robbie Stadium)

The Dolphins won the AFC East and then beat Joe Montana and the Chiefs in the first round of the AFC playoffs. In the Divisional Round, the Dolphins went to San Diego to face an upstart Chargers team… and nearly blew San Diego out of the stadium. Miami took a 21-6 lead into the locker room, but the Chargers slowly chipped away at the lead.  San Diego threw a go-ahead touchdown in the final minute to complete the comeback and take a 22-21 lead.  A late pass interference penalty set Miami up for a 48-yard field goal and the win, but Pete Stoyanovich’s try was wide right, ending Miami’s season.

#4: 2014 Arizona Cardinals (Super Bowl XLIX played at University of Phoenix Stadium)

The Cardinals started the season 9-1, including a 6-0 mark under Carson Palmer. But Palmer tore his ACL against the Rams, turning the job over to Drew Stanton… who went 5-3 as a starter before suffering his own knee injury.  Arizona was a legitimate Super Bowl contender with Palmer and had a chance to win the #1 seed in the NFC and host all of their playoff games — including a potential Super Bowl.  But Ryan Lindley started the team’s Wild Card game against the Panthers, had one of the worst passing games in postseason history, and Arizona was one and done in the playoffs.

#3: 1978 Miami Dolphins (Super Bowl XIII played at the Orange Bowl)

The 1978 Dolphins went 11-5 and were one of just three teams (Pittsburgh, Dallas) to outscore their opponents by 100 points during the regular season.  Miami had the fewest giveaways in the NFL (30) and led the NFL with 53 takeaways. The Dolphins had a dominant interior line (Bob Kuechenberg, Jim Langer, Larry Little), an all-pro running back in Delvin Williams, and QB Bob Griese led the NFL in completion percentage and made the Pro Bowl.

The Dolphins were 6.5-point road favorites in Houston in the Wild Card round.  In the regular season, a rookie Earl Campbell arrived on the national scene with 199 yards and 4 touchdowns in a 35-30 Monday Night football win in Miami. The playoff game was much lower scoring: the teams were tied at seven apiece heading into the fourth quarter, but the Oilers ultimately won, 17-9. Houston outgained Miami 455-209, and the Dolphins turnover luck ran out: Miami committed five turnovers, and had just one takeaway in the loss.

#2: 1970 Miami Dolphins (Super Bowl V played at the Orange Bowl)

The 1970 Dolphins were the baby version of the perfect team that went 17-0 two years later. Griese, Larry Csonka, Mercury Morris, and Jim Kiick were all in Miami and 25 years or younger. Wide receiver Paul Warfield was also in town, and in the prime of his playing career.  Miami went 10-4 but finished the season on a 6-game winning streak, including a 34-17 win over Johnny Unitas and the eventual Super Bowl champion Colts.

In the Divisional Round of the playoffs, the Dolphins traveled to Oakland to face the Raiders.  Miami was burned by two big plays: Willie Brown had a 50-yard pick six to give Oakland a 14-7 lead in the third quarter, and Daryle Lamonica hit Rod Sherman for an 82-yard bomb early in the fourth. The Dolphins responded with a touchdown drive, but trailing 21-14, Miami’s two-minute drill ended — and Super Bowl hopes — ended on downs.

#1: 2017 Minnesota Vikings (Super Bowl LII played at U.S. Bank Stadium)

The Vikings finished the regular season 13-3 and have earned a playoff bye and the #2 seed in the NFC.  With #1 seed Philadelphia’s starting quarterback Carson Wentz out for the rest of the season, the Vikings are the clear conference favorites according to Vegas to make it to the Super Bowl. Minnesota ranked 4th in DVOA, and Football Outsiders give the Vikings a 30% chance of making the Super Bowl, the highest of any NFC team. And if the Eagles lose in the Divisional Round, Minnesota won’t leave the state at all during the postseason.

Minnesota allowed just 252 points this year, the fewest in the NFL. DE Everson Griffen, OLB Anthony Barr, and CB Xavier Rhodes made the Pro Bowl; safety Harrison Smith had 5 interceptions and is the #1 safety in the NFL according to Pro Football Focus.  The Vikings have stars at every level of the defense, and are equally dominant against both the run and the pass.

On offense, Minnesota is short on name power but undrafted stars Case Keenum and Adam Thielen lead en efficient and productive attack. Minnesota has beaten the NFC West (Rams) and NFC South (Saints) champions this year, and the Vikings are 7-1 at U.S. Bank Stadium this year. The Vikings have as good a chance as any team has ever had to not only play in, but win, the Super Bowl in their home stadium.

{ 12 comments }

Post Your 2017 Playoff Predictions

Post your playoff predictions in the comments. Here are mine:

Wild Card Round

Tennessee @ Kansas City

The AFC South has sent the Colts or Texans to the playoffs each year since 2008; this year, the other two AFC South teams are going to the playoffs.  Unfortunately for Tennessee, it’s hard to find much to like about the Titans.

The Chiefs destroyed, in Houston, a better AFC South opponent on the road in this exact slot (first playoff game) two years ago. Marcus Mariota and Alex Smith both finished the year 9-6, but that’s about all they had in common.

The Chiefs biggest vulnerability is their pass defense, but that’s not something Tennessee is likely to exploit. Four months ago, Eric Decker and Corey Davis were supposed to transform the Titans passing game, but that hasn’t happened yet.  The duo had their best games of the season two weeks ago (combining for 12 receptions and 164 yards), and Tennessee will need something similar to upset the Chiefs.

In 2016, Tennessee beat the Chiefs on a last-second field goal, in a game where Smith was held to a 56.1 passer rating. If the Titans do that again, they’d be the favorites, but that’s unlikely to happen.

Prediction: Kansas City 31, Tennessee 23

[continue reading…]

{ 24 comments }

As regular readers know, Football Perspective created a draft value chart that mirrors the actual average production by players selected for each draft pick.

In 2015, Cleveland had the most draft value as measured by the Football Perspective Draft Value Chart with 68.4 points. In theory, that could have set the Browns and 2nd-year GM Ray Farmer up for long-term success.  Instead? The Browns mostly missed on those picks.

Misc Passing Rushing Receiving
Rnd Player Pick Pos Yrs From To AP1 PB St CarAV G Cmp Att Yds TD Int Att Yds TD Rec Yds TD College/Univ
1 Danny Shelton 12 NT 3 2015 2017 0 0 3 12 45 Washington
1 Cameron Erving 19 C 3 2015 2017 0 0 1 7 41 0 0 0 Florida St.
2 Nate Orchard 51 DE 3 2015 2017 0 0 1 5 33 Utah
3 Duke Johnson 77 RB 3 2015 2017 0 0 0 10 47 0 1 0 0 0 253 1065 4 182 1666 5 Miami (FL)
3 Xavier Cooper 96 DT 3 2015 2017 0 0 0 3 38 Washington St.
4 Ibraheim Campbell 115 SS 3 2015 2017 0 0 0 4 37 Northwestern
4 Vince Mayle 123 WR 3 2015 2017 0 0 0 0 22 2 2 1 0 0 0 Washington St.
6 Charles Gaines 189 CB 1 2015 2015 0 0 0 1 6 Louisville
6 Malcolm Johnson 195 TE 2 2015 2016 0 0 0 0 19 1 2 0 9 59 0 Mississippi St.
6 Randall Telfer 198 TE 2 2016 2017 0 0 1 0 29 5 40 0 USC
7 Hayes Pullard 219 ILB 3 2015 2017 0 0 0 2 36 USC
7 Ifo Ekpre-Olomu 241 CB 0 0 0 Oregon

Shelton saw the field on 44% of Browns defensive snaps this season, Erving is now in Kansas City, and Orchard has just 5 sacks in three seasons.  Johnson has been a very good 3rd round pick, but Cooper is now off the team, and none of the players drafted in the 4th through 7th rounds have made any material impact.  In short, it was a disappointing draft (and this was after an extraordinarly disappointing draft in 2014 that saw the Browns and Farmer select Justin Gilbert and Johnny Manziel in the first round.

In 2016, the Browns and new GM Sashi Brown had even more draft capital: 75.3 points, again the most in the NFL. The early returns are mixed:

Misc Passing Rushing Receiving
Rnd Player Pick Pos Yrs From To AP1 PB St CarAV G Cmp Att Yds TD Int Att Yds TD Rec Yds TD College/Univ
1 Corey Coleman 15 WR 2 2016 2017 0 0 1 3 19 2 10 0 55 700 5 Baylor
2 Emmanuel Ogbah 32 DE 2 2016 2017 0 0 2 7 26 Oklahoma St.
3 Carl Nassib 65 DE 2 2016 2017 0 0 1 2 29 Penn St.
3 Shon Coleman 76 T 2 2016 2017 0 0 1 0 21 Auburn
3 Cody Kessler 93 QB 2 2016 2017 0 0 1 3 13 139 218 1506 6 3 12 17 0 USC
4 Joe Schobert 99 OLB 2 2016 2017 0 0 1 2 31 Wisconsin
4 Ricardo Louis 114 WR 2 2016 2017 0 0 1 1 31 45 562 0 Auburn
4 Derrick Kindred 129 FS 2 2016 2017 0 0 1 2 26 TCU
4 Seth Devalve 138 TE 2 2016 2017 0 0 0 1 27 43 522 3 Princeton
5 Jordan Payton 154 WR 1 2016 2016 0 0 0 0 4 1 3 0 UCLA
5 Spencer Drango 168 G 2 2016 2017 0 0 2 4 31 Baylor
5 Rashard Higgins 172 WR 2 2016 2017 0 0 0 0 30 1 4 0 30 321 0 Colorado St.
5 Trey Caldwell 173 DB 1 2016 2016 0 0 0 0 1 La-Monroe
7 Scooby Wright 250 ILB 2 2016 2017 0 0 0 0 12 Arizona

Coleman has been a disappointment through two seasons, and sealed the team’s 0-16 fate by dropping an easy first down catch on 4th-and-2 on the Browns final drive. He has just 56 receptions in two years. Ogbah flashed as a rookie, but missed most of the second half of the 2017 season as a rookie: between him and Nassib (8 quarterback hits and 3 sacks while playing about 60% of the team’s snaps), the Browns probably have at least one solid pass rusher.  Coleman and Drango have turned into starters on the line, and Schobert played every snap for the Browns on defense this season, but how much is there to be said for being a starter on an 0-16 team? Schobert, perhaps unsurprisingly, led all defensive players in both tackles (58) and assists (41) on run plays, but he had just three tackles for a loss. The skill position players, including Kessler, have not panned out through two seasons.

Then, in 2017, the Browns led the NFL with a whopping 86.9 points of draft value!  The Saints were second with 63.5 points, showing the massive margin the Browns had on the rest of the NFL.

 
Misc Passing Rushing Receiving
Rnd Player Pick Pos Yrs From To AP1 PB St CarAV G Cmp Att Yds TD Int Att Yds TD Rec Yds TD College/Univ
1 Myles Garrett 1 DE 1 2017 2017 0 0 1 0 11 Texas A&M
1 Jabrill Peppers 25 S 1 2017 2017 0 0 1 0 13 Michigan
1 David Njoku 29 TE 1 2017 2017 0 0 0 0 16 1 1 0 32 386 4 Miami (FL)
2 DeShone Kizer 52 QB 1 2017 2017 0 0 1 0 15 255 476 2894 11 22 77 419 5 Notre Dame
3 Larry Ogunjobi 65 DT 1 2017 2017 0 0 0 0 14 Charlotte
4 Howard Wilson 126 CB 0 0 0 Houston
5 Roderick Johnson 160 T 0 0 0 Florida St.
6 Caleb Brantley 185 DT 1 2017 2017 0 0 0 0 12 Florida
7 Zane Gonzalez 224 K 1 2017 2017 0 0 1 0 16 Arizona St.
7 Matthew Dayes 252 RB 1 2017 2017 0 0 0 0 16 5 13 0 4 29 0 North Carolina St.

It’s hard to grade the 2017 class, but again… 0-16 doesn’t help matters. Garrett had 7.0 sacks and 18 quarterback hits despite playing on just 48% of all Browns snaps; he looks like the real deal, and there’s every expectation that he will turn into a consistent double digit sack player. Peppers was on the field for 75% of snaps, and Njoku flashed the athleticism that made him a first round pick.  Those three still have bright potential.  Kizer? Well, he was a disaster, but Jared Goff showed us that a bad rookie season doesn’t necessarily mean much for how year two will go (of course, it seems likely that Kizer won’t be the team’s starter in 2018).

But guess what: the Browns aren’t just back at it for a fourth year in a row and with a third GM in John Dorsey. If this was a movie, the 2018 Draft would be The Browns and The Draft Part IV: This Time More Brownsier. The Jets have the 2nd most draft value of any team this year, thanks to the 6th overall pick and an extra 2nd round pick from Seattle as part of the Sheldon Richardson trade.  The Jets have 66 points of draft value, and the Giants (who own the 2nd overall pick) have 62.5 points.

The Browns have a projected 119.9 points of draft value.

***One Hundred And Nineteen Point Nine Points.***

Cleveland owns the 1st, 4th (from the Deshaun Watson trade), 33rd, 35th (Brock Osweiler trade), a late 2nd (~63rd overall) from the Eagles as part of the Carson Wentz trade, and the 65th picks in the 2018 Draft.  By virtue of having the 1st pick in every round, and top-5 picks in the 1st and 2nd rounds from the Texans, along with Carolina’s 4th round pick, and Pittsburgh’s 6th round pick, the Browns are absolutely loaded with 2018 Draft Capital — just like we knew they would be. But when I wrote that article, I didn’t realize (1) the Browns would have the first pick every round, and (2) the two Houston picks would be top four picks in the first two rounds.  So as rosy as the outlook was before, it’s even more remarkable now.

Cleveland is going to be the first team since the 2000 Jets with four picks in the first 40 selections.  The Browns, if they keep their selections, would become just the sixth team since the common draft (1967) with two top-5 picks:

  • Buffalo drafted Tom Cousineau (who never played for the team) with the first pick in the 1979 Draft (received from San Francisco in the O.J. Simpson trade), and then WR Jerry Butler with the fifth pick that same year.
  • In 1982, the Baltimore Colts drafted LB Johnnie Cooks with the 2nd overall pick, and then QB Art Schlichter with the fourth pick (from the Rams in the Bert Jones trade).
  • Ten years later, the now Indianapolis Colts had the first two picks in the Draft (from Tampa Bay in the Chris Chandler trade), and chose Washington DE Steve Emtman and Texas A&M LB Quentin Coryatt.
  • In 1994, the Indianapolis Colts yet again had two top five picks, drafting RB Marshall Faulk with the second overall pick and then Nebraska LB Trev Alberts with the fifth pick (the Colts acquired the 7th pick from the Falcons as part of the Jeff George trade, and then sent a third round pick to the Rams to move up from 7 to 5)
  • In 2000, the Redskins had the second and third picks and selected Penn State LB LaVar Arrington and Alabama T Chris Samuels. The Arrington pick was part of the Ricky Williams trade, while Samuels was a tradeup involving Washington’s original 24th pick plus the 12th pick they received from the Panthers for Sean Gilbert).

In terms of overall draft value, the Browns are at near-record proportions.  As a technical matter, the final draft value will depend on where the Eagles, Steelers, and Panthers, but for now, we can get a pretty close estimate.  Assuming no trades (unlikely), the Browns will become just the 15th team since 1967 with at least 100 points of value according to the Football Perspective chart.  Even more impressive: the Browns 119.9 point haul would rank as the third best ever.

RkTeamYearValue
1Cowboys1991132.2
2Bengals1968121.4
3Browns2018119.9
4Patriots1982118.6
5Bills1979115.7
6Rams1975114.2
7Bills1985113.9
8Seahawks1976107.7
9Colts1982107.3
10Buccaneers1987106
11Bengals1977105.7
12Vikings1967104.7
13Colts1974100.7
14Colts1992100.3

On one hand, it’s easy to just say the Browns will mess this up. On the other, Dorsey is so well-positioned to turn things around that the expectation for Cleveland should be to make the playoffs by 2019, and be competitive this season. Cleveland has a historically high level of draft capital, over 100 million dollars of free agent money available, and has one of the youngest teams in the NFL. And while the Browns were 0-16 in 2017, the team had 3.3 Pythagorean wins against a neutral schedule. Dorsey has the ability to turn things around very quickly… just like all Browns GMs before him.

{ 10 comments }

Checkdowns: 2017 League Leaders

With the 2017 season in the books, let’s run down the players who history will remember as the leaders in various key metrics. Yesterday we looked at the passing numbers from 2017, so let’s focus on other individual stats today.

Running Backs

Carries

Le’Veon Bell led the NFL with 321 carries; LeSean McCoy was second with 287 carries. Bell had 21.4 rushing attempts per game, but it was Ezekiel Elliott who led the NFL with 24.2 carries per game. In the last 10 years, only twice has a running back had at least 24 carries per game: Elliott in 2017 and his predecessor in Dallas, DeMarco Murray in 2014.

Rushing Yards

Both Todd Gurley (1,305 rushing yards) and Le’Veon Bell (1,291) sat out the final week of the season, which allowed Kansas City’s Kareem Hunt to win the rushing title with 1,327 yards. A stat that may only interest me: this marks the end of a five-season streak where an NFC RB had won the rushing crown; the last AFC RB before Hunt to do it was Maurice Jones-Drew.  And the last non-AFC South RB to do it before Hunt? LaDainian Tomlinson.

Courtesy of a six-game suspension, Elliott was limited to just 10 games this year, but he did lead the NFL in rushing yards per game with 98.3.  Hunt was fourth with 82.9.

Rushing Touchdowns

Los Angeles RB Todd Gurley led the NFL with 13 rushing touchdowns; Saints RB Mark Ingram had 12, and no other player hit double digits.

Yards per Carry

Kamara was not easy to bring down in 2017.

Saints rookie Alvin Kamara finished with a 6.07 yards per carry average, easily the most in the NFL. Among non-QBs, Patriots RB Dion Lewis was second at 4.98. Kamara is just the 9th running back to average 6.00 yards per carry on 100+ carries in a season since the merger. Here’s the full list.

First Downs

Le’Veon Bell led all rushers with 74 rushing first downs. Gurley was second with 66.

Long Runs

Kareem Hunt and LeSean McCoy tied for the lead with 12 carries of 20+ yards. Jets running back Bilal Powell led all players with 4 carries of 40+ yards.

Fumbles

Gurley led all running backs with five fumbles. Dion Lewis (180) and Powell (178) had the most carries among running backs without a fumble. [continue reading…]

{ 9 comments }
Previous Posts