≡ Menu

Danielle Hunter Is Remarkable

Vikings defense end Danielle Hunter has recorded a sack in every game this season, making him just the 8th player since 1982 to record a sack in each of his team’s first 8 games:

 
Rk Year Tm W L T W-L% Count
1 William Fuller 1994 PHI 5 2 0 0.714 7
2 Shaun Ellis 2003 NYJ 2 5 0 0.286 7
3 Robert Mathis 2005 IND 7 0 0 1.000 7
4 DeMarcus Ware 2008 DAL 4 3 0 0.571 7
5 Dwight Freeney 2009 IND 7 0 0 1.000 7
6 Demarcus Lawrence 2017 DAL 4 3 0 0.571 7
7 Everson Griffen 2017 MIN 5 2 0 0.714 7
8 Danielle Hunter 2018 MIN 4 2 1 0.714 7

[continue reading…]

{ 1 comment }

Keenum and Thielen are an unlikely pair driving the best team in the NFC.

This year’s Super Bowl will be played in Minneapolis, Minnesota at U.S. Bank Stadium, the second-year facility that hosts the Minnesota Vikings during the regular season. That game will be the 52nd Super Bowl, and 44 of the first 51 were played at the home stadium of an AFL or NFL team.

First, let’s look at the seven — well, really three- exceptions where the game was played at a non-NFL/AFL site. In two of the three cases, a home region team has made it to that Super Bowl.

  • The Oilers played at Rice Stadium for their first three seasons before moving to the Astrodome. Super Bowl VIII, featuring the Dolphins and Vikings, was award to Houston and Rice Stadium (likely over the Astrodome because of the larger seating capacity). The Oilers went 1-13 that season.
  • The Super Bowl concluding the 1979 season was played at the Rose Bowl, which has been the site for 5 Super Bowls.  That year, the Los Angeles Rams won the NFC. The Rams played home games at the Coliseum, a mere 25 minutes from the Rose Bowl.
  • Park in San Francisco.

  • Five years later, the 49ers — who played home games at Candlestick Park — won the NFC.  That year, the Super Bowl was played at Stanford Stadium in Palo Alto, the only other non-NFL venue to host a Super Bowl.  Stanford Stadium is just 30 miles from Candlestick Park in San Francisco.

In the other 44 instances prior to 2017, the host team (or teams, in the case of the Jets and Giants with regards to Super Bowl XLVIII) failed to make the postseason in 37 times. That leaves 7, and now 8, instances where the team that hosted the Super Bowl also made the postseason. Let’s review, in descending order of likelihood of making that year’s Super Bowl.

#8: 2016 Houston Texans (Super Bowl LI played at NRG Stadium)

The Houston Texans made the playoffs last season, but the 9-7 Texans had a points differential of a 6.5-win team. Brock Osweiler and the Texans actually won their first playoff game, but it came against a Raiders team down Derek Carr and starting third string QB and rookie Connor Cook.  Houston lost as 16-point underdogs to New England in the Divisional Round, and was never a real Super Bowl threat.

#7: 1998 Miami Dolphins (Super Bowl XXXIII played at Pro Player Stadium)

The ’98 Dolphins went 10-6, but were never viable contenders for the Super Bowl. Miami lost the AFC East to the Jets and played in a conference with the eventual Super Bowl champion Broncos.  But Miami still had Dan Marino and young versions of Jason Taylor, Zach Thomas, and Sam Madison. After beating the Bills in the Wild Card round by stopping Buffalo on a last-minute goal-line stand, the Dolphins were trounced the following week in Denver, 38-3.

#6: 2000 Tampa Bay Buccaneers (Super Bowl XXXV played at Raymond James Stadium)

Tampa Bay made it to the NFC Championship Game the prior year, and went 10-6 in 2000 behind Shaun King and, more importantly, a dominant pass defense.  The Bucs made the playoffs as a Wild Card entrant, and had to travel to Philadelphia in the first round.  Playing in brutal weather with 11 degree wind chill, Tampa Bay was held to 199 yards and 3 points in a loss.

#5: 1994 Miami Dolphins (Super Bowl XXIX played at Joe Robbie Stadium)

The Dolphins won the AFC East and then beat Joe Montana and the Chiefs in the first round of the AFC playoffs. In the Divisional Round, the Dolphins went to San Diego to face an upstart Chargers team… and nearly blew San Diego out of the stadium. Miami took a 21-6 lead into the locker room, but the Chargers slowly chipped away at the lead.  San Diego threw a go-ahead touchdown in the final minute to complete the comeback and take a 22-21 lead.  A late pass interference penalty set Miami up for a 48-yard field goal and the win, but Pete Stoyanovich’s try was wide right, ending Miami’s season.

#4: 2014 Arizona Cardinals (Super Bowl XLIX played at University of Phoenix Stadium)

The Cardinals started the season 9-1, including a 6-0 mark under Carson Palmer. But Palmer tore his ACL against the Rams, turning the job over to Drew Stanton… who went 5-3 as a starter before suffering his own knee injury.  Arizona was a legitimate Super Bowl contender with Palmer and had a chance to win the #1 seed in the NFC and host all of their playoff games — including a potential Super Bowl.  But Ryan Lindley started the team’s Wild Card game against the Panthers, had one of the worst passing games in postseason history, and Arizona was one and done in the playoffs.

#3: 1978 Miami Dolphins (Super Bowl XIII played at the Orange Bowl)

The 1978 Dolphins went 11-5 and were one of just three teams (Pittsburgh, Dallas) to outscore their opponents by 100 points during the regular season.  Miami had the fewest giveaways in the NFL (30) and led the NFL with 53 takeaways. The Dolphins had a dominant interior line (Bob Kuechenberg, Jim Langer, Larry Little), an all-pro running back in Delvin Williams, and QB Bob Griese led the NFL in completion percentage and made the Pro Bowl.

The Dolphins were 6.5-point road favorites in Houston in the Wild Card round.  In the regular season, a rookie Earl Campbell arrived on the national scene with 199 yards and 4 touchdowns in a 35-30 Monday Night football win in Miami. The playoff game was much lower scoring: the teams were tied at seven apiece heading into the fourth quarter, but the Oilers ultimately won, 17-9. Houston outgained Miami 455-209, and the Dolphins turnover luck ran out: Miami committed five turnovers, and had just one takeaway in the loss.

#2: 1970 Miami Dolphins (Super Bowl V played at the Orange Bowl)

The 1970 Dolphins were the baby version of the perfect team that went 17-0 two years later. Griese, Larry Csonka, Mercury Morris, and Jim Kiick were all in Miami and 25 years or younger. Wide receiver Paul Warfield was also in town, and in the prime of his playing career.  Miami went 10-4 but finished the season on a 6-game winning streak, including a 34-17 win over Johnny Unitas and the eventual Super Bowl champion Colts.

In the Divisional Round of the playoffs, the Dolphins traveled to Oakland to face the Raiders.  Miami was burned by two big plays: Willie Brown had a 50-yard pick six to give Oakland a 14-7 lead in the third quarter, and Daryle Lamonica hit Rod Sherman for an 82-yard bomb early in the fourth. The Dolphins responded with a touchdown drive, but trailing 21-14, Miami’s two-minute drill ended — and Super Bowl hopes — ended on downs.

#1: 2017 Minnesota Vikings (Super Bowl LII played at U.S. Bank Stadium)

The Vikings finished the regular season 13-3 and have earned a playoff bye and the #2 seed in the NFC.  With #1 seed Philadelphia’s starting quarterback Carson Wentz out for the rest of the season, the Vikings are the clear conference favorites according to Vegas to make it to the Super Bowl. Minnesota ranked 4th in DVOA, and Football Outsiders give the Vikings a 30% chance of making the Super Bowl, the highest of any NFC team. And if the Eagles lose in the Divisional Round, Minnesota won’t leave the state at all during the postseason.

Minnesota allowed just 252 points this year, the fewest in the NFL. DE Everson Griffen, OLB Anthony Barr, and CB Xavier Rhodes made the Pro Bowl; safety Harrison Smith had 5 interceptions and is the #1 safety in the NFL according to Pro Football Focus.  The Vikings have stars at every level of the defense, and are equally dominant against both the run and the pass.

On offense, Minnesota is short on name power but undrafted stars Case Keenum and Adam Thielen lead en efficient and productive attack. Minnesota has beaten the NFC West (Rams) and NFC South (Saints) champions this year, and the Vikings are 7-1 at U.S. Bank Stadium this year. The Vikings have as good a chance as any team has ever had to not only play in, but win, the Super Bowl in their home stadium.

{ 12 comments }

Case Keenum, Adam Thielen, and Undrafted Passing Games

All 32 teams passed on Keenum and Thielen many times.

The Minnesota Vikings have a pretty good passing game: through 14 weeks, the Vikings rank in the top 10 in both ANY/A and passer rating. What makes it really weird is that the top two members of the passing game — the quarterback and leading receiver — were both undrafted free agents. Case Keenum went undrafted in 2012 after a stellar career at the University of Houston. The Vikings leading receiver is Adam Thielen, who went undrafted in 2013 out of Minnesota State–Mankato. Together, they are the driving force behind the 2017 Vikings efficient passing attack.

The Vikings will become just the 7th team since 1970 with their top passer and top receiver both having gone undrafted.

  • The 2014 Browns had Brian Hoyer and Andrew Hawkins, although unlike the Vikings, this team wasn’t very good. Cleveland went 7-9 (which is of course, very good for Cleveland) and ranked 23rd in ANY/A.
  • The 2009 and 2010 Cowboys make the list, too, thanks to Miles Austin and a pair of quarterbacks. In 2009, Tony Romo and the Cowboys ranked 4th in ANY/A and went 11-5; the next year, with Romo hurt, Jon Kitna led Dallas in passing but the team went 6-10 and ranked 12th in ANY/A.
  • In 2004, the Titans passing attack was led by Billy Volek and Drew Bennett. For a short run, the combination was outstanding, but overall, the Titans finished 19th in ANY/A and 5-11.
  • In 2000, Jay Fiedler and Orande Gadsen were the key components in a mediocre Miami passing attack. Those Dolphins teams were defined by their defense, and the Dolphins went 11-5 despite ranking 19th in ANY/A.
  • In 1992, Dave Krieg joined the Chiefs as a 34-year-old veteran. He was undrafted, as was Willie Davis, who had zero NFL catches to his name prior to the season. Davis wound up leading the Chiefs in receiving, and together, Krieg and Davis helped the Chiefs rank 8th in ANY/A and finish 10-6.

The table below shows all teams since 1970 where neither the quarterback nor the leading receiver (in receiving yards) were drafted within the first 200 picks. It is sorted by ANY/A rank that season:

TeamYearQBQB DraftWRTop WR DraftANY/A RkWn%
KAN1990Steve DeBerg275Stephone Paigeudfa10.688
MIN1988Wade Wilson210Anthony Carter33440.688
DAL2009Tony RomoudfaMiles Austinudfa40.688
HOU1989Warren MoonudfaDrew Hill32860.563
CLE1978Brian Sipe330Reggie Ruckerudfa60.500
HOU1992Warren MoonudfaCurtis Duncan25870.625
HOU1988Warren MoonudfaDrew Hill32870.625
CLE1976Brian Sipe330Reggie Ruckerudfa80.643
KAN1992Dave KriegudfaWillie Davisudfa80.625
HOU1987Warren MoonudfaDrew Hill32890.600
KAN1985Bill Kenney333Stephone Paigeudfa110.375
NWE2008Matt Cassel230Wes Welkerudfa120.688
DAL2010Jon KitnaudfaMiles Austinudfa120.375
TAM2003Brad Johnson227Keenan McCardell326130.438
KAN1989Steve DeBerg275Stephone Paigeudfa140.531
MIN1989Wade Wilson210Anthony Carter334150.625
SFO1980Steve DeBerg275Dwight Clark249150.375
NOR1971Ed Hargett397Danny Abramowicz420160.357
TAM1987Steve DeBerg275Gerald Carter240170.267
KAN1986Bill Kenney333Stephone Paigeudfa190.625
TEN2004Billy VolekudfaDrew Bennettudfa190.313
MIA2000Jay FiedlerudfaOronde Gadsdenudfa190.688
BUF2011Ryan Fitzpatrick250Steve Johnson224200.375
CLE1977Brian Sipe330Reggie Ruckerudfa200.429
ATL1986David ArcherudfaCharlie Brown201210.469
BUF2012Ryan Fitzpatrick250Steve Johnson224210.375
KAN1988Steve DeBerg275Stephone Paigeudfa220.281
HOU1985Warren MoonudfaDrew Hill328220.313
KAN1981Bill Kenney333J.T. Smithudfa220.563
CLE2014Brian HoyerudfaAndrew Hawkinsudfa230.438
MIN1987Wade Wilson210Anthony Carter334240.533
HOU1986Warren MoonudfaDrew Hill328240.313
NYG1978Joe PisarcikudfaJim Robinson367240.375
BUF2010Ryan Fitzpatrick250Steve Johnson224250.250
DET1989Bob Gagliano319Richard Johnsonudfa250.438
DEN1982Steve DeBerg275Steve Watsonudfa260.222
ATL1985David ArcherudfaBilly Johnson365270.250
NYG1977Joe PisarcikudfaJim Robinson367270.357
SFO2004Tim Rattay212Eric Johnson224290.125
NYJ2016Ryan Fitzpatrick250Quincy Enunwa209300.313
CIN2008Ryan Fitzpatrick250T.J. Houshmandzadeh204310.281

There are, unsurprisingly, a few combinations that show up multiple times on the list. Warren Moon and Drew Hill were the key parts of the Oilers passing game for five straight years in the back half of the ’80s. Wade Wilson and Anthony Carter made the list for their work with the Vikings in ’87, ’88, and ’89. Steve DeBerg and Stephone Paige did it with the Chiefs from ’88 to ’90. Ryan Fitzpatrick and Steve Johnson led the Bills in passing and receiving, respectively, in 2010, 2011, and 2012. And Brian Sipe and Reggie Rucker led the Browns in ’76, ’77, and ’78.

What stands out to you?

{ 6 comments }

Blair Walsh In Perspective: Game-By-Game EPA

Minnesota Vikings kicker Blair Walsh was released by the Vikings this week, and given his struggles this year, it’s hard to argue with Minnesota’s decision. Walsh will be infamously remembered for missing a chip shot in the playoffs against the Seahawks last year, and those demons have carried over to his 2016 performance.

How much so? I looked at every kick of Walsh’s career, beginning in his rookie season of 2012. For every made extra point in 2012, 2013, or 2014, I gave him +0.01 points, and +0.06 points for every made extra point in 2015 or 2016. Then, for every miss, he received -0.99 or -0.94 points, as applicable.

Extra points were easy; field goals were slightly harder. The graph below shows the average success rate on field goals in 3-year increments, from 2012 to week 10 of 2016:

fg-exp

I used those numbers to give Walsh points for each field goal attempt, too. For example, 48-50 yard kicks have been made 70% of the time over the last five years, so if Walsh attempted a 49-yard field goal, I gave him +0.9 points if he made it, and -2.1 points if he missed it.

Using that methodology, here is how Walsh has fared in every regular season game of his career:

walsh-fg

As a rookie, Walsh was at +11.4 in this system, and would be even higher if I era-adjusted in sample (for convenience, I treated 2012 games the same as 2015 games, which probably is not appropriate). In 2016, he had -7.1 points by this system, including two miserable games in weeks 1 (missed extra point, missed 37-yarder, missed 56-yarder) and 9 (missed extra point, missed 46-yarder in a game the Vikings lost in overtime).

{ 11 comments }

This week at the Washington Post, a preview of the Seahawks/Vikings game.

The Seahawks are a little tougher to categorize, because they excel in every facet of the game but have a worse record than Minnesota. By most non-traditional measures, the Seahawks are much better than a typical No. 6 seed. Seattle ranks second in Pro-Football-Reference’s Simple Rating System, behind only the Arizona Cardinals. That’s the result of the No. 1 defense by SRS standards and the No. 3 offense. According to Football Outsiders, the Seahawks are the best team in football, with the No. 2 offense, No. 4 defense, and No. 3 special teams; Minnesota ranks 11th overall, courtesy of the 16th best offense, 14th best defense and fourth-ranked special teams. And, of course, Seattle is a 5-point road favorite on Sunday, implying that the Seahawks might be more than a touchdown better than the 11-5 Vikings on a neutral field. In short: Seattle is really good.

You can read the full article here.

{ 0 comments }

Seattle trades Percy Harvin to the Jets

When John Schneider sent a 1st round draft pick [1]And a little more. As it turned out, the Vikings drafted Xavier Rhodes, Jerick McKinnon, and Travis Bond with those picks. That looks even better today than it did a year and a half ago. to Minnesota for the right to pay Percy Harvin $67M over six years, it looked like a risky move that might pay off if a whole bunch of “ifs” came true. Today? After paying Harvin more than eighteen (18!) million dollars and getting little in return, the Seahawks are sending him to the Jets for a conditional pick (rumored to be a 2nd, 3rd, or 4th, depending on what exactly those conditions are). The 2012 transaction now looks like one of the worst trades in recent NFL history. What was Seattle thinking?

Let’s travel back in time to October 31, 2012. Would you be shocked to learn that Percy Harvin may have been the best wide receiver in football? To measure this, I looked at how all receivers had performed over the trailing 365 days. The table below shows the production for each receiver from week 9 of the 2011 season through week 8 of the 2012 season. I’ve also calculated each wideout’s fantasy points, with 0.5 points given for each reception, 0.1 points for each yard from scrimmage, and 6 points for each offensive touchdown. Since, due to bye weeks, some receivers could have played between 15 and 17 games, the table includes the 20 wide receivers with the most fantasy points but is sorted by FP/G: [continue reading…]

References

References
1 And a little more. As it turned out, the Vikings drafted Xavier Rhodes, Jerick McKinnon, and Travis Bond with those picks. That looks even better today than it did a year and a half ago.
{ 9 comments }

Mick Tingelhoff is the 2015 Senior Committee Nominee

Another HOF battery?

Another HOF battery?

Dermontti Dawson is the only Hall of Fame center to play in the NFL in the last 20 years. Go back 30 years, and the only other HOF centers are Mike Webster and Dwight Stephenson. Go back a few more years, and you only get to add Jim Langer. In fact, since 1975, the only teams to have Hall of Fame centers were the Steelers and Dolphins. [1]Yes, I know Webster’s career ended with the Chiefs and Langer’s with the Vikings. And that Bruce Matthews played a little bit of center, too.

Go all the way back to 1960, and the only other Hall of Fame centers to play in the NFL were Jim Ringo and Jim Otto. In other words, the Pro Football Hall of Fame has a center problem. And the nomination of Mick Tingelhoff for induction into the HOF is one small step towards fixing that problem.

This year, the Pro Football Hall of Fame has named Tingelhoff the 2015 Senior Committee Nominee.  Tingelhoff still needs to have 80% of the voters give him the thumbs up, but unlike other players, he won’t be “competing” against the rest of the field for the right to earn a bust. Tingelhoff’s candidacy will be handled via a simple yes or no vote.

Hall of Fame fans may wonder why I’m talking about the Senior nominee, because there are generally two nominees from the Senior Committee.  But things have changed for this year:

A bylaws modification to the selection process was approved earlier this month by which a Contributor – defined as an individual who has “made outstanding contributions to professional football in capacities other than playing or coaching” – will automatically be included among the annual list of finalists for election. The Contributor finalist will also be voted on for election independent of all other finalists.

The Hall of Fame’s Board of Trustees, in an effort to address the backlog of deserving Contributor candidates, also approved a temporary measure allowing for two Contributor finalists in years one (starting with the Class of 2015), three and five, of the next five years. In years two and four of that same period, there will be just one Contributor finalist. To keep the maximum number of nominees elected at no more than eight per year, the Senior finalists will be reduced from two to one per year in years one, three and five of the same five-year period. In years two and four and each year thereafter, there will be two Senior finalists.

[continue reading…]

References

References
1 Yes, I know Webster’s career ended with the Chiefs and Langer’s with the Vikings. And that Bruce Matthews played a little bit of center, too.
{ 29 comments }

Interesting tidbit from Peter King this week about how the Vikings nearly acquired Johnny Manziel:

As the picks went by, starting soon after the Rams chose at 13, Cleveland GM Ray Farmer worked the phones, trying to find a partner to move up from their second pick in the round (26th overall) to grab Manziel. He couldn’t find a fit. Finally, with less than three minutes to go in Philadelphia’s 22nd slot, Farmer heard this from an Eagles representative over the phone: “If you’re not gonna jump in here, we’re gonna trade the pick right now.” It’s cloudy what his offer had been to this point, but now he had to sweeten it, and he offered the 83rd pick overall, a third-rounder, in addition to their pick four slots lower than Philly. Done deal. The Eagles liked that offer better than an offer from Minnesota, because the Vikings would have been moving up from 40.

As discussed in my round 1 recap, the Eagles made out like bandits picking up the 83rd pick to move down four spots. Not only did Philadelphia received 137 cents on the dollar according to my trade chart, but the Jimmy Johnson trade chart — which overvalues high picks and therefore cautions against trading down — had the Eagles receiving 112 cents on the dollar. [continue reading…]

{ 2 comments }

Predictions in Review: NFC North

During the 2013 offseason, I wrote 32 articles under the RPO 2013 tag. In my Predictions in Review series, I review those preview articles with the benefit of hindsight. Previously, I reviewed the AFC West, the NFC West, the AFC South, the NFC South, and the AFC North. Today, the NFC North.

The Detroit Lions will win more games in 2013, June 21, 2013

In 2012, Detroit finished 4-12, but they seemed like an obvious pick to have a rebound season. The Lions went 3-9 in games decided by 8 or fewer points that year, which was the worst mark in the league. Since such a poor record is usually a sign of bad luck rather than bad skill, Detroit wouldn’t need to do much to improve on their 4-win season. The Lions had 6.4 Pythagorean wins, and no team fell as far short of their Pythagorean record in 2012 as Detroit. There was one other reason I highlighted as to why Detroit would win more games in 2013: the Lions recovered only 33% of all fumbles that occurred in Detroit games. As a result, the team recovered 7.6 fewer fumbles than expected.

Of course, none of this was a surprise: Vegas pegged Detroit as an average team entering the season. And even though the Lions did finish 7-9, a three-win improvement wasn’t enough to save Jim Schwartz’ job. After a 3-9 record the year before, the 2013 Lions went 4-6 in games decided by 8 or fewer points, which included losses in the team’s final three games.  Detroit did improve when it came to fumble recoveries, but only slightly: the Lions recovered 42.6% of all fumbles in their games in 2013, which was 3.6 recoveries fewer than expected.

What can we learn: When it comes to records in close games and fumble recovery rates, we should expect regression to the mean.  Last year, the Colts (6-1) and Jets (5-1) had the best records in close games; Andrew Luck has been doing this for two years now, but no such benefit of the doubt should be given to the Jets. Meanwhile, Houston (2-9) and Washington (2-7) had the worst records in close games. All else being equal, we would expect both of those teams to improve on their wins total in 2014 (for the 2-14 Texans, it will take some work not to win more games in 2014; and, of course, such rebound seasons are already baked into the Vegas lines).

As far as fumble recovery rates, well, that’s one area where the Jets are hoping for some regression to the mean.

The 2012 Chicago Bears had the Least Strange Season Ever, August 2, 2013

Here’s what I wrote about the 2012 Bears:

The 2012 Bears played two terrible teams, the Titans and the Jaguars. Those were the two biggest blowouts of the season for Chicago. The Bears had five games against really good teams (Seattle, San Francisco, Houston, and the Packers twice): those were the five biggest losses of the season. Chicago had one other loss, which came on the road against the next best team the Bears played, Minnesota.

But the Bears didn’t just have a predictable season. That -0.89 correlation coefficient [between Chicago’s opponent’s rating and location-adjusted margin of victory] is the lowest for any 16-game season in NFL history. In other words, Chicago just had the least strange season of the modern era.

This post was not about predicting Chicago’s 2013 season but analyzing a quirky fact I discovered. The Bears struggled against the best teams in 2012, and that cost Lovie Smith his job. In 2013, Chicago’s season was much more normal; in fact, the Bears had a slightly “stranger” season than the average team.

The Bears did manage to defeat the Bengals and Packers (without Aaron Rodgers), but Chicago still finished below .500 against playoff teams thanks to losses to New Orleans, Philadelphia, and Green Bay (with Aaron Rodgers). After a 2-6 performance against playoff teams in 2012, I suppose a 2-3 record is an improvement. But the irony is that the reason Chicago’s season was less normal in 2013 wasn’t due to better play against the best teams, but because Chicago lost to Minnesota and Washington. In the first year post-Lovie, the Bears missed the playoffs because they lost to two of the worst teams in the league, causing them to miss out on the division title by one half-game. Here’s one stat I bet Lovie Smith knows: from 2005 to 2012, Chicago went 30-0 against teams that finished the season with fewer than six wins. As for which teams had the strangest and least strangest seasons in 2013? Check back tomorrow.

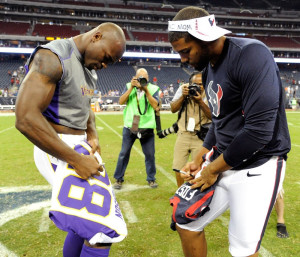
Can Adrian Peterson break Emmitt Smith’s rushing record?, August 3, 2013

What a difference a year makes. Eight months ago, the debate regarding whether Adrian Peterson could break Smith’s record was a legitimate talking point. After a “down” season with 1,266 yards in 14 games, nobody is asking that question anymore. Of course, Peterson never had much of a chance of breaking the record anyway, which was the point of my post. Not only had Smith outgained him Peterson through each of their first six seasons, and not only did Smith enter the league a year earlier than Peterson, but Emmitt Smith was also the leader in career rushing yards after a player’s first six seasons.

Peterson just turned 29 years old. He ranks sixth in career rushing yards through age 28, but Smith has a 1,119 yard advantage when it comes to rushing yards through age 28. Barry Sanders has them both beat, of course, but he retired after his age 30 season. The problem for Peterson? He needs to run for 8,241 yards during his age 29+ seasons to break Smith’s record. The career leader in yards after turning 29 is Smith with 7,121 yards.

What can we learn: Unless Peterson finds the fountain of youth, Smith’s record won’t be challenged for a long, long time.

Witnesses to Greatness: Aaron Rodgers Edition, August 30, 2013

In late August, I wondered if we had taken Rodgers’ dominance for granted. After all, he had a career passer rating of 104.9, the best ever. Then in 2013, he produced a passer rating of … 104.9, the fifth best mark among qualifying passers.

Passer rating stinks, as we all know, but Rodgers is dominant in nearly every metric. If we break passer rating down into its four parts we see:

  • Entering 2013, Rodgers was the career leader in completion percentage. Drew Brees now holds a 0.1% edge over Rodgers in this category. Rodgers completed 66.6% of his passes last year, the 5th best mark of 2013.
  • Rodgers was the career leader in interception rate entering 2013, and still holds that crown. Believe it or not, his 2.1% interception rate last year ranked only 12th.
  • With a 5.9% touchdown rate in 2013 (5th best), he remains the active leader in touchdown percentage. Everyone ahead of him on the career list began their career before 1960.
  • Rodgers was the active leader in yards/attempt prior to 2013, and then he had another dominant year by producing an 8.7 average (2nd best). He’s now widened his lead in this metric and should remain the active leader for the foreseeable future.

What can we learn: That Rodgers is the man? Of course, this year we got to see that first-hand. The Packers went 6-3 in Rodgers’ 9 starts and 2-4-1 without him, but remember, he threw just two passes in his Bears start, which the Packers lost. Count that as a non-Rodgers game, and Green Bay went 6-2 with him and 2-5-1 without him. From there, one might infer that he added 3.5 wins to the Packers last year, tied for the 4th most ever from a quarterback relative to his backups.

The only area where Rodgers struggles is with sacks, and it’s worth remembering that all of his other rate stats are slightly inflated because they do not include sacks in the denominator. He’s still the man, of course, but sacks, era adjustments, and the fact that he isn’t done producing top seasons is why he “only” ranked 12th and 14th on these lists.

{ 1 comment }

When I went on the Advanced NFL Stats Podcast in late December, I discussed my use of Z-scores to measure the Seattle pass defense. Host Dave Collins asked me if I was planning on using Z-scores to measure other things, like say, Adrian Peterson’s 2012 season. I told him that would be an interesting idea to look at in the off-season.

Well, it’s the off-season. So here’s what I did.

1) For every season since 1932, I recorded the number of rushing yards for the leading rusher for each team in each league. So for the Minnesota Vikings in 2012, this was 2,097.

2) Next, I calculated the average number of rushing yards of the top rusher of each other team in the NFL. In 2012, the leading rusher on the other 31 teams averaged 974 yards.

3) Then, I calculated the standard deviation of the leading rushers for all teams in the NFL. In 2012, that was 386 yards.

4) Finally, I calculated the Z-score. This is simply the difference between the player’s average and the league average (for Peterson, that’s 1,123), divided by the standard deviation. Peterson’s Z-score was 2.91, good enough for 15th best since 1932. The table below shows the top 250 seasons using this method from 1932 to 2013; it’s fully searchable and sortable, and you can change the number of entries shown by using the dropdown box on the left. [continue reading…]

{ 7 comments }

Two house-keeping notes before we get to today’s post. First, today’s a pretty big day for our friend Neil Paine: he’s getting married. I’ll be there to celebrate with him in Philadelphia, but I know you guys will be with us in spirit. Congrats to Kaitlyn and Neil!

And another set of confetti must be reserve for the seven members of the Pro Football Hall of Fame Class of 2013: Larry Allen, Cris Carter, Jonathan Ogden, Warren Sapp, Curley Culp, Dave Robinson, and Bill Parcells. Tonight, those men will be inducted into the Hall of Fame, a must-see event for any football fan.

Today’s post focuses on one player already enshrined in Canton and one future Hall of Famer. As a general disclaimer, it’s best not to take too seriously what comes out of the mouths of football players, especially this time of year. That said, Adrian Peterson, part-cyborg, part-Minnesota Vikings running back, recently told Dan Wiederer of the Minneapolis Star Tribute that he thinks he will break Emmitt Smith’s career rushing record:

Q Forget about Eric Dickerson’s record for a minute. Last December, we talked about Emmitt Smith’s record and I told you you were on pace to get there in Week 4 of 2019. You said sooner and promised to come back with a timetable. Emmitt had 18,355 yards. You’re now 9,506 away. We need a week and a year. When do you get there?

A Man. Oh boy. I have to do some calculations. I’ve been in the league seven years. I’m already right around [9,000]. Calculate it out … Let’s think. Maybe get a couple 2,000 yard seasons … I’ve got … Hmmm … 2017.

Q What week in 2017?

A Man. I better go late. I’m already getting too far in front of myself. I’ll say Week 16. There it is. Week 16 in 2017. Whoo. That’s pushing it, huh? But hey, pushing it is the only way to do it. You know it.

Just to break it down for you in full, that gives Peterson 79 games to amass the 9,506 yards he needs to reach Smith. That comes out to a per-game average of 120.3 yards per contest with the assumption that Peterson avoids injury and doesn’t miss a game between now and Week 16 of 2017. Yes, it’s pushing it indeed. But good fun to consider, right?

Let’s talk reality. Peterson has rushed for 8,849 rushing yards in his six-year career, and was 27-years-old last year. The first problem for Peterson is that he was 937 yards behind Smith’s pace before Peterson even entered the league. That’s because Peterson, born in March, entered the league at 22, while Smith, born in May, entered at age 21. Unless you think we should compare the two by seasons and not age — and more on why that’s a bad idea later — we need to give Smith full credit for one extra year. In fact, here’s a chart comparing the two players in career rushing yards through age X. Smith also rushed for slightly more yards from ages 22 to 27 (9223-8849) than Peterson, but when you factor in his age 21 performance, Smith has a big lead on Peterson through age twenty-seven. You might recall I presented a similar chart when comparing Jason Witten to Tony Gonzalez and Jerry Rice.
[continue reading…]

{ 14 comments }

Season in review: AFC and NFC North

On Monday, I examined the seasons of the teams in the AFC and NFC East. Today I will do the same for the AFC and NFC North, starting in the AFC.

AFC North

Pittsburgh Steelers

Pre-season Projection: 10 wins
Maximum wins: 11 wins (after weeks 2, 5, and 9)
Minimum wins: 8 (after week 16)
Week 1 comment: Sunday Night was one of the best games I’ve seen from Ben Roethlisberger. An elite team that will be favored to win most weeks, although questions remain about the offensive line, the running backs, and the age of the defense.

Pittsburgh started off 6-3 and looked like a contender, but tanked in the second half of the season once Roethlisberger went down. Even when Roethlisberger returned, the offense never quite looked right. Jonathan Dwyer, Isaac Redman, and Rashard Mendenhall were unexciting plodders, which is an improvement over the 25 carries that went to Baron Batch. No Steeler finished the season with more than two rushing touchdowns. In the passing game, Mike Wallace and Antonio Brown both failed to match last year’s lofty numbers. The potential was there, but the results were not in Pittsburgh in 2012.

On the other side of the ball, Pittsburgh’s defense performed well by conventional measures — through week 16 (which is when they were knocked out of the playoff race), they ranked 1st in yards allowed and first downs allowed, and ranked 2nd in net yards per attempt allowed, rushing yards and rushing yards per carry allowed. But the defense wasn’t really up to Steelers standards — through week 16, they ranked 10th in points allowed and, more damningly, had forced more turnovers than just three teams. Pittsburgh allowed 5 4th quarter game-winning drives, which ultimately cost them the playoffs.

Baltimore Ravens

Pre-season Projection: 10 wins
Maximum wins: 11 wins (first after week 3, last after week 13)
Minimum wins: 9 wins (after week 15)
Week 1 comment: Great performance on Monday Night, but I have to imagine missing Terrell Suggs is going to hurt this team. He’s too good to simply expect business as usual in Baltimore, and their schedule (AFC West, NFC East, Houston, New England outside the division) is riddled with traps.

The schedule was riddled with traps, but the Ravens rode some late-game success and excellent special teams to a 9-2 record. At that point, I wrote: I still don’t believe in this team, because they aren’t going to have amazing special teams or amazing 4th and 29 conversions every week.

Joe Flacco had a solid but not great year, while Ray Rice continued to prove effective when given the carries. The big issue for Baltimore was defensively. Through 16 weeks, the Ravens ranked 20th in yards allowed, 18th in NY/A, and 24th in first downs allowed. While the Ravens won the North, 8 games out of Terrell Suggs, 6 games of Ray Lewis, and 6 games of Lardarius Webb simply wasn’t enough to give them the defense Ravens fans were used to seeing.
[continue reading…]

{ 0 comments }

Adrian Peterson’s amazing, except when the Vikings win

Adrian Peterson is having an incredible season. He’s likely to hit the 2,000-yard mark on Sunday, and he’s also chasing Eric Dickerson’s single-season rushing record. But his splits this year are…interesting.

The table below shows Adrian Peterson’s game logs. These display his traditional statistics, along with his Win Probability added, Expected Points Added, and Success Rate, all courtesy of Advanced NFL Stats; finally I have added the Vikings SRS score for that particularly game (on the season, Minnesota has an SRS of +3.0).

G#OppW/LScoreRshYdsYPCTDRecYdsWPAEPASR(%)SRS
1JAXW26-2317844.9230.172.550-12.2
2INDL20-2316603.8020-0.02-2.240-5.7
3SFOW24-1325863.4021-0.1-2.433.318.3
4DETW20-13211024.90200.051.8407.5
5TENW30-717885.2015-0.12-1.533.39.3
6WASL26-3817794.6050-0.061.642.3-5.9
7ARIW21-14231536.7160.120.433.30.8
8TAML17-36151238.214-0.070.743.8-22.9
9SEAL20-301718210.72110.379.552.45.7
10DETW34-24271716.3150.04-0.7254.5
11CHIL10-28181086030-0.030.860-7.8
12GNBL14-2321210101100.4210.443.51.5
13CHIW21-143115452160.242.345.511.2
14STLW36-22242128.8100.216.945.816.8
15HOUW23-625863.404-0.1-525.924.5
Total31418986112151.1225.140.23

A robot and a vegan walk into a bar...

A robot and a vegan walk into a bar...

Peterson has only had two games this season where he averaged fewer than 3.5 yards per carry. Those two games were, without question, the two most impressive wins of the year for the Vikings. Peterson had identical stat lines of 25 carries/86 yards/0 touchdowns in shocking upsets over the 49ers and Texans.
[continue reading…]

{ 2 comments }