≡ Menu

Yesterday, I looked at the way each team’s roster was concentrated in terms of salary cap dollars.  A few teams, like the Giants, Lions, and Vikings, were notable for allocating a significant portion of their 2019 salary cap dollars to their top players.  Meanwhile, the Jets, Bills, and Browns were on the other end of that spectrum.

Of course, the Jets, Bills, and Browns all drafted quarterbacks in the first round of the 2019 Draft, while the Giants, Lions, and Vikings are all paying big dollars to veteran quarterbacks. How would the data look if we excluded the top (by salary cap dollars) quarterback on each team?

I re-ran those numbers today.  Once again, we will be using the Concentration Index, described here, to “grade” each team’s roster construction. To summarize, we do the following steps:

1) Calculate the 2019 salary cap hit of the top 51 players on each team’s roster. Thanks to Over The Cap, I was able to collect this information.  Eliminate the highest paid QB on each team’s roster.

2) For each player on each team, calculate the percentage of team salary cap dollars spent on that player. For example, Denver’s Von Miller has a 2019 cap hit of $25.1M, and the Broncos top 50 players (excluding QB Joe Flacco) have a cap hit of $142M. Therefore, Miller is taking up 17.7% of Denver’s non-Flacco 2019 cap spend.

3) Square the result for each player (so Miller’s 17.7% becomes 3.1%), and then sum those results for each player on each team to get team grades.

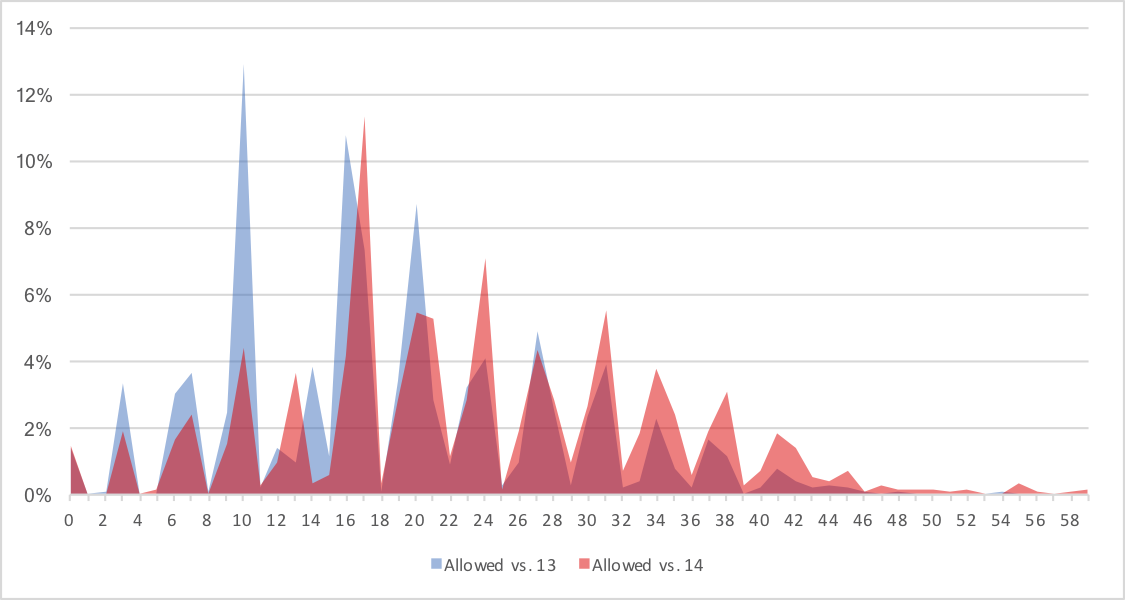
By squaring the results, you give more weight to players taking up a larger percentage of their team’s pie.   The graph below shows each team.  The X-Axis shows the 2019 Salary Cap dollars each team spent on their 50 highest paid players, excluding their top quarterback.  The Y-Axis is the concentration index result.  The Broncos are at the top of the chart, thanks in large part due to Miller.  Ignoring Flacco, Denver’s top 6 players (Miller, Emmanuel Sanders, Derek Wolfe, Ronald Leary, Chris Harris, Jr., and newly-added Ja’Wuan James) are being paid $75M 2019 cap dollars, while the Broncos bottom 37 players (in their top 51) are being paid just $35.3M. That’s an extreme “studs and duds” approach that becomes even more clear once you remove all top-paid quarterbacks. [continue reading…]

{ 1 comment }

I like to run a contest where I ask you 38 questions, you answer them, and we all look silly after the season. This year, Adam Steele did the lion’s share of the work, and we thank him for that.

Below you will find 38 pairs of numbers. In each case, you tell me which number will be bigger. One point for each correct answer. Most points wins.

Ties — and I expect there to be a nontrivial number of them — go to the side that had fewer votes. For example, here is a pair:

Number of wins by the Lions
Number of wins by the Ravens

Let’s say 49 people take the Lions and 44 take the Ravens. If the Lions and Ravens end up with the same number of wins, then each Ravens-backer will get a point and each Lions-backer will not. Last year, JimZornsLemma won with 25 correct guesses out of 38; the average was just 19 correct guesses. Thanks to Jeremy De Shetler for an assist on some of this year’s questions.

GRAND PRIZE: the main prizes will be (1) honor and (2) glory. There may also be some sort of trinket to be named later. By the time this thing is over, more than five months will have passed, so that gives me some time to scrape something together. But you probably shouldn’t enter unless honor and glory are sufficient.

MORE RULES:

1. Everyone is limited to one entry per person. This will be enforced by the honor system. If caught breaking this rule, you, your children, and your children’s children will be banned from all future FP contests.

2. I won’t enter the contest myself, which will allow me to arbitrate any dispute impartially. Any ambiguity in the rules will be clarified by me in whatever way causes me the least amount of hassle.

3. While there are quite a few items that refer in some way to the NFL postseason, unless specifically stated, all the items below refer to regular season totals only.

5. You may enter until 1:00 p.m. Eastern time on Sunday, September 9th, 2018. However, there’s an incentive to entering early because…

6. In the event that the contest ends in a tie, the winner will be the person whose entry was submitted first. [continue reading…]

{ 0 comments }

Analyzing Third Down Passes From 1997 to 2017

How has the NFL evolved when it comes to third down passing? Using the PFR Play Index, I looked at all passes on third downs in each season from 1997 to 2017 that met the following criteria:

  • The play came during the regular season.
  • The pass happened in the first three quarters of the game to minimize the effects of game situation, as 4th quarter passes may be different than passes earlier in the game (although that’s worth investigating, too!).
  • The team on offense was down by no more than 14 points or up by no more than 14 points, to again minimize the effects of game situation.
  • The distance was between 5 and 10 yards to go, to isolate obvious passing situations but not hopeless ones.

What were the results? What do you *think* the results would be? [continue reading…]

{ 12 comments }

Back in November 2006 (I have been writing on the internet for too long!), I wrote that teams that scored 13 points had a better winning percentage than teams that had scored 14 points. That post was in response to an insightful eye from regular commenter Bill M., who first noticed the discrepancy. A few days later, Doug expounded on the topic, and came up with a couple of possible explanations.

As it turns out, this phenomenon still hold. From 1970 to 2017 (postseason included), teams that scored exactly 13 points in a game have a 308-871-10 record, for a winning percentage of .263. Over that same period, teams that scored 14 points went just 221-991-4, which translates to a .183 winning percentage.

Are you wondering if this is a relic of an older era? Well, over the last 10 seasons, teams that scored exactly 13 points went 44-206-2 (.179), while teams that scored 14 points went 26-181-0 (.126). In addition, since 2008, teams that scored 20 points (13 + a touchdown) have a 147-221 record (.399), which is a lot better than teams that scored exactly 21 points (14 + a touchdown), who have an ugly 50-117 mark (.299). The same rule holds even more strongly for 27 points (228-80-2, for a .739 winning percentage) vs. 28 points (88-58, or .603).

So, what gives? Let’s stick to the 13 and 14 point situations and begin with an experiment. There have been 138 games from 1970 to 2017 that ended in a score of 13-10. Knowing that, how many games do you think had a final score of 14-10?

I’ll give you the answer in moment, but let’s start with the obvious note: despite the small number of games that end in a 14-13 score, we know that teams that score exactly 13 points win more games than teams that score exactly 14 points. This means, of course, that teams that score 13 points must hold opponents to under 13 points at a higher rate than teams that score 14 points hold opponents to under 14 points, because #math. It’s true that, on average, teams that score 13 points allow fewer points – for whatever reason – than teams that score 14 points. Does that help inform your guess?

As it turns out, just 52 games have ended in a 14-10 final score. Such a result is so rare that in the last 5 years, it’s happened just once: in a Dolphins/Rams game that was 10-0 with 5 minutes left and 10-7 with one minute remaining. So while it’s a tautology, what’s driving this weird result is that teams score 13 points allow fewer points than teams that score 14 points.

Is there something special about 13 points relative to 14 points that’s driving that result? If so, presumably it’s related to 13 points being most often resulting from a touchdown and two field goals, while 14 points typically coming from two touchdowns. Therefore, I looked at all games where teams scored exactly 13 or 14 points by only one way for each score: two field goals, one touchdown, and an extra point, or two touchdowns with two extra points.

In those cases, from 1970-2016 (I don’t have 2017 data incorporated yet), teams that have kicked two field goals and scored one touchdown (with one extra point) are 291-722-10 in 1,023 games, for a 0.289 winning percentage. Meanwhile, teams that scored two touchdowns and two extra points and nothing else went 213-942-4 in 1,159 games, for a 0.186 winning percentage.

The graph below shows the points allowed by teams in these situations on a percentage basis. For example, when teams score 13 points by one touchdown and two field goals, they have allowed just 10 points about 13% of the time; conversely, teams that score 14 points from 7+7 allow only 10 points about 4% of the time.

Teams that score 13 points are much more likely to allow just 3, 7, or 10 points.

So what’s going on here? Part of it, I think, is that teams down 31-7, they aren’t going to kick a field goal late in the game, but if the score is 10-10, they will attempt a field goal.

What do you think? What other studies would you want to run?

{ 27 comments }

Right now, three of the top 20 running backs in career receptions are active: Matt Forte, Darren Sproles, and Reggie Bush. Note that for these purposes, players like Bobby Mitchell, Charley Taylor, and Eric Metcalf — who all entered the league as running backs but then converted to wide receiver — were excluded.

Games Rushing Receiving
Rk Player From To Draft G GS Att Yds Y/A TD Y/G Tgt Rec
Yds Y/R TD Y/G Ctch% Y/Tgt
1 Larry Centers 1990 2003 5-115 198 108 615 2188 3.56 14 11.1 1044 827 6797 8.22 28 34.3 6.51
2 Marshall Faulk* 1994 2005 1-2 176 156 2836 12279 4.33 100 69.8 1013 767 6875 8.96 36 39.1 75.7% 6.79
3 LaDainian Tomlinson 2001 2011 1-5 170 155 3174 13684 4.31 145 80.5 868 624 4772 7.65 17 28.1 71.9% 5.50
4 Keith Byars 1986 1998 1-10 189 160 865 3109 3.59 23 16.4 428 610 5661 9.28 31 30.0 13.23
5 Marcus Allen* 1982 1997 1-10 222 168 3022 12243 4.05 123 55.1 241 587 5411 9.22 21 24.4 22.45
6 Tiki Barber 1997 2006 2-36 154 109 2217 10449 4.71 55 67.9 814 586 5183 8.84 12 33.7 72.0% 6.37
7 Ronnie Harmon 1986 1997 1-16 181 27 615 2774 4.51 10 15.3 462 582 6076 10.44 24 33.6 13.15
8 Roger Craig 1983 1993 2-49 165 133 1991 8189 4.11 56 49.6 62 566 4911 8.68 17 29.8 79.21
9 John Williams 1986 1995 1-15 149 133 1245 5006 4.02 18 33.6 316 546 4656 8.53 19 31.2 14.73
10 Eric Metcalf 1989 2002 1-13 179 77 630 2392 3.80 12 13.4 635 541 5572 10.30 31 31.1 8.77
11 Herschel Walker 1986 1997 5-114 187 137 1954 8225 4.21 61 44.0 296 512 4859 9.49 21 26.0 16.42
11 Earnest Byner 1984 1997 10-280 211 131 2095 8261 3.94 56 39.2 275 512 4605 8.99 15 21.8 16.75
13 Warrick Dunn 1997 2008 1-12 181 154 2669 10967 4.11 49 60.6 710 510 4339 8.51 15 24.0 71.8% 6.11
14 Walter Payton* 1975 1987 1-4 190 184 3838 16726 4.36 110 88.0 492 4538 9.22 15 23.9
15 Tony Galbreath 1976 1987 2-32 170 73 1031 4072 3.95 34 24.0 490 4066 8.30 9 23.9
16 Matt Forte 2008 2015 2-44 120 120 2035 8602 4.23 45 71.7 636 487 4116 8.45 19 34.3 76.6% 6.47
17 Curtis Martin* 1995 2005 3-74 168 166 3518 14101 4.01 90 83.9 606 484 3329 6.88 10 19.8 79.9% 5.49
18 Darren Sproles 2005 2015 4-130 153 23 577 2867 4.97 20 18.7 631 473 4156 8.79 28 27.2 75.0% 6.59
19 Thurman Thomas* 1988 2000 2-40 182 160 2877 12074 4.20 65 66.3 416 472 4458 9.44 23 24.5 10.72
20 Reggie Bush 2006 2015 1-2 121 96 1274 5493 4.31 35 45.4 652 470 3508 7.46 18 29.0 72.1% 5.38

Sproles just turned 33, and entered the league back in 2005.  He was a rookie at 22, but as a late 4th round pick, he had just 42 career receptions before turning 26.

Bush was the second overall pick in ’06, of course, and he entered the NFL at just 21.  He got off to a blazing start, tying the NFL record for receptions through two seasons set by Larry Fitzgerald. [1]By the end of that season, his teammate Marques Colston broke that record, and A.J. Green, Odell Beckham, and Jarvis Landry have all since broken that Bush’s mark. But Bush has not maintain that level of play, and the future isn’t all that bright. He turned 31 in March, and just signed with the Bills, his 5th NFL team.  Bush had just 4 catches  in five games last year, before an ACL injury in St. Louis ended his season.

Forte, despite being only nine months younger than Bush, he entered the NFL two years later. Forte has been a mix of Bush and Sproles when it comes to the age curve: he started off strong, like Bush, but has aged well, like Sproles.  Forte had 223 receptions in his first four seasons in 60 games; In his last 4 years, he has also played in 60 games, and caught 264 passes.

Despite being the youngest of the three, Forte has the most career receptions.  Bush had more receptions last year, but given the age difference, Forte seems like the better bet to become the 5th running back — and only 3rd non-fullback — to hit the 600-reception mark.

References

References
1 By the end of that season, his teammate Marques Colston broke that record, and A.J. Green, Odell Beckham, and Jarvis Landry have all since broken that Bush’s mark.
{ 11 comments }

AV Retention Rates, 2014-2015

Last year, I looked at AV Retention Rates, a measure of how sticky a team’s composition was from year to year. We’ll get to the methodology in a minute, but let’s start with two examples.

Cincinnati was very consistent from 2014 to 2015. Andy Dalton was the quarterback both years, and Jeremy Hill, Giovani Bernard, and A.J. Green were the three leaders in yards from scrimmage in 2014 and again in 2015. The offensive line was unchanged, with Andrew Whitworth, Andre Smith, Clint Boling, Kevin Zeitler, and Russell Bodine as the main five in both years, although Smith and Zeitler missed some time in 2014. The big change on offense wasn’t external, either: it was the return from injury for both Tyler Eifert and Marvin Jones, which dropped Mohamed Sanu down in the pecking order.

On defense, Geno Atkins, Domata Peko, and Carlos Dunlap were starters on the defensive line both years, with Rey Maualuga manning the middle and Reggie Nelson and George Iloka at safety. Adam Jones and Leon Hall were two of the three cornerbacks to play 60%+ of defensive snaps in both years, with the main change in the secondary being being Dre Kirkpatrick replacing Terence Newman (Minnesota). On the line, the big change was the return of Michael Johnson from a one-year stint in Tampa, with Wallace Gilberry dropping from 73% of snaps to 58% as a result. And at linebacker, Maualuga, Vincent Rey, Vontaze Burfict, and Emmanuel Lamur were the four to see the most snaps in both 2014 and 2015, though the pecking order changed a bit.

In other words, the 2015 Bengals looked a whole lot like the 2014 Bengals. But in Washington, turnover was the story of the 2015 season. In 2014, Kirk Cousins started 5 games; last year, he started all sixteen. Matt Jones and Chris Thompson combined for over 50% of snaps at running back last year, reducing the heavier load endured by Alfred Morris in 2014. Tight end Jordan Reed caught 11 touchdowns and led the team in targets last year, but started two games and didn’t score in 2014.

On the offensive line, only LT Trent Williams was a holdover. With RG Chris Chester in Atlanta, 5th overall pick Brandon Scherff took over and started all 16 games. Morgan Moses, a third round pick in 2014 who started just one game as a rookie, took over at right tackle, relegating 2014 starter Tom Compton to the bench (he’s now in Atlanta with Chester). Kory Lichtensteiger (center) and Shawn Lauvao (left guard) both started in 2014, but were lost early in the season with injuries, putting Spencer Long (G) and Josh LeRibeus (C) into the lineup.

At safety, Ryan Clark, Brandon Meriweather, and Phillip Thomas were replaced by Dashon Goldson, Kyshoen Jarrett and Trent Robinson. At corner, Bashaud Breeland was the consistent presence year over year, but David Amerson (one of the lone blunders from Washington’s front office last year) and E.J. Biggers were replaced by Will Blackmon and DeAngelo Hall (limited to just 3 games in 2014). The front seven was relatively consistent year over year, though Jarvis Jenkins and Brian Orakpo were gone in 2015, with Preston Smith, Ricky Jean-Francois, Terrance Knighton coming on board. [continue reading…]

{ 13 comments }

Week Three (2015) Fourth Down Decisions In Review

Boldest Coach of the Week:

John Harbaugh’s Ravens were the only team to go for it on 4th down twice before the 4th quarter, as Baltimore converted a 4th-and-5 in the 3Q after going for it in the 2nd quarter on his own 27.  The latter decision was particularly bold: the Ravens were the only team to attempt a fourth down conversion in the first 20 minutes of the game, and going for it so close to a team’s own end zone is practically unheard of in the first half of games.   Harbaugh’s aggressiveness was rewarded, as Anthony Levine took a fake punt right end for 3 yards. On this play, fortune favored the bold: Cedric Peerman tackled Levine behind the line of scrimmage, but in the process, he caused Levine to fumble.  Levine fumbled forward and recovered, picking up the first down.

Half-Hearted Decision of the Week

Ken Whisenhunt wisely went for it on 4th-and-1 from the Indianapolis 4-yard line when up by 10 points with 20 minutes remaining.  That’s a smart decision, for many reasons, not the least of which is that being up by 13 can be a double-edged sword.  And while the Titans converted, Whisenhunt then kicked a field goal from the 3-yard line three plays later. That came back to bite Tennessee. The Colts scored two touchdowns to take the lead, and ultimately won by two points after a Titans failed on a two-point try in the final minute. [continue reading…]

{ 8 comments }

As explained last year, the NFL’s collective bargaining agreement provides that most rookies sign four-year contracts. But teams were granted a club option for a fifth year for all players selected in the first round. Note that the option is only guaranteed for injury, however, so a team can exercise the option for 2012 first round picks and still release the player at the end of the 2015 season.

For players in the top ten, that fifth year salary is equal to an average of the top ten highest-paid players at their position from the prior year. For players selected with picks 11 through 32 — and for the second straight year, the number 11 pick has produced one of the most valuable players from the class — the fifth-year deal is worth an average of the salaries of the players with the 3rd through 25th highest salaries at their position.

The deadline for exercising the fifth-year option on 2012 first rounders is May 3rd. As a reminder, here is a review of the first round of the 2012 Draft: [continue reading…]

{ 1 comment }

Last year, I wrote a post on the plays that had the biggest impact on the eventual Super Bowl champion. These were the plays that affected the Super Bowl win probability by the biggest amount among teams that did not win the title. At the time, the Buffalo Bills were on the short end of the most influential play in the Super Bowl era. When Frank Reich put the ball down for Scott Norwood, I estimated that the Bills had a 45% chance on winning the Super Bowl. [1]Recent research by Chase suggests something similar. After the kick went wide right, the Bills’ win probability fell to zero. The 45 percentage point fall was the biggest change for a non-champion of any play in the Super Bowl era. Over 48 years, a bunch of plays fell in that range, but no team could point to a single play as having lowered its championship chances by so large an amount.

A couple weeks ago, that long-held record got broken kind of like Michael Johnson broke the 200-meter record in the Atlanta Olympics. Malcolm Butler’s pick obliterated the old mark. My estimate has the Butler interception as increasing the Patriots’ chances of winning by 0.87. There is no doubt that what some have called the Immaculate Interception is on an island by itself as the most influential play in NFL history.

To get that change in win probability from Butler’s play, I am going to assume that the Seahawks would have run on third and fourth down. I am going to give a run from the one a 60% chance of working. That might seem high, but the Patriots were the worst team in football in stuffing the run in important short-yardage situations either on third or fourth down, or down by the goal line. And their limited success mostly came against terrible running teams. It is not a huge sample, but against teams outside the worst quarter of rushing teams by DVOA, the Patriots had allowed opponents to convert 16 of 17 times with two yards or less to go for a first down or touchdown. If we add the playoffs, they actually had three more stops against good running teams (Baltimore and Seattle), albeit in games where the opponent had a good amount of success on the ground. [2]Note that the stop against Baltimore should not even count. In an otherwise great game for Gary Kubiak, he called for a reverse to Michael Campanaro on third-and-1 in the second quarter. The run was … Continue reading With Seattle being the best rushing team in football by a mile and the Patriots being at best not great in run defense in that situation, it seems hard to think that Seattle had anything less than a 0.60 chance of scoring on a run. [continue reading…]

References

References
1 Recent research by Chase suggests something similar.
2 Note that the stop against Baltimore should not even count. In an otherwise great game for Gary Kubiak, he called for a reverse to Michael Campanaro on third-and-1 in the second quarter. The run was stopped for a loss. The Patriots basically could not stop Justin Forsett, making the reverse call very unnecessary.
{ 31 comments }
Mike Smith, thinking about kicking or punting.

Mike Smith, thinking about kicking or punting.

With just under five minutes left in last Sunday’s game against the Giants and his team trailing 27-20, Mike Smith went for it on 4th and 1 from his own 29 yard line. As was the case on repeated 4th down attempts the last time his team visited MetLife Stadium to face the Giants, the decision to be aggressive did not work out well. Matt Ryan was sacked for a nine-yard loss that effectively ended the game. If his previous behavior is any guide, Smith may learn the wrong lesson from that outcome and choose not to go for it again when the next similar opportunity arises. Smith illustrates better than any other coach the potential for fourth down failure to lead to future fourth down timidity.

Before those two failed Ryan fourth down sneaks against the Giants in that 2011 playoff game, Smith actually was one of the more enlightened coaches on fourth down strategy. From 2008-2011, Smith was the third-most aggressive coach of the last twenty years, at least according to Football Outsiders’ Aggressiveness Index. Dating Smith’s turning point is a little tough. He got burned going for it in Week 10 of the 2011 regular season, when he tried a sneak on 4th and inches from his own 29 in overtime against the Saints. He punted in a couple of situations where he usually went for it late in the 2011 season, but then was aggressive closer in against the Giants. By the 2012 regular season, Smith hadn’t just abandoned his prior tendency for aggressive strategy. He entirely reversed it. In 2012, he was the least aggressive coach in football, only going for it once in 91 qualifying fourth-down tries. He was similarly passive in 2013. His fourth down decision last Sunday was surprising given that trend.

To see Smith’s evolution on fourth down strategy, consider his decisions on 4th and 3 or less when between the opponent’s 10- and 40-yard lines. To consider only situations where there was a real choice while keeping things as simple as possible, I look only at first-half decisions along with third-quarter decisions where the margin was ten points or less. [continue reading…]

{ 8 comments }
Gronk can catch, block, and spike. But can he do all that without getting injured?

Gronk can catch, block, and spike. But can he do all that without getting injured?

In the 2011 AFC Championship Game against the Ravens, Bernard Pollard happened to Rob Gronkowski. And the Patriots offense ground to a halt for the rest of the game before being held to just 17 points in the Super Bowl. [1]Yes, a very limited Gronk played in SB XLVI, but he had only two catches and jumped like me when battling Chase Blackburn on Brady’s underthrown fourth quarter pick. In 2012, it was a freak injury on an extra point and then a reinjury in the divisional playoffs against the Texans. After that, the Patriots offense put up only 14 against the Ravens in the 2012 AFC Championship Game. Last year against the Browns, he took one of those horrible hits that make you cringe and want to keep him away from running seam routes in any regular season game. [2]The link is of Gronk shopping for groceries instead of the hit, because who wants to see that again? And the Pats put up 16 points against a mediocre and banged-up Broncos defense in the AFC Championship game. [3]The only two games all season where the Broncos gave up fewer points were against Houston and Oakland.

The Gronkowski injuries provide a tantalizing set of what-ifs. The Patriots have been within two games of a title the last three years. A healthy Gronkowski could have made the difference in any of those years. The Football Outsiders’ Almanac shows that the Pats’ offense was actually pretty good late in the season without Gronk, but they were terrible early in the year―they actually had a negative DVOA without him. Over the last two regular seasons, the Pats have averaged 34 PPG with Gronkowski, but six points fewer in New England’s 14 Gronk-less games.

And as much as I believe in stats, I’m not sure we really need them to tell us that Gronkowski is one of the most important non-quarterbacks in football. If he’s healthy through the playoffs, the Patriots seem likely to be neck-and-neck with the Broncos. With a defense that may be one of the best in football, I’d argue that the Pats should be a little better than the Broncos, even. [4]Unless Manning is just much better than Brady, I guess. I’m not seeing that. Denver’s only other big advantage is at receiver. Fine, but a healthy Gronkowski seems to even up a fair bit of that. … Continue reading Regardless, the Pats offense has been uniformly excellent with a healthy Gronkowski since 2010. Taking just the games where Gronk played, the Pats have ranked 1st, 3rd, 1st, and 2nd in offensive DVOA over the last four years.

That means one of the most important questions in the NFL in 2014 is whether we’ll see a healthy Gronkowski through the end of the season and into the playoffs. At this point, I think the reflexive answer is to assume that the answer is “no.” It certainly doesn’t feel like he’s going to be healthy. But previous examples of players getting hurt can provide some insight into Gronkowski’s actual chances.

Recovery for Injured Young-and-Excellent Players

In his second year, Gronkowski had an Approximate Value (AV) of 14. He then played only parts of the next two seasons due to injury. Considering players who started their careers since 1970, there have been 34 who had an AV season of at least 13 in their first two years and who then did not start at least 25% of the games in the following two years. This is a reasonable list of young-and-excellent players who then missed significant time in years 3 & 4. Most of these players missed time due to injuries, although some of those cases were a bit debatable. [5]In addition, I omitted two players who were obviously benched for other reasons: Shaun King and Derek Anderson. And Joe Cribbs, who went to the USFL for the fifth year of his pro career. Regardless, the conclusions are pretty much the same if we drop some of those cases. [continue reading…]

References

References
1 Yes, a very limited Gronk played in SB XLVI, but he had only two catches and jumped like me when battling Chase Blackburn on Brady’s underthrown fourth quarter pick.
2 The link is of Gronk shopping for groceries instead of the hit, because who wants to see that again?
3 The only two games all season where the Broncos gave up fewer points were against Houston and Oakland.
4 Unless Manning is just much better than Brady, I guess. I’m not seeing that. Denver’s only other big advantage is at receiver. Fine, but a healthy Gronkowski seems to even up a fair bit of that. And then there’s Brandon LaFell’s impending record-breaking season. I’m about to get shouted down. [Chase note: I don’t know how much longer I can stomach Andrew writing for Football Perspective.]
5 In addition, I omitted two players who were obviously benched for other reasons: Shaun King and Derek Anderson. And Joe Cribbs, who went to the USFL for the fifth year of his pro career.
{ 6 comments }

The Value of a First Down

What is the value of a first down? By that I mean, how many marginal yards is a first down actually worth? Here’s another way to word the question: If 3 first downs and 80 yards are worth X, then 2 first downs and [???] many yards are equal to X?

Calculating the marginal value of a yard isn’t easy. In fact, it’s been bugging me for years, because I’ve never quite been sure how to derive them. Then, a light bulb went off in my head: I needed to reach out to Brian Burke. I had an idea, but not the data or the means to execute.

Burke, of course, runs the fantastic website Advanced Football Analytics (formerly Advanced NFL Stats). I asked him if he would run some queries, and Brian was kind enough to do so. Fortunately, Brian’s not just a guy with access to lots of data, but one of the smartest minds in the industry. I wholeheartedly endorse his methods below, and I’m very thankful for his help. On top of running the numbers, he also provided an excellent writeup on his work. What follows are Brian’s words and analysis.


To estimate the value of achieving a 1st down without counting any of the value of the yardage gained, we can use the Expected Points model. The value of the 1st down itself minus yardage value will be the discontinuity in EPA when a play’s gain crosses the threshold for a 1st down. That discontinuity represents the value of the conversion apart from any yardage gained.

For example, on 2nd and 10, the EPA would increase smoothly for each yard gained up to 9 yards gained, then jump to a much higher EPA crossing the 10-yard mark where the conversion occurs. After that point, the EPA should increase smoothly again with each marginal yard gained above what was needed for the conversion.

Here is an illustration. The Y-axis represents Expected Points Added, the X-axis the amount of yards gained on the play.

EPA 2nd 10

The EPA for a 9-yd gain is 0.57, and the EPA for a 10-yd gain is 1.04. That’s a discontinuity of 0.47 EP, meaning that the 1st down itself is nearly equivalent to the 9-yards gained up to the point of conversion.

But we also need to correct for the yardage value of that 10th yard. One yard of field position is generally worth 0.064 EP. So in this case the discontinuity itself is worth 0.47 – 0.064 = 0.41 EP.

If we wanted to assign a “bonus” of yards to a player who is credited with achieving the conversion over and above the yardage itself, we could use this value’s yardage equivalent. 0.41 EP / 0.064 EP/yd = 6.4 yds. That’s the bonus for 2nd down and 10, but there are many other down and distance situations to consider.

For example, on 3rd and 10, the discontinuity is 1.57 EP, equivalent to nearly 25 yds. First and 10 is very strange because the discontinuity is negative. This makes sense, however, because an offense should prefer a 2nd & 1 to a 1st & 10 anywhere on the field. It would be silly to penalize a player for gaining the extra yard to convert, so my opinion would be to say the EP bonus for a conversion on 1st down is zero.

3rd 10

After examining a smattering of 2nd and 3rd down situations, the 2nd-down bonus EP is about 0.35 and 3rd-down bonus EP is roughly 1.4.

4th down conversions would obviously mean a very large bonus EP. They essentially have the value of a turnover–close to 4 EP or so. Since 4th downs are qualitatively different (and relatively rare) I’m going to set them aside.

In general, 32% of conversions come on 1st down, 38% come on 2nd down, and 30% come on 3rd down. So the weighted value of a conversion alone would roughly be:

[0.32 * 0] + [0.38 * 0.35] + [0.30 * 1.4] = 0.55 EP

The conversion bonus of 0.55 EP can be translated into yards by dividing by 0.064 EP/yd, which ultimately makes the equivalent yardage bonus for a conversion: 8.7 yards.


Figuring out the value of a first down will have many applications for Football Perspective going forward. Please leave your thoughts in the comments, as I’d love to hear what you guys have to say. And thanks again to Brian for his great work.

{ 20 comments }

Interesting tidbit from Peter King this week about how the Vikings nearly acquired Johnny Manziel:

As the picks went by, starting soon after the Rams chose at 13, Cleveland GM Ray Farmer worked the phones, trying to find a partner to move up from their second pick in the round (26th overall) to grab Manziel. He couldn’t find a fit. Finally, with less than three minutes to go in Philadelphia’s 22nd slot, Farmer heard this from an Eagles representative over the phone: “If you’re not gonna jump in here, we’re gonna trade the pick right now.” It’s cloudy what his offer had been to this point, but now he had to sweeten it, and he offered the 83rd pick overall, a third-rounder, in addition to their pick four slots lower than Philly. Done deal. The Eagles liked that offer better than an offer from Minnesota, because the Vikings would have been moving up from 40.

As discussed in my round 1 recap, the Eagles made out like bandits picking up the 83rd pick to move down four spots. Not only did Philadelphia received 137 cents on the dollar according to my trade chart, but the Jimmy Johnson trade chart — which overvalues high picks and therefore cautions against trading down — had the Eagles receiving 112 cents on the dollar. [continue reading…]

{ 2 comments }

Analyzing Position Values In the 2014 Drafts

The 2014 NFL Draft is in the books. The three-day event gives us a unique peek behind the NFL curtain; teams can and do say all sorts of ridiculous things, but the way the draft unfolds is the ultimate in what economists refer to as a revealed preference. For example, NFL decision makers might say that running and stopping the run is the key to winning football games (particularly likely if those decision makers reside in Indianapolis), but the NFL draft revealed that no team preferred to spend a top-50 pick on a running back. Only one pure inside linebacker was drafted in the first two rounds (Alabama’s C.J. Mosley), and only two more (Louisville’s Preston Brown and Wisconsin’s Chris Borland) were selected with picks in the top 125.

As regular readers know, I’ve created a draft value chart based on the expected marginal Approximate Value produced by each draftee in his first five seasons to the team that drafted him. By assigning each draft pick a number of expected points, we can then calculate how much draft capital was spent on each position. I went through the 2014 draft (using the position designations from Pro-Football-Reference) and calculated how much value was used on each position; the results are displayed in the table below. [1]I’m excluding fullbacks and specialists from this definition. For purposes of this study, the three fullbacks drafted, Auburn’s Jay Prosch (HOU), Oklahoma’s Trey Millard (SF), and … Continue reading

[visualizer id=”19720″] [continue reading…]

References

References
1 I’m excluding fullbacks and specialists from this definition. For purposes of this study, the three fullbacks drafted, Auburn’s Jay Prosch (HOU), Oklahoma’s Trey Millard (SF), and Arkansas’ Kiero Small (SEA), were included as running backs. For those curious two kickers — Arkansas’ Zach Hocker (WAS) and Boston College’s Nate Freese (DET) — and one punter (Miami(FL)’s Pat O’Donnell (CHI) were also drafted.
{ 10 comments }

As part of the new collective bargaining agreement, most rookies sign four-year contracts. But as further evidence of the owners’ success during negotiations in connection with the 2011 lockout, teams were granted a club option for a fifth year for all players selected in the first round. The option is only guaranteed for injury, however, so a team can exercise the option for 2011 first round picks and still release the player after the 2014 season.

For players in the top ten, that fifth year salary is equal to an average of the top ten highest-paid players at their position from the prior year. For players selected with picks 11 through 32 — and boy, that number 11 pick never looked as valuable as it did in 2011 — the fifth-year deal is worth an average of the salaries of the players with the 3rd through 25th highest salaries at their position.

The deadline for exercising the fifth-year option on 2011 first rounders is tomorrow, May 3rd.  As a reminder, here is a review of the first round of the 2011 Draft: [continue reading…]

{ 7 comments }

Last Wednesday, I looked at every time a team traded away a future first round draft pick in the last ten years. Today, the reverse: the times a team traded for a future first round pick.  I’ll again be focusing on the general manager or other person responsible for making the trade: that’s because future first round picks are generally discounted, and I’m curious to see how often patience is rewarded.  As we’ll see in our first example, hurting the team in the short term — even if the move looks brilliant in retrospect and is a win in the long term — does not necessarily mean much for the man making the deal.

1) Cleveland trades Trent Richardson to the Colts for a 2014 first round pick (Sept. 2013)

As a reminder, it was Tom Heckert who drafted Richardson with the third overall pick, so Lombardi doesn’t deserve any blame for the poor decision there.  In theory, Lombardi should have been rewarded for managing to still get a first round pick for Richardson, but instead, he just stacked the 2014 draft for Farmer.  For the franchise, it’s hard to view this trade as a great deal, because it’s connected to Richardson the draft pick (the Browns turned the 3rd pick in 2012 into the 26th pick in 2014). But as an isolated move, this one looks pretty strong for Cleveland and definitely for Lombardi, especially after how poorly Richardson performed in Indianapolis in 2013.

2) St. Louis trades 2012 first round pick (#2; Robert Griffin III) to Washington for 2012 first round pick (#6; Morris Claiborne), 2012 second round pick (#39; Janoris Jenkins), and 2013 first round pick (#22; Desmond Trufant) and 2014 first round pick (#2 overall) (March 2012)

A year ago, this trade arguably would define the Snead/Fisher era — in a bad way. Now, the Rams have managed to use one very valuable asset to restock the roster. Along with other trades, St. Louis wound up with four top 50 picks in 2012, two first round picks in 2013, and two more this year, including the second overall selection.  That hasn’t translated into much success on the field yet for Snead and Fisher, but it’s important to remember how bare the cupboard was when the duo arrived in 2012. Right now, this trade looks like a lopsided deal, but if RG3 can replicated his rookie season in 2014 — and Sam Bradford had another mediocre year — and the pendulum could swing again.

It’s worth noting that few decision makers would have been tempted to pull off this move. Fisher came to St. Louis in 2012 and was handed significant control.  That’s vital when a major part of the compensation involved a two year wait; that wasn’t a concern for Fisher, but I suspect it would be for most.

3) Cincinnati trades Carson Palmer to Oakland for 2012 first round pick (#17; Dre Kirkpatrick), 2013 second round pick (#37; Giovani Bernard) (October 2011)

Bernard and Kirkpatrick both look to be long-term starters in Cincinnati, while Palmer may have retired if the Bengals hadn’t traded him. This was an all-time great trade for Cincinnati and Lewis. The cherry on top is that Hue Jackson, who orchestrated the trade for Oakland, was Bernard’s position coach last year and will be the Bengals offensive coordinator in 2014. While the compensation wasn’t quite as generous, that’s as if Mike Lynn, the Vikings old general manager, moved on to the Dallas front office after the Herschel Walker trade.

[continue reading…]

{ 7 comments }

When a general manager trades away a future first round pick, it’s worth wondering if the transaction was the effect of the principal-agent problem. A general manager is supposed to act in the best interest of the franchise, but he may instead choose to act in his own self-interest. If he’s on the hot seat, trading a future first round pick for something right now may be a pretty attractive option, as he may not be around when the bill comes due.

Does that happen in practice? The most obvious example I can think of involved the Raiders in 2011.  On October 8th, Al Davis passed away. Eight days later, starting quarterback Jason Campbell went down for the season with a collarbone injury. With the owner and general manager positions unsettled, head coach Hue Jackson became the de facto head of football operations. And he traded first and second round picks to Cincinnati for Carson Palmer. Had the move worked out and the 4-2 Raiders gone on to make the playoffs, Jackson would have been very happy. When the move failed, the Raiders missed the playoffs and Jackson was fired. As a result, it was Reggie McKenzie sitting at the table when the bill arrived.

[continue reading…]

{ 21 comments }

Are Teams Afraid To Pass Against Seattle?

The Legion of Boom May Be Harmful To Your Offense's Health

The Legion of Boom May Be Harmful To Your Offense's Health.

We know that the Seahawks pass defense is historically good, but the title of this post sounds like it was written by a Seahawks homer, right? I mean, who else besides a green-and-blue fanboy (or maybe Richard Sherman or Earl Thomas) would write something as absurd as “Seattle’s pass defense is so good that teams are afraid to throw on them!!!”

The thing is, it’s kind of true. Seattle faced only 568 pass attempts (including sacks) during the regular season, the sixth fewest in the NFL.  Some of that is due to the Seahawks pace on offense and dominance of a defense that prevented sustained drives; even still, opponents passed on “only” 57.4% of all plays against Seattle.

Seattle ranked below average — 18th — in percentage of pass plays faced, but there’s a reason I put only in quotes. Seattle held an average lead over every second of game play this year of 5.6 points, the third best mark in the NFL. Denver and San Francisco were the only teams to play with larger leads, and they ranked 6th and 7th in percentage of plays faced that were passes. This is hardly a newsflash — teams generally throw often when trailing — but that wasn’t the case with 2013 Seahawks.

When Steve Buzzard used the Game Scripts data to determine defensive pass identities, he found that teams were more hesitant to pass against Seattle (once adjusting for the score and strength of schedule) than against any team in the league. I thought it would be interesting to take another crack at measuring this effect. We can use the score differential after each of the four quarters of the game to determine how many pass attempts (as a percentage of total plays) a team *should* face. [continue reading…]

{ 4 comments }

Film Room: Manning against Seattle in the preseason

Who treats the preseason like BS? BS!

Who treats the preseason like BS? BS!

On August 17th, Denver traveled to Seattle for each team’s second game of the preseason. Some people think the preseason is meaningless, but I thought it would be worthwhile to rewatch the first half of that game. If you’re interested, there were a pair of good recaps written in August from Field Gulls, the Seattle SB Nation site, and Its All Over, Fat Man!, a Broncos site and friend of the program.
[continue reading…]

{ 10 comments }

Cap Space Versus Production For DEN/NE/SF/SEA

It’s not much of a stretch to say that the Patriots, Broncos, 49ers, and Seahawks, and are four of the best organizations in the NFL. Over the last two years, these four teams are the only to win 23 games in the regular season or 26 games if you include the playoffs. In the salary cap era, being an excellent team means managing the salary cap well. And, broadly speaking, managing the cap well means finding good values for cheap and making sure the players you spend a premium on deliver commensurate production.

So is that true for New England, Denver, San Francisco, and Seattle? The invaluable Jason Fitzgerald of Over the Cap has salary cap data for each team in the league, which can answer half the problem. But how do we measure production? I decided to use the ratings from Pro Football Focus, since the website provides a rating of every player on every team (although I excluded special teamers from my analysis today).

One note about PFF data, which comes from Nathan Jahnke, a writer at the website. As he explained to me, PFF’s ratings are not necessarily designed for comparisons across positions. For each position, zero is average, but the magnitude a player’s rating can get to is somewhat dependent on the position they play. For example, PFF has never had a safety over a grade of +30, while five 3-4 DEs hit that mark in 2013. For my purposes today, this is not a big concern — it just means view the graphs with an understand that these are not designed to be the perfect way to compare a player. But in general, I think they work well. (And, of course, don’t think that just because Brandon Mebane has a higher rating than Russell Wilson that it means PFF thinks Mebane is a more valuable player.)

To avoid people using my graphs to scrub data and steal the hard work put in by by Over The Cap and Pro Football Focus in assembling the salary cap data and player grades , I have decided not to label either axis with salary information or player ratings. Just know that the X-axis (that’s the horizontal one) is for salary, and players on the left are cheap and players on the right are expensive. The vertical or Y-axis shows the PFF grades from worst (on the bottom) to best on top). Note: to compare across teams, I have used the exact same dimensions for both axes across all four graphs. [continue reading…]

{ 13 comments }

Trailing in the 4th quarter, send out the kicker!

John Harbaugh things this guy needs as much PT as possible

John Harbaugh things this guy needs as much PT as possible.

Through four weeks, there have been 28 cases where a team, trailing in the 4th quarter, sent in the kicker or the punter. In general, that’s a pretty low rate — it’s just under once every two games. But while going for it on 4th down isn’t always the right decision when trailing in the 4th quarter, even 28 kicks/punts is too many.

Twelve of those 28 plays were field goal attempts, and all were successful.  Four kicks were to tie or take the lead, but only one of them — Rian Lindell’s 37-yarder, trailing by one point with 38 seconds remaining in week one against the Jets was an obviously correct decision (not that Greg Schiano’s conservative play-calling on the prior three plays deserves the same treatment). Two other kicks were noncontroversial: Facing 4th-and-9 from the Vikings 11, trailing by 10 with 3:40 remaining, I don’t blame Mike Tomlin for sending in the kicker. Even more obvious: Jeff Fisher having Greg Zuerlein kick a 38-yard field goal on 4th and 8 from the Arizona 20, trailing by 3, with 9 minutes left in the game. What about the other 9 field goal decisions? Let’s start first with four end-game strategic blunders:

1) John Harbaugh sent out Justin Tucker to kick a 30-yard field goal on 4th and 4 trailing by 18 with 5:33 remaining at the Broncos 12-yard line. Yes, Harbaugh thought Baltimore’s best chance of winning was to kick a field goal, stop Denver, score a touchdown, stop Denver, score another touchdown, convert the two-point attempt, and then win in overtime. Even though a 30-yard field goal is close to automatic, this one is pretty easy to analyze.  In both situations, you need to stop Denver twice and score two more touchdowns. So the question becomes, it is easier to:

    (a) kick a 30-yard field goal and (assuming the other events all unfold in your favor) then have only a 1-in-4 chance of winning (i.e., convert on the 2-pointer and win in overtime); or
    (b) score a touchdown on a drive at the Denver 12, facing 4th and 4?

2) Mike Smith had Matt Bryant kick a 25-yard field goal with 3 minutes to go, trailing by 10 against New England, facing 4th and 1 at the Patriots 7-yard line.

This one is not terrible, but I agree with Bill Barnwell’s analysis that going for it would have been the preferred move. Note that you don’t need the benefit of hindsight: Jason Lisk correctly predicted in real time that by going conservative on 4th-and-1, Atlanta would have to go for it (and fail) in a more challenging 4th down play later in the game.
[continue reading…]

{ 5 comments }

“Worldly wisdom teaches that it is better for the reputation to fail conventionally than to succeed unconventionally.” – John M. Keynes.

Photo via phillymag.com.

Last Thursday night, Chip Kelly was widely criticized for an unconventional decision that turned out to be unsuccessful. Trailing 10-0 in the first quarter against the Chiefs, Michael Vick threw a 22-yard touchdown pass to Jason Avant. The photo above shows how the Eagles lined up for the point after. Philadelphia’s two-point conversion attempt — a play known as the the Swinging Gate — was stopped, and it was stopped in particularly ugly fashion. That made it easy to point a finger and laugh at the college coach doing something silly.

But without the benefit of hindsight, there was nothing silly or even suboptimal about the decision. Putting aside the specifics of the play — we’ll get to that at the end — the main criticism seems to be that it was “too early” to go for two, or that the Eagles were “chasing points”, or that it was simply “unnecessary.” All of those are buzz words for saying that the Eagles should have behaved conventionally.

At a baseline level, let’s recognize that a team has a roughly 50/50 chance of converting on a two-point conversion. For a good offense with a mobile quarterback, that number may be even higher, but let’s just use the 50/50 number now. If that’s the case, then teams early in the game should be indifferent between kicking the extra point and going for two. Consider this hypothetical example: if a team had the option of kicking the extra point or flipping a coin — and heads gave them two points, tail giving them zero — would choosing to flip the coin be a poor decision?

Late in games, perhaps. But early in the game? I don’t see any reason to think that the difference between having six versus seven points on the board in the first quarter is more significant than the difference between having seven or eight points. Suppose you were told that your favorite team would score first quarter touchdowns in back-to-back games. Option 1 provides that your team would the extra point both times, while Option 2 is that your team would make the two point conversion once and fail on the attempt once. So you get eight points in one game and six points in the other.

Which would you prefer, Option 1 or Option 2? And why? And, if you prefer Option 1 to Option 2, how much more preferable is it? What would you be willing to trade to land in Option 1 — how many yards on the ensuring kickoff?

I would be indifferent between Options 1 and 2, but even if you preferred one, I don’t see how anyone could strongly prefer Option 1 to Option 2. The value to having 8 points is real, which is why it is never “too early” or “unnecessary” to go for two in a world where teams convert on two-point attempts half the time. Those are red herrings, because going for two is only a high-variance strategy; is it not a high-variance, lower-expected value option. Once you understand that, then nearly all the criticism about Kelly’s decision disappears.

As for the actual play call? I think it was a good one. Keep in mind that the Eagles did not pigeon hole themselves into going for two — based on how the Chiefs reacted to that formation prior to the snap, Philadelphia could have switched back to a normal extra point formation or simply taken a delay of game penalty with minimal harm. But Kansas City did not react well to the play pre-snap: The Eagles split two players out wide to the right, and Kansas City countered with two defenders to that side. But in the middle of the field, Philadelphia had the snapper, holder, and kicker, while the Chiefs kept four players in the middle of the field. I’m quite certain the special teams coach was not pleased with how the Chiefs responded to the situation, because that left K.C. with only five defenders to the defense’s right, while the Eagles were able to match up five blockers to that side and Zach Ertz, the eventual ballcarrier.

That’s a matchup Philadelphia should win more often than fifty percent of the time, and perhaps significantly more often than that. As it turns out, Lane Johnson blew the block, Tamba Hali made a nice play, and Kelly and the Eagles had egg on their face. Failing unconventionally has its drawbacks.

{ 4 comments }
Luck causes people to lose their minds

Luck causes people to lose their minds.

I can’t believe I’m writing this article. Everyone loves Chuck Pagano, but he made a pretty embarrassing blunder at the end of the Colts upset win in San Francisco on Sunday. The Colts led 13-7 when Andrew Luck scrambled for a six yard touchdown on 3rd-and-3 with just over four minutes left in the fourth quarter. Incredibly, Pagano then chose to kick the extra point, which my buddy and Colts fan Nate Dunlevy identified immediately as a terrible decision.

I wasn’t going to write a post about that decision, because, ya know, what could be more obvious than going for two when up by 12 points with just over four minutes left in the game? I mean, Jason Garrett got this right in the season opener. Being up by 14 points means two touchdowns doesn’t beat you, while there is almost no difference between being up 12 or being up 13 points. That doesn’t make for a very interesting post, though.

From 1999 to 2012, 36 teams scored a touchdown when leading by 6 points in the final eight minutes of the fourth quarter. Only 22 times did the team then follow that score by going for two, converting half of the time. Take a look:
[continue reading…]

{ 4 comments }

Previously on the 2013 RSP Football Writers Project…

Introduction/My Picks in Rounds 1 and 2
My Pick in Round 3
My Picks in Rounds 4 and 5
My Picks in Rounds 6 through 11

You can also view every pick in this draft recap.

Rounds 12/13

Already on team: QB Josh Freeman, WR Julio Jones, WR Brandon Marshall, TE Greg Olsen, LT D’Brickashaw Ferguson, G Alex Boone, 3-4 DE Desmond Bryant, 3-4 DE Cameron Heyward, 3-4 OLB DE Paul Kruger, 3-4 OLB Courtney Upshaw, CB Vontae Davis
[continue reading…]

{ 2 comments }

We already know what the average draft pick is worth, thanks to the Football Perspective Draft Value Chart. If we assign the draft value associated with each pick to the college of that player, then we can determine which school had the most draft value in any given year. As it turns out, the best single draft since 1967 came courtesy of USC in 1968. Look at this pretty incredible draft for the Trojans, with five players in the top 24:

Pk   Team  Player               Pos  School
1    MIN   Ron  Yary             T    USC
10   PIT   Mike  Taylor          T    USC
14   PHI   Tim  Rossovich        LB   USC
16   CHI   Mike  Hull            RB   USC
24   DET   Earl  McCullouch      WR   USC
68   PHI   Adrian  Young         LB   USC
94   WAS   Dennis  Crane         DT   USC
101  NYJ   Gary Magner          DT   USC
298  OAK   Chip  Oliver          LB   USC
438  DEN   Steve Grady          RB   USC
439  NOR   James  Ferguson       C    USC

In modern times, the best draft class (in terms of draft pick value) by a single school came in 2004, when the Miami Hurricanes sent this impressive haul to the NFL:

Rk   Team  Player               Pos  School
5    WAS   Sean  Taylor	        DB   Miami (FL)
6    CLE   Kellen  Winslow  Jr.	TE   Miami (FL)
12   NYJ   Jonathan  Vilma	LB   Miami (FL)
17   DEN   D.J.  Williams	LB   Miami (FL)
19   MIA   Vernon  Carey        T    Miami (FL)
21   NWE   Vince  Wilfork	NT   Miami (FL)
213  NYJ   Darrell  McClover	LB   Miami (FL)
215  CHI   Alfonso  Marshall	DB   Miami (FL)
254  SDG   Carlos  Joseph	T    Miami (FL)

[continue reading…]

{ 2 comments }

Here’s the introduction to an old fantasy football article by my fellow Footballguys staffer Maurile Tremblay:

In most fantasy football leagues, eligible players are divided into 6 different positions: quarterback, running back, wide receiver, tight end, placekicker, and special teams/defense. Imagine a league that includes a seventh position, team captain, which earns points each week based solely on the initial coin toss. For example, if you’ve got the Raiders as your starting TC and the Raiders win their coin toss, you get 30 points; if the Raiders lose their coin toss, you get nothing.

Under the current laws of probability, we can expect any particular team captain to win about 8 out of its 16 coin tosses over the course of the season, winding up with about 240 total fantasy points — so let’s use that as our VBD baseline. There will probably be one or two team captains, however, that win around 12 tosses, making them about 120 points better than average. That makes the top team captain pretty valuable!

So how long should we wait before drafting our TC1? Is the first round too early? The second?

Of course, anything before the final round is too early! Coin flips are random, so while some TCs will end up scoring many more points than others over the course of the season, there’s no way to know which ones. We should therefore be totally indifferent to which TC we end up with.

That’s not the case with, say, running backs. We may be fairly confident that Eddie George will score more points than Tim Biakabutuka. So while we have no good reason to prefer the Raiders’ team captain to the Chiefs’, we should quite rationally prefer George to Biak. And as it makes sense to spend our early draft choices filling positions where our preferences are strongest — indeed, that is the essence of VBD — we ought to generally draft our RBs before we draft our TCs.
[continue reading…]

{ 5 comments }

[Special thanks goes out to my Footballguys.com co-writer Maurile Tremblay for his help in co-authoring this piece with me. Any points with which you may disagree are almost certainly due to my error, and not Maurile’s.]

The new NFL collective bargaining agreement that ended the 2011 lockout instituted some pretty big changes to the salary cap. When it comes to roster management, here are three ways the post-2011 NFL differs from how things were under the old CBA:

  • Rookies are now super cheap relative to their production, especially high first-round players (relative to their old cost)
  • Rookie contracts can not be renegotiated until three years after the player is drafted.
  • Over a four-year period, each team must spend 89% of the cap dollars available to them, and the league must spend 99% of the cap dollars available to the 32 teams.

Under the old system, contrary to popular belief, most (if not all) rookies were underpaid relative to their free market value. Then in 2011, the owners and NFLPA decided to rob the rookies to pay veterans even more money under the new CBA. Russell Wilson has three years remaining on his contract and will have an average cap figure of just $817,000 over those three years. Andrew Luck and Robert Griffin III will only cost their teams about 6 million cap dollars each per year from 2013 to 2015. The salary cap in the NFL in 2013 is $123M, making Luck and Griffin fantastic values, and Wilson perhaps the most valuable player in the league.

Wilson's paid in direct proportion to his height

Wilson's paid in direct proportion to his height.

What makes this especially juicy from the perspective of their general managers is that all three players are locked into their deals until 2015. Luck and Griffin actually are struck through 2016, as teams get club-options for a fifth year for the top picks. In Wilson’s case, after the 2014 season, he’ll be facing a contract that would pay him less than a million dollars in 2015 and then a possible franchise tag in 2016, meaning a maximum payout of probably 20 million dollars over two years (the tag in 2012 for quarterbacks was just under $15 million). That puts Wilson in a pretty poor position to bargain for a market deal: he’s going to sacrifice money in exchange for security. This means Seattle will get him for absurdly below-market rates in 2012, 2013, and 2014, and then will still have him on a very generous contract for the next few years after that.

In the case of Luck or Griffin, the Colts and Redskins essentially get a chance to use the tag twice; teams can turn the four-year rookie deals into a five-year deal by paying top-ten picks the average salary of the ten highest-paid players at their position; then the next year the franchise tag would be the average of the top five quarterbacks or a 20% increase on the salary from the previous year. So when they are up for renegotiation after year three, they’re looking at the team “forcing” them to stay for three years at roughly $42 million, with year one bringing just over three million. Luck and Griffin will have a little more bargaining power than Wilson, but not much. There’s no chance either player is going to play for $3 million in 2015 (remember, their cap hit will be a bit higher, but their base salaries will be around $3M in that season), so both will likely give up their freedom (which would be three years away, potentially) for security.
[continue reading…]

{ 26 comments }

My thoughts on trading Darrelle Revis

There are four things the Jets could do with Darrelle Revis.

Option 1: Trade him before the draft to the team (not in the AFC East or in New York) willing to offer the most.

Option 2: Trade him during the five-month period after the draft but before the trading deadline, under the assumption that Revis will be able to fetch more in return once he is healthy and playing at his old level (assumption #2). [Update: As pointed out to me on twitter, the Jets will also incur the $9M penalty discussed in Option 3 if Revis is traded after June 1st.]

Option 3: Have Revis play out his contract, and then watch him sign with another team in the off-season (or enter a bidding war and try to win Revis on the open market). In return, the Jets will receive a compensatory draft pick, roughly the 100th pick in the 2015 draft. And, since Revis was given an $18M bonus on a six-year deal in 2011 — a deal that Revis has the option of voiding after this season — the Jets will also incur a nine million dollar cap penalty in 2014.

Option 4: Re-sign Revis to a mega deal now. The Jets will get a slight discount off the enormous contract Revis would get on the open market based on the questions about his knee and the fact that he’s due to make “only” $9M in 2012.

[continue reading…]

{ 7 comments }

On Tuesday, I discussed the RSP Football Writers Project, a 32-team start-up draft of every player in the NFL.  I was assigned the 32nd pick, which does bring with it one advantage.  In order to balance the values assigned with the random draft order, the selection picks for the third round is “reversed”, a common fantasy football technique known as 3rd Round Reversal.  So while I picked last in round one after 18 quarterbacks had been drafted, I got to pick first in rounds two and three.

As you now know, I drafted Josh Freeman and Julio Jones with picks 32 and 33.  At 65, there were several ways I could go.

  • I think it’s hard to overestimate the value of a great passing game, so adding a receiver or tight end isan attractive option. That’s doubly true when Brandon Marshall and Aaron Hernandez were still available. Marshall was my highest-ranked receiver from last year and is relatively young; he turns 29 this month. Hernandez is 23 and is an incredible asset in the passing game.
  • If you think of the big positions in the NFL as quarterback, pass rusher, and left tackle, then you probably want to fill those slots as quickly as possible. At left tackle, Duane Brown, Joe Thomas, Matt Kalil, and Nate Solder are gone. Michael Roos is a solid pick, but at 31 in October, does he fit my model of fielding a young team? Ryan Clady was a player I might have taken, but he was selected just a few picks before I was up. I didn’t see an elite player available, so I crossed this off the list (a few picks later, Matt Waldman selected Russell Okung.)
  • On the pass-rusher front, Von Miller, Aldon Smith, Clay Matthews, Cameron Wake, Jason Pierre-Paul, DeMarcus Ware, Charles Johnson are all gone, as are 3-4 defensive ends J.J. Watt, Calais Campbell, Muhammad Wilkerson and Justin Smith. While there were some attractive options out there, my hope is one of them will be around when I pick again. The most interesting option was Mario Williams, a player I really wanted to take, but his struggles in 2012 were too significant to overlook.

[continue reading…]

{ 1 comment }

Matt Waldman and Sigmund Bloom are once again running the RSP Football Writers Project this off-season. Last year, a salary cap value was assigned to each player and we were asked to assemble our team within the confines of a salary cap. You can see my team here, but my basic philosophy was to invest heavily in building an elite passing offense. One of the questions we had to answer was who were our stars and why did we pick them? I wrote:

Peyton Manning is the key. With an elite quarterback and competent weapons, you can just about pencil your team in for the playoffs. With Jimmy Graham and Victor Cruz, I’ve got one player who ranked in the top three in receptions and one in the top three in receiving yards in 2011. Those three can form the cornerstone of the offense for the next three-to-five years.

This year, the RSP Football Writers Project (you can see the draft recap here or follow the picks on twitter here) is being run as a 32-team start-up draft with fantasy football style serpentine order that includes a third-round reversal. Trades are not allowed and the player pool will consist of veterans only (i.e., no players available in the 2013 draft).

We were told the draft order was random, although I choose to believe that I was assigned pick #32 because of my performance in last year’s project. Having the 32nd and 33rd picks in the draft placed me in a unique position, and I figured I’d explain my team-building methods here.
[continue reading…]

{ 6 comments }
Previous Posts