≡ Menu

Finding Comparables For Mike Glennon

Not opposed to occasional acts of piracy

Not opposed to occasional acts of piracy.

It’s official in Tampa Bay: Josh Freeman is out and Mike Glennon is in at starting quarterback. But what are the odds that Glennon actually plays well this year? I’m not very optimistic for a couple of reasons.

Vincent Jackson is a star, but he’s dealing with injuries to his ribs. On 30 passes aimed at Jackson this year, Freeman has picked up 265 yards, an average of 8.83 yards per attempt. On 23 targets to Mike Williams, Freeman has averaged 5.5 yards per pass. On his other 38 targets, Freeman’s averaged just 4.7 yards per pass. Right now, there simply aren’t enough weapons in Tampa Bay, as the Bucs desperately could use a receiving tight end and a slot receiver.

But here’s another reason not to expect much from Glennon. Since 1978, there are 30 rookie quarterbacks who are “similar” to Glennon in that they met the following three criteria:

  • Were not first round picks
  • Did not start in week 1 (i.e., they didn’t pull a Russell Wilson and win the job with a great training camp — they generally became the starter because the man in front of them was ineffective); and
  • Started at least four games as a rookie.

[continue reading…]

{ 8 comments }

Quarterback Age Curves

The master and the puppet?

The master and the puppet?

Last summer, I looked at the age curves for running backs in an attempt to find out if there is a magical cliff at age 30 (there isn’t). But when I wrote about Josh Freeman last week, I started thinking about quarterback age curves.

The first step in trying to measure the aging patterns of quarterbacks is to figure out a sample to analyze. I decided to look at all quarterbacks who entered the league since 1970 and have since retired. I further limited my sample to quarterbacks who had at least three seasons of above-average play based on this system. That brought us to a group of 77 quarterbacks, from quarterbacks like Jon Kitna, Jay Fiedler, and Dan Pastorini to Hall of Famers like Joe Montana, Brett Favre, and Dan Marino.

While before I graded quarterbacks based on how much value over average they provided, that baseline is too high for this type of post. Instead, I gave quarterbacks credit for their value over replacement, defined as 75% of the league average. I then calculated the best three seasons of value over replacement (VOR) for each quarterback’s career to get a sense of their peak level of play. The last step was to divided their VOR in each season of their career by their peak value. Do this for each of the 77 quarterbacks, and we can get a sense of quarterback aging patterns.

There is another thing to consider when coming up with an age curve: The intuitive way is to sum up each quarterback’s value (relative to his peak) in each season and divide that total by the number of quarterbacks active at that age. Another way is to divide that total by 77, the number of quarterbacks in the study. The former method will make really young and really old ages look closer to average than they really are, but I have decided to include both methods in the picture below. The blue line represents the average performance based on the number of quarterbacks actually playing in the NFL that season; the red line shows the aging patterns when you divide by the total number of passers in the group.
[continue reading…]

{ 11 comments }

Matt Waldman and Sigmund Bloom are once again running the RSP Football Writers Project this off-season. Last year, a salary cap value was assigned to each player and we were asked to assemble our team within the confines of a salary cap. You can see my team here, but my basic philosophy was to invest heavily in building an elite passing offense. One of the questions we had to answer was who were our stars and why did we pick them? I wrote:

Peyton Manning is the key. With an elite quarterback and competent weapons, you can just about pencil your team in for the playoffs. With Jimmy Graham and Victor Cruz, I’ve got one player who ranked in the top three in receptions and one in the top three in receiving yards in 2011. Those three can form the cornerstone of the offense for the next three-to-five years.

This year, the RSP Football Writers Project (you can see the draft recap here or follow the picks on twitter here) is being run as a 32-team start-up draft with fantasy football style serpentine order that includes a third-round reversal. Trades are not allowed and the player pool will consist of veterans only (i.e., no players available in the 2013 draft).

We were told the draft order was random, although I choose to believe that I was assigned pick #32 because of my performance in last year’s project. Having the 32nd and 33rd picks in the draft placed me in a unique position, and I figured I’d explain my team-building methods here.
[continue reading…]

{ 6 comments }

NYT Fifth Down: Post-week 11

This week at the Fifth Down, I look at the remarkable turnaround in Tampa Bay.  I argue that the success Tampa Bay is having this year dates back to the end of last year, when the organization decided to rebuild the offense with a clear image in mind.

Ten months ago, Tampa Bay Buccaneers General Manager Mark Dominik had a disaster on his hands.

The Bucs lost their final 10 games of the 2011 season and fired Coach Raheem Morris. The team ranked 27th in points scored, and quarterback Josh Freeman had regressed considerably in his third season.

In 2011, Freeman ranked 26th in Adjusted Net Yards per Attempt and led the N.F.C. in interceptions. Freeman had seemingly lost his way; he averaged a meek 10.4 yards per completion, placing him 33rd in the league and just barely ahead of weak-armed Colt McCoy (10.3).

If Freeman’s career had continued on this downward trajectory, Dominik would have become collateral damage. So in the off-season, Dominik rebuilt the team with a clear vision: he wanted an offense built around a strong running game complemented by a deep passing attack.

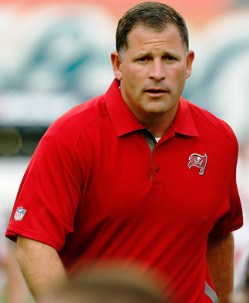
Dominik’s first move to was hire Greg Schiano, then the coach at Rutgers. The decision seemed odd at the time, especially in light of Tampa Bay’s flirtation with Oregon’s Chip Kelly. Kelly is considered an offensive mastermind, and Schiano is a defensive coach by trade. That meant the man Schiano would hire to coach his offense would be the most critical hire in Josh Freeman’s — and potentially Dominik’s — career.

Schiano didn’t have to venture far from Piscataway, N.J., to find his coordinator, Mike Sullivan, who was working as the Giants’ quarterbacks coach. The decision was considered risky because Sullivan had never called plays for the Giants, but he had a reputation for wanting to stretch the field with long passes in connection with a strong running game. In 2011, among the 25 quarterbacks that started at least 10 games and threw at least 300 passes, Eli Manning led the league in yards per completion.

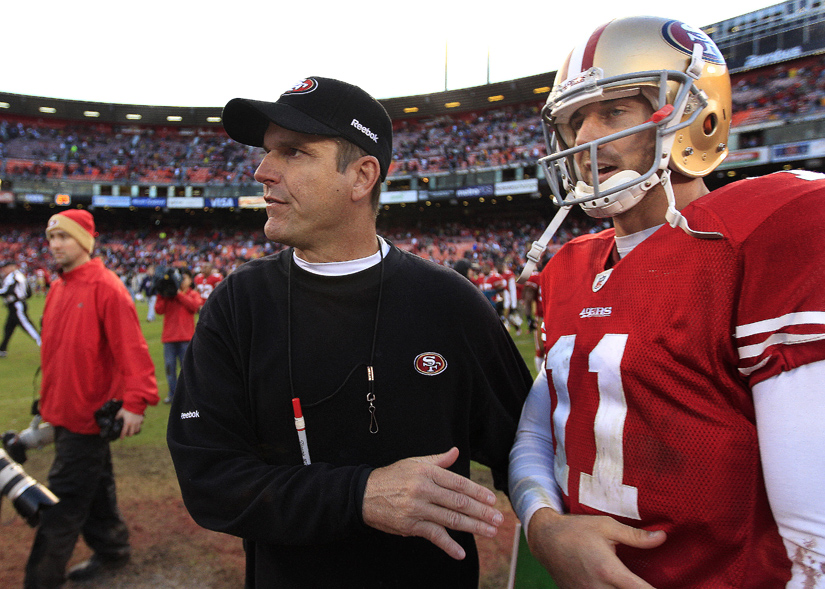
In March, Tampa Bay signed wide receiver Vincent Jackson, who had starred for the Chargers. From 2008 to 2011, Jackson averaged 18.0 yards per catch, the highest average in the league over that span among players with at least 200 catches. During Jackson’s best season, in 2009, San Diego quarterback Philip Rivers led the league in yards per completion, signaling the effects an elite deep threat can have on a quarterback’s statistics.

Tampa Bay also signed the All-Pro guard Carl Nicks from division rival New Orleans, although he is now out for the year with a left foot injury. Finally, in the 2012 draft, the Buccaneers selected running back Doug Martin with the 31st pick in the first round. Martin has 1,000 rushing yards in 10 games and is leading the N.F.L. in yards from scrimmage.

By adding one of the game’s best deep threats, an excellent offensive lineman and a talented, all-purpose running back, along with finding the right offensive coordinator and  coach, Dominik put the pieces in place around his franchise quarterback. This year, Freeman is having a breakout season. Playing in Sullivan’s offense, alongside Jackson and Martin, has transformed Freeman into one of the game’s most valuable players. Consider that through 10 games in 2011, Manning’s Giants were 6-4 and he was averaging 8.2 Adjusted Yards per Attempt; through 10 games in 2012,  Freeman’steam is 6-4 and he is averaging 8.2 AY/A.
After ranking 26th in ANY/A last season, Freeman  ranks second in ANY/A and Net Yards per Attempt, my preferred predictive statistic of quarterback play, trailing only Peyton Manning in both categories. After ranking second to last in yards per completion last year, Freeman ranks second in that metric this season, just barely behind Cam Newton.

You can read the rest of the post here, which also includes a look at the crazy records set in the Houston-Jacksonville game and some other interesting week 11 stats.

{ 2 comments }

Cam Newton is having an interesting year

I don’t care about any of the nonsense with Cam Newton. Instead, take a look at his 2011 and 2012 stat lines:

                                                                                            
Year   GS  QBrec Cmp Att Cmp%  Yds TD TD% Int Int% Y/A  AY/A Y/C  Yd/G Sk Yds NY/A ANY/A Sk% Rsh Yds TD  YPC Y/G  C/G
2011   16 6-10-0 310 517 60.0 4051 21 4.1  17  3.3 7.8  7.2 13.1 253.2 35 260  6.9   6.2 6.3 126 706 14  5.6 44.1 7.9
2012    6  1-5-0 101 173 58.4 1387  5 2.9   6  3.5 8.0  7.0 13.7 231.2 15 102  6.8   5.9 8.0  46 273  3  5.9 45.5 7.7

His Y/A is actually higher this year (although his sack rate is a little worse), and his rushing yards per game and yards per carry are both slightly up. Obviously the biggest change is that Newton simply isn’t scoring very much — he’s on pace for just 21 touchdowns after scoring 35 last year. But touchdowns are more volatile than metrics like yards per attempt, and tend to rebound quickly when paired with a strong yards per attempt average. Compared to league average, Newton’s only slightly worse in NY/A and ANY/A than he was last year, and he’s still above-average in both statistics. Statistically, he looks fine.

But the eye test certainly says Newton is struggling. And some stats back that up, too. Newton ranks 25th in Total QBR, although he only ranked 17th in that metric a year ago. Perhaps more importantly, the Carolina offense has plummeted to 29th in points per drive so far in 2012 (while ranking 17th and 19th in drive success rate), after ranking 6th in points per drive (and 6th in yards and 5th in DSR) in 2011. So the offense has been quite a bit worse, and significantly worse when it comes to scoring. That sort of matches what the “eye test” tells me.

But as Aaron Schatz pointed out to me, there are some odd splits going on with Newton. Take a look at how Newton’s performed on pass attempts on 1st downs this year:
[continue reading…]

{ 2 comments }

Have you taken a look at a passing leaderboard lately? Here’s the PFR passing leaderboard sorted by ANY/A; as always, all columns are sortable.

RkQBTmGCmpAttCmp%YdsTDTD%IntInt%Y/AAY/AY/CSkYdsNY/AANY/ASk%
1Peyton ManningDEN615422767.81808146.241.888.411.710637.47.84.2
2Josh FreemanTAM610418755.61538115.952.78.28.214.89657.57.54.6
3Eli ManningNYG716926563.82109124.572.687.712.55407.77.41.9
4Robert Griffin IIIWAS713318970.4160173.731.68.58.512151067.37.47.4
5Drew BreesNOR616627360.82097186.672.67.77.812.612867.17.24.2
6Ben RoethlisbergerPIT6155235661765114.731.37.57.911.413726.87.25.2
7Tom BradyNWE718628565.32104124.231.17.47.811.314966.77.14.7
8Aaron RodgersGNB718326269.81979197.341.57.68.310.8261426.47.19
9Matt SchaubHOU714022263.11650104.541.87.47.511.88596.973.5
10Jake LockerTEN46710663.278143.821.97.47.311.731676.92.8
11Matt RyanATL616023667.81756145.962.57.47.511131076.66.75.2
12Carson PalmerOAK614824161.4173272.941.77.2711.712936.56.34.7
13Alex SmithSFO712719066.8142794.752.67.57.311.2181006.46.28.7
14Joe FlaccoBAL715025259.5183793.662.47.36.912.2181106.46.16.7
15Andy DaltonCIN715624364.21831135.3104.17.56.811.7171026.75.96.5
16Cam NewtonCAR610117358.4138752.963.58713.7151026.85.98
17Tony RomoDAL615022167.9163683.694.17.46.310.99596.95.83.9
18Ryan FitzpatrickBUF7133218611435156.994.16.66.110.88446.25.73.5
19Christian PonderMIN71522276714929462.66.66.29.816685.95.56.6
20Sam BradfordSTL713121959.8159273.262.77.36.712.2211316.15.58.8
21Ryan TannehillMIA611819859.6145442637.36.412.3121096.45.55.7
22Matthew StaffordDET616426462.1175451.962.36.6610.7128665.44.3
23Michael VickPHI613623158.9163283.583.57.16.21217906.25.46.9
24Andrew LuckIND613425053.6167472.872.86.7612.516995.95.36
25Mark SanchezNYJ711621853.2145394.173.26.7612.514775.95.36
26Jay CutlerCHI610618756.7135984.373.77.36.412.81912165.39.2
27Russell WilsonSEA710417559.4123084.67476.111.8149765.27.4
28Brandon WeedenCLE715427256.6178393.3103.76.65.611.611696.15.13.9
29Philip RiversSDG613920966.51492104.894.37.16.210.7181186.15.17.9
30Kevin KolbARI610918359.6116984.431.66.46.510.7271594.84.912.9
31Matt HasselbeckTEN59615661.593153.242.665.59.710745.24.76
32Blaine GabbertJAX68815855.790663.831.95.75.610.3151054.64.58.7
33Matt CasselKAN510317658.5115052.895.16.54.811.213745.74.16.9

[continue reading…]

{ 1 comment }