
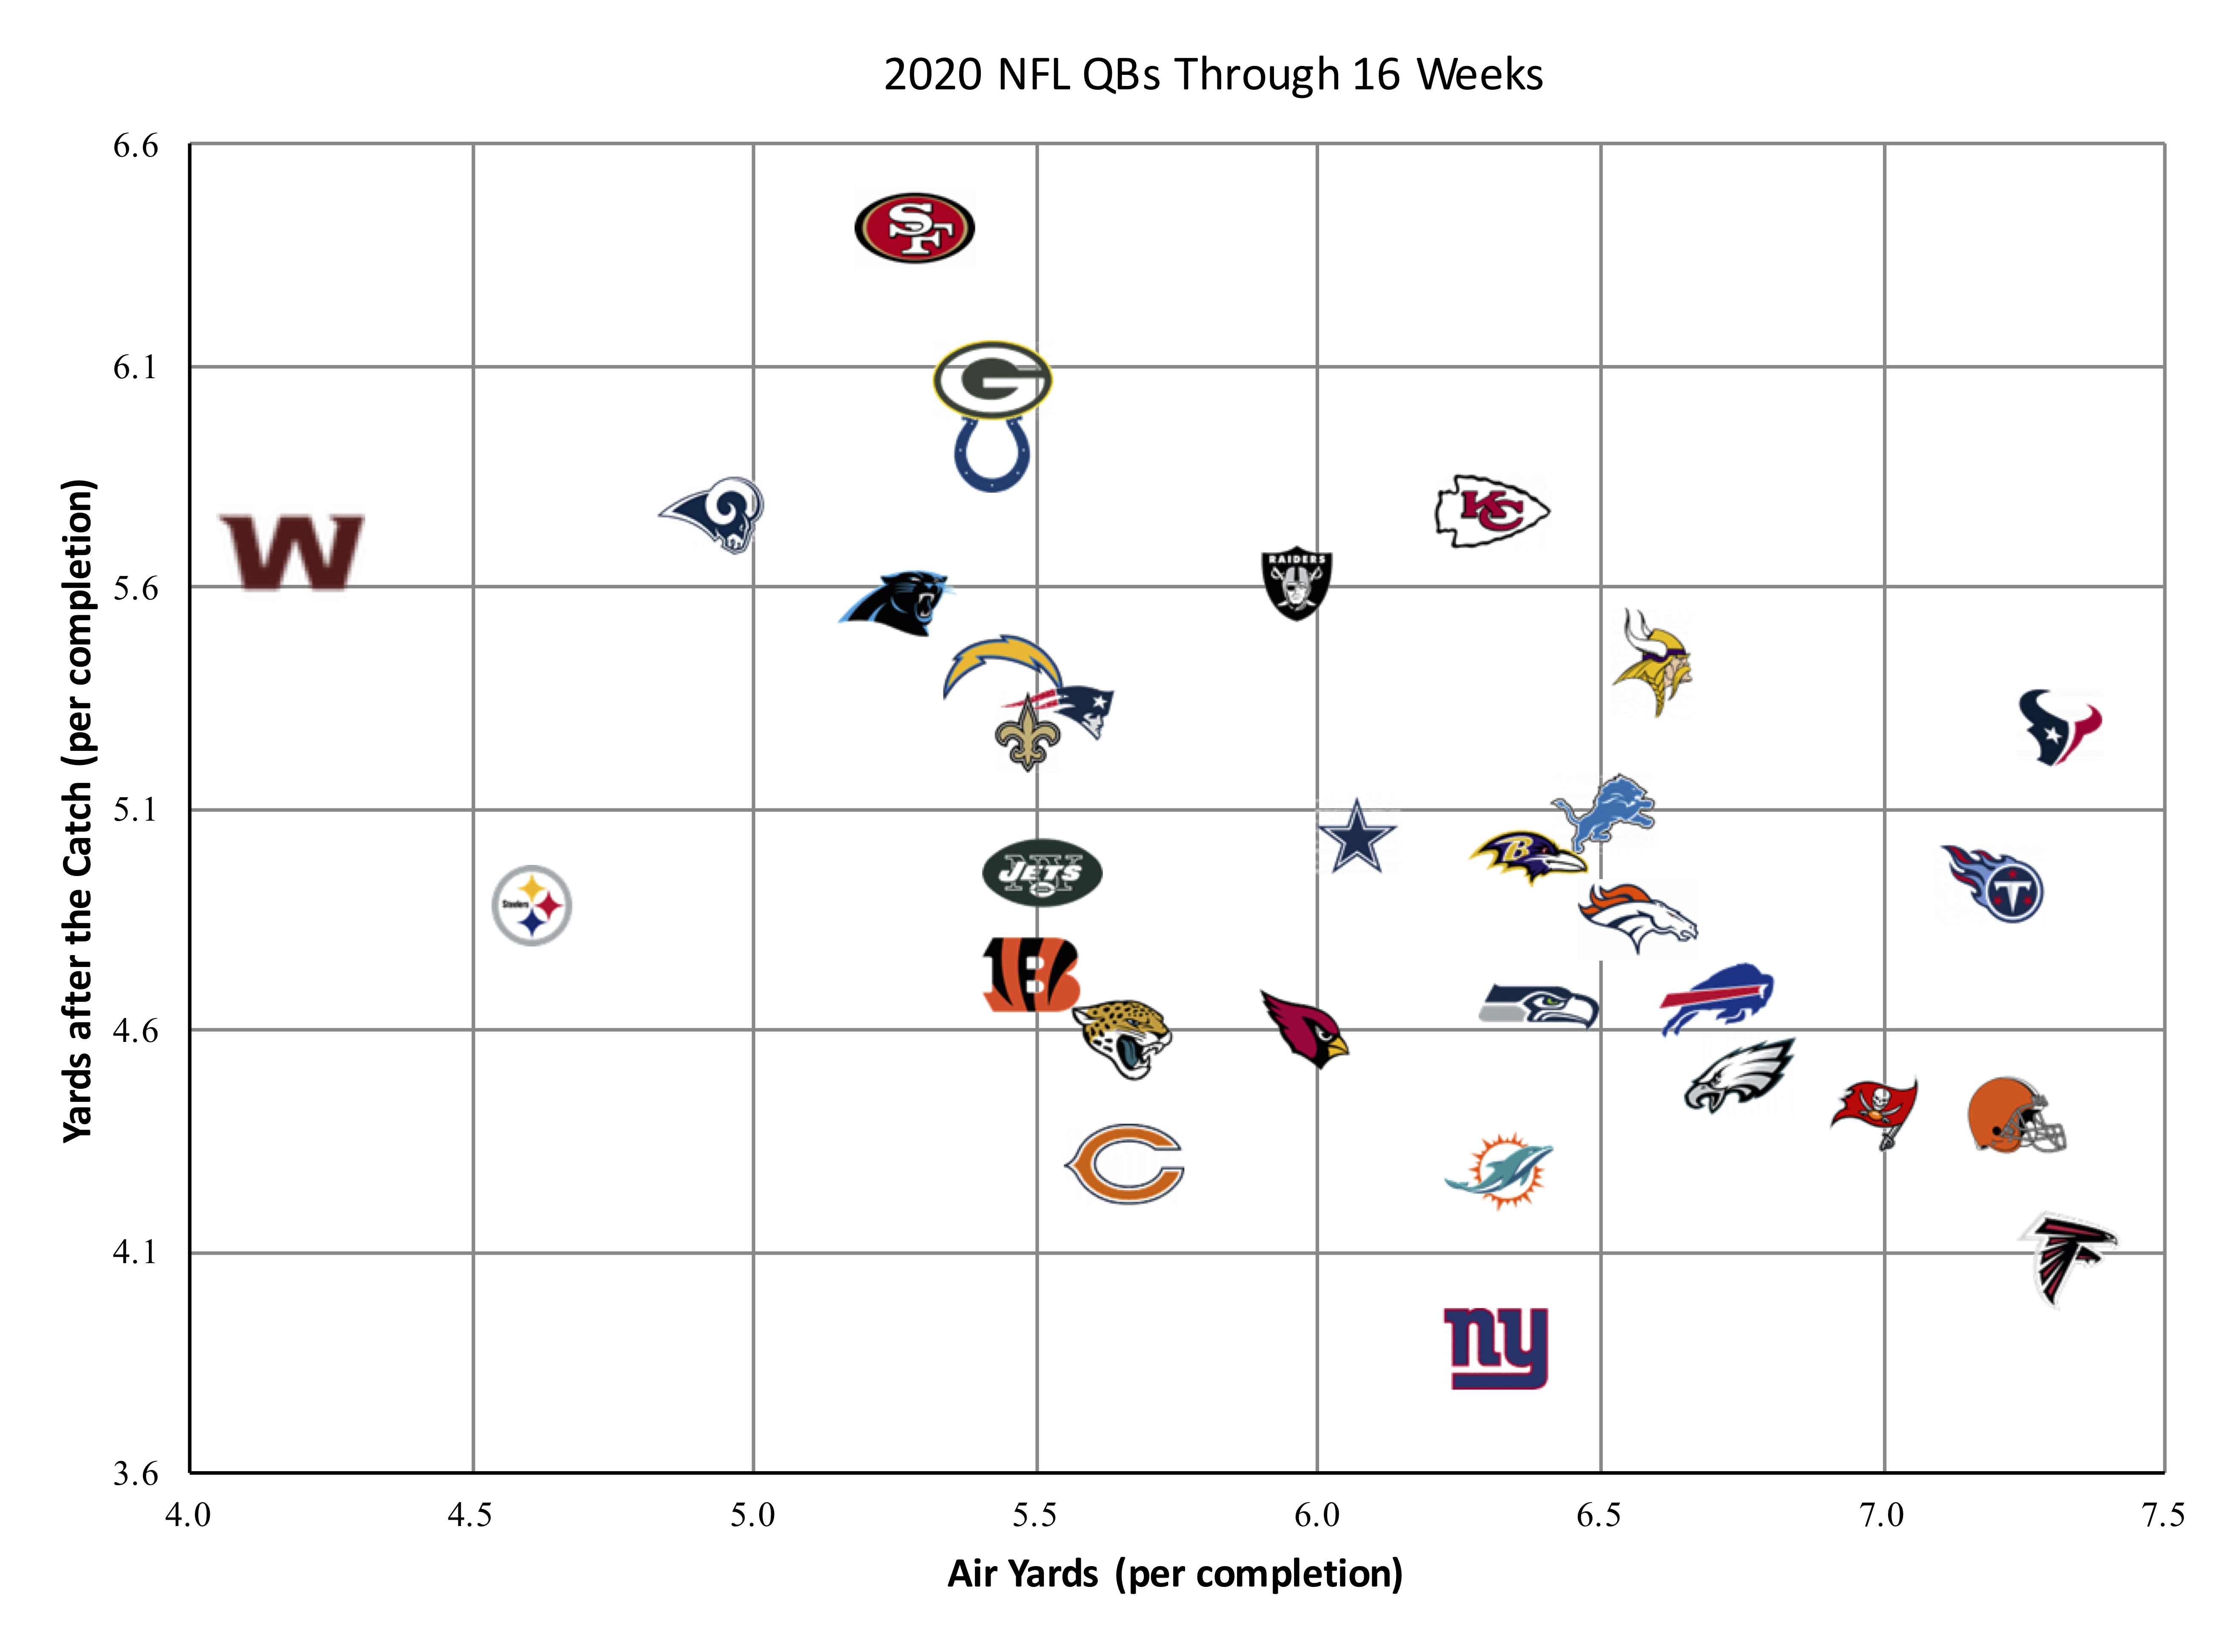
PFR tracks air yards and YAC for quarterbacks, with that data available here. I went ahead and compiled the data at a team level, using quarterback statistics only. The graph below shows how air yards (on the X-Axis) and yards after the catch (on the Y-Axis) for each team so far in 2020.
Adam Steele is back for another guest post. You can view all of Adam’s posts here. As always, we thank him for contributing.
It’s been a few years since I updated my Marginal Air Yards metric, so that’s what today’s post will do. I decided to make this a purely style based statistic rather than trying to combine style with efficiency. As such, here is the updated formula:
mAir = (completed air yards / completions – league average) * completions
Said simply, Marginal Air Yards represents the total depth of a passer’s completions compared to league average. A quarterback who averages 7.0 AirY/C on 300 completions in a league that averages 6.5 AirY/C will be credited with +150 mAir (i.e., 0.5 x 150). [continue reading…]
RB Christian McCaffrey had 867 receiving yards last year, while WR Chris Godwin had 842 receiving yards. But they got there in very different ways. McCaffrey gained just 16 of his receiving yards via “air yards” — yards gained on catches based on yards in the air the pass traveled from the line of scrimmage to the receiver — and 851 of his receiving yards came on yards gained after the catch. Godwin had 597 air yards, and 245 yards after the catch.
That’s an extreme split, but consistent with the general rule that running backs gain very little air yards (many of their receptions come from behind the line of scrimmage, which produces negative air yards) and a lot of yards after the catch. For wide receivers, about 60-70% of their yards come through the air, with the remainder coming after the catch.
Tight ends are interesting, by virtue of usually landing somewhere in between those two marks. The graph below shows data from the 2018 season, with air yards shown on the X-Axis and yards gained after the catch shown on the Y-Axis. Running backs are in red, tight ends are in green, and wide receivers are in blue. [continue reading…]
Jameis Winston‘s average pass completion has traveled 8.24 yards in the air, the longest distance in the league.
On Carson Wentz‘s average completion, the ball traveled 8.11 air yards.
And Marcus Mariota? His average completion picked up 7.61 air yards before being caught.
Those are the three most vertical passers in the NFL this season by that metric.
Last year, Winston and Mariota ranked 2nd and 3rd in this category: Winston’s average gain was 7.89 yards before being caught, Mariota’s 7.86. Cam Newton led all passers at 8.14 air yards on completed passes. But Wentz? He ranked 27th out of 30 qualifying passers, at 5.34 yards.
In 2015 — the rookie years for Winston and Mariota — Winston ranked 2nd behind Carson Palmer with an 8.13 average; Mariota was in the top 10 at 7.24.
Wentz is having a remarkable season: he ranks 4th in yards per pass attempt, and ranks 1st in yards per completion. Winston ranks only 4th in yards per completion, while Mariota is down at 11th in yards per completion. That’s because those two — and especially Mariota — aren’t getting much yards after the catch from their receivers. Mariota and Winston are both getitng just 4.2 yards of YAC per completed pass, ranking them both in the bottom six of that metric. Wentz ranks 19th with 4.8 YAC per completion.
The graph below shows Air Yards per completed passes for each quarterback in the 2017 season on the X-Axis, and Yards After the Catch per completed passes on the Y-Axis. Mariota, Wentz, and Winston are all to the far right of the graph, of course: [continue reading…]
Adam Steele is back to discuss Marginal YAC, this time in the context of the 2015 season. You can view all of Adam’s posts here.
Marginal Air Yards: 2015 Year In Review
Today I will be updating my Marginal Air Yards metric for the now completed 2015 season. New readers who aren’t familiar with Marginal Air Yards can get up to speed by reading my three part intro-series and 2014’s year in review.
There were 44 quarterbacks who threw at least 100 passes in 2015, and they are ranked by mAir below: [continue reading…]
Adam Steele is back to discuss Marginal YAC, this time in the context of the 2014 season. You can view all of Adam’s posts here.

Manning is more of a downfield thrower than you think
League-wide passing efficiency reached an all-time high in 2014 with a collective 6.13 Adjusted Net Yards per Attempt average. However, this past season was also the most conservative passing season in NFL history; 2014 saw the highest completion rate ever (62.6%), the lowest interception rate ever (2.5%), and also the lowest air yards per completion rate ever (5.91 Air/C). Passing yards were comprised of 51.4% yards through the air and 48.6% yards after the catch, the most YAC-oriented season in history. [2]Even though YAC data only goes back to 1992, I feel safe in using the phrase “all-time” with regard to YAC dependency. The offensive schemes of yesteryear emphasized downfield passing, which … Continue reading This trend shows no sign of reversing itself, so expect more of the same in 2015.
Here are the 2014 Marginal Air Yards (mAir) and Marginal YAC (mYAC) for quarterbacks with at least 100 pass attempts. The 2014 leader in Marginal Air Yards is…Peyton Manning? Yes, the noodle-armed, duck-throwing, over-the-hill Peyton Manning averaged 4.54 Air Yards per pass Attempt; given that the average passer on this list averaged 3.70 Air Yards per pass Attempt, this means Manning averaged 0.84 Air Yards per Attempt over average. Over the course of his 597 attempts, this means Manning gets credited with 500 marginal Air Yards, the most of any quarterback in the NFL. [continue reading…]
References
| ↑1 | A big thanks to Chad Langager at sportingcharts.com for helping me compile this data. |
|---|---|
| ↑2 | Even though YAC data only goes back to 1992, I feel safe in using the phrase “all-time” with regard to YAC dependency. The offensive schemes of yesteryear emphasized downfield passing, which generated far less YAC than the short passing games of today. |
Adam Steele is back for his third guest post in his Marginal YAC series.
In my two previous two posts, I introduced Marginal YAC and Marginal Air Yards. Today, I’m posting the career mYAC and mAir for the 96 quarterbacks with at least 1,000 pass attempts from 1992-2013. There’s a lot of data here, so I’ll let the readers do most of the commentary.
Here is a table of career Marginal YAC. The “Per 300” column is the rate of mYAC per 300 completions, or roughly equivalent to one full season. And on a “per season” basis, no quarterback benefited more from YAC than Steve Young, who also had four top-40 seasons. [continue reading…]
In 2013, Kenny Stills saw his average reception come 13.9 yards past the line of scrimmage, the farthest amount of yards in the air per catch of any receiver in the NFL. He’s the deep threat in the Saints offense, and he’s being utilized in a similar way this year, with his average catch from Drew Brees coming 12.8 yards downfield. When it comes to the top deep threats in the NFL, Stills and Arizona’s Michael Floyd stand out. Cardinals head coach Bruce Arians loves the vertical passing game, and Floyd has been the perfect weapon: he averaged a healthy 11.7 air yards per catch in 2013, but that number has spiked to 16.5 in 2014!
But not every player’s role is so static. In 2013, the Bengals used A.J. Green (average reception 10.5 yards in the air) and Marvin Jones (9.6) as deep threats, while Tyler Eifert (5.6), Mohamed Sanu (4.3), and Jermaine Gresham (4.2) were used on short/intermediate routes. But Jones will miss all of 2014 due to a foot injury, while Green has been limited to just 43% of the Bengals offensive snaps to date (and he was playing injured for a percentage of those plays, too). As a result, Sanu’s air yards per catch has jumped from 4.3 to 8.4, and his yards per reception has increased from 9.7 to 15.2.
Similarly, Emmanuel Sanders has seen his role change in 2014, as a result of switching teams. Last year, in Pittsburgh, Todd Haley’s offense called for lots of short routes for his wide receivers, but even among the wide receiver group, Sanders (6.3) had the shortest air yards per catch. Eric Decker, meanwhile, had his average reception come 10.8 yards downfield while playing with Peyton Manning. This year, Sanders — taking over Decker’s role — has averaged 10.3 yards in the air per catch.
The graph below shows wide receiver air yards in 2014 (on the X-axis) and 2013 (on the Y-axis): [continue reading…]
In early September, Adam Steele, a longtime reader and commenter known by the username “Red” introduced us to his concept of Marginal Yards after the Catch. Today is Part II to that post. Adam lives in Superior, Colorado and enjoys digging beneath quarterback narratives to discover the truth; hey, who can blame him?
Introducing Marginal Air Yards
There are three components of Y/A: Completion %, Air Yards/Completion, and YAC/Completion. In my last post I looked at YAC, so today, let’s look at the other two components. By multiplying completion percentage and air yards per completion, we get air yards per attempt, which we can then modify to create Marginal Air Yards (mAir):
mAir = (Air Yards/Attempt – LgAvg Air Yards/Attempt)*Attempts
Here are the yearly Air Yard rates since 1992, with the table sorted by Air Yards per Attempt:: [continue reading…]
Just above these words, it says “posted by Chase.” And it was literally posted by Chase, but the words below the line belong to Adam Steele, a longtime reader and commenter known by the username “Red”. And I thank him for it. Adam lives in Superior, Colorado and enjoys digging beneath quarterback narratives to discover the truth; hey, who can blame him? One other house-keeping note: I normally provide guest posters with a chance to review my edits prior to posting. But due to time constraints (hey, projecting every quarterback in the NFL wasn’t going to write itself!), I wasn’t able to engage in the usual back and forth discussion with Adam that I’ve done with other guest posters. As a result, I’m apologizing in advance if Adam thinks my edits have changed the intent of his words. But in any event, sit back and get ready to read a very fun post on yards after the catch. When I envisioned guest submissions coming along, stuff like this is exactly what I had in mind.
Introducing Marginal YAC
A quarterback throws a two yard dump off pass to his running back, who proceeds to juke a couple defenders and run 78 yards into the endzone. Naturally, the quarterback deserves credit for an 80 yard pass. Wait, what? Sounds illogical, but that’s the way the NFL has been keeping records since 1932, when it first began recording individual player yardage totals. The inclusion of YAC — yards after the catch — in a quarterback’s passing yards total can really distort efficiency stats, which in turn may distort the way he is perceived.
In response, I created a metric called Marginal YAC (mYAC), which measures how much YAC a quarterback has benefited from compared to an average passer. Its calculation is very straightforward:
mYAC = (YAC/completion – LgAvg YAC/completion) * Completions
I have quarterback YAC data going back to 1992 for every quarterback season with at least 100 pass attempts. [1]This data comes courtesy of sportingcharts.com. It’s obviously unofficial, but there doesn’t seem to be any noticeable biases from one team to another. Some unofficial stats, such as … Continue reading That gives us a healthy sample of 965 seasons to analyze, and includes the full careers of every contemporary quarterback. But first, let’s get a sense of what’s average here. The table below shows the league-wide YAC rates since 1992: [continue reading…]
References
| ↑1 | This data comes courtesy of sportingcharts.com. It’s obviously unofficial, but there doesn’t seem to be any noticeable biases from one team to another. Some unofficial stats, such as passes defensed or quarterback pressures, can vary wildly depending on the scorekeeper, but Sporting Charts’ YAC stats seem pretty fair, from what I can tell. Here is a link to the 2013 data. Chase note: I have not had the chance to compare these numbers to what is on NFLGSIS, but that’s a good idea. |
|---|
| Year | QBrec | Cmp | Att | Cmp% | Yards | TD | TD% | Int | Int% | Y/A | Y/C | PRate | ESPN QBR | Sk | Yds | NY/A | ANY/A | Sk% |
|---|---|---|---|---|---|---|---|---|---|---|---|---|---|---|---|---|---|---|
| 2004 | 1-6-0 | 95 | 197 | 48.2 | 1043 | 6 | 3.0 | 9 | 4.6 | 5.3 | 11.0 | 55.4 | 13 | 83 | 4.57 | 3.21 | 6.2 | |
| 2005 | 11-5-0 | 294 | 557 | 52.8 | 3762 | 24 | 4.3 | 17 | 3.1 | 6.8 | 12.8 | 75.9 | 28 | 184 | 6.12 | 5.63 | 4.8 | |
| 2006 | 8-8-0 | 301 | 522 | 57.7 | 3244 | 24 | 4.6 | 18 | 3.4 | 6.2 | 10.8 | 77.0 | 25 | 186 | 5.59 | 4.99 | 4.6 | |
| 2007 | 10-6-0 | 297 | 529 | 56.1 | 3336 | 23 | 4.3 | 20 | 3.8 | 6.3 | 11.2 | 73.9 | 27 | 217 | 5.61 | 4.82 | 4.9 | |
| 2008* | 12-4-0 | 289 | 479 | 60.3 | 3238 | 21 | 4.4 | 10 | 2.1 | 6.8 | 11.2 | 86.4 | 62.56 | 27 | 174 | 6.06 | 6.00 | 5.3 |
| 2009 | 8-8-0 | 317 | 509 | 62.3 | 4021 | 27 | 5.3 | 14 | 2.8 | 7.9 | 12.7 | 93.1 | 69.75 | 30 | 216 | 7.06 | 6.89 | 5.6 |
| 2010 | 10-6-0 | 339 | 539 | 62.9 | 4002 | 31 | 5.8 | 25 | 4.6 | 7.4 | 11.8 | 85.3 | 65.88 | 16 | 117 | 7.00 | 6.09 | 2.9 |
| 2011* | 9-7-0 | 359 | 589 | 61.0 | 4933 | 29 | 4.9 | 16 | 2.7 | 8.4 | 13.7 | 92.9 | 59.39 | 28 | 199 | 7.67 | 7.45 | 4.5 |
| 2012* | 9-7-0 | 321 | 536 | 59.9 | 3948 | 26 | 4.9 | 15 | 2.8 | 7.4 | 12.3 | 87.2 | 67.39 | 19 | 136 | 6.87 | 6.59 | 3.4 |
| Career | 78-57-0 | 2612 | 4457 | 58.6 | 31527 | 211 | 4.7 | 144 | 3.2 | 7.1 | 12.1 | 82.7 | 213 | 1512 | 6.43 | 5.94 | 4.6 |
Provided by Pro-Football-Reference.com: View Original Table
In 2011, Eli Manning threw for 4,933 yards and won the Super Bowl. Last year, he threw for 3948 yards and missed the playoffs. It’s tempting to think that something was “wrong” with Manning last year. Another narrative would be that 2011 was a career year far out of line with anything else he’s done, which would make 2012 was the real Manning. I’m not sure I buy either of those explanations.
Let’s start by comparing Manning’s numbers in 2011 and 2012. Yes, his passing yards dropped, but that’s a meaningless metric on its own. He threw 53 fewer passes in 2012, a partial explanation for why his yards declined. And while his yards per attempt did drop from 8.4 to 7.4, about 20% of that dip was mitigated by the fact that he took fewer sacks (his Net Yards per Attempt dropped from 7.7 to 6.9). In addition to improving his sack rate, Manning’s touchdown and interception rates were virtually identical, which means his decline was limited to pass attempts and yards per attempt.
We can break down the numbers on why his yards per attempt declined thanks to some additional data courtesy of NFLGSIS. In 2011, Manning averaged 8.4 yards per attempt. That was a result of three things: a 61.0% completion rate, 5.82 yards after the catch (per completion), and 7.92 Air Yards per Completed Pass. In 2012, Manning averaged 7.4 yards per attempt, with a 59.9% completion rate, 4.33 average YAC, and 7.97 Air Yards per Completed Pass.
The tiny drop in completion percentage is more than offset by the better sack rate, and if Manning was throwing incomplete passes instead of taking sacks, that’s a good thing. As for what happens when he completed a pass, his entire decline was in the form of yards after the catch. In 2011, he ranked 3rd in Air Yards per Completed Pass and 6th in YAC per completion; in 2012, he ranked 2nd in AY/CP and 30th in YAC per completion.
Now there’s some evidence to indicate YAC might be more on the quarterback than Air Yards. Other studies, and what I think is popular opinion, is that YAC is more about the receiver than the quarterback. But let’s further investigate why the Giants dipped in YAC. The table below shows a more precise breakdown. For both 2011 (in blue) and 2012 (in red), you can see the number of Receptions, Air Yards per Reception, YAC per reception, and Yards per Reception. The rows show each of the Giants top three receivers, top tight end, and top running back, along with the other players at wide receiver, tight end, and running back.
[continue reading…]
In 2008, Larry Fitzgerald had a fantastic regular season capped off by a historically great postseason; in the Super Bowl, he set the record for receiving yards in a season, including playoff games, with 1,977 yards. Of course, 2008 was decades ago in today’s era of what have you done for me lately. The table below shows Fitzgerald’s stats over the past four seasons. The final two columns show the total number of receiving yards generated by all Cardinals players and Fitzgerald’s share of that number.
| Year | Rec | Yds | YPR | TD | ARI Rec Yds | Perc |
|---|---|---|---|---|---|---|
| 2009 | 97 | 1092 | 11.3 | 13 | 4200 | 26% |
| 2010 | 90 | 1137 | 12.6 | 6 | 3264 | 34.8% |
| 2011 | 80 | 1411 | 17.6 | 8 | 3954 | 35.7% |
| 2012 | 71 | 798 | 11.2 | 4 | 3383 | 23.6% |
2009 was the last season of the Kurt Warner/Anquan Boldin Cardinals. The 97 receptions and 13 touchdowns look great, although hitting those marks and not gaining 1,100 receiving yards is very unusual. Fitzgerald was only responsible for 26% of the Cardinals receiving yards that season, although one could give him a pass since he was competing with another star receiver for targets.
Can Fitzgerald rebound in 2013?
In 2011, Skelton, Kevin Kolb and Bartel combined for 3,954 yards on 550 passes, a 7.2 yards per attempt average (Kolb was at 7.7 Y/A). That qualifies as a pretty respectable passing game and Fitzgerald appeared to have a monster year, gaining 35.7% of the Cardinals’ receiving yards (Early Doucet was second with 689 yards and Roberts was third with 586 yards). It’s always hard splicing out cause and effect, but my takeaway is that with a more competent passing game, Fitzgerald continued to get the lion’s share of the team’s production but unlike in 2010, this led to great and not just good numbers.
[continue reading…]
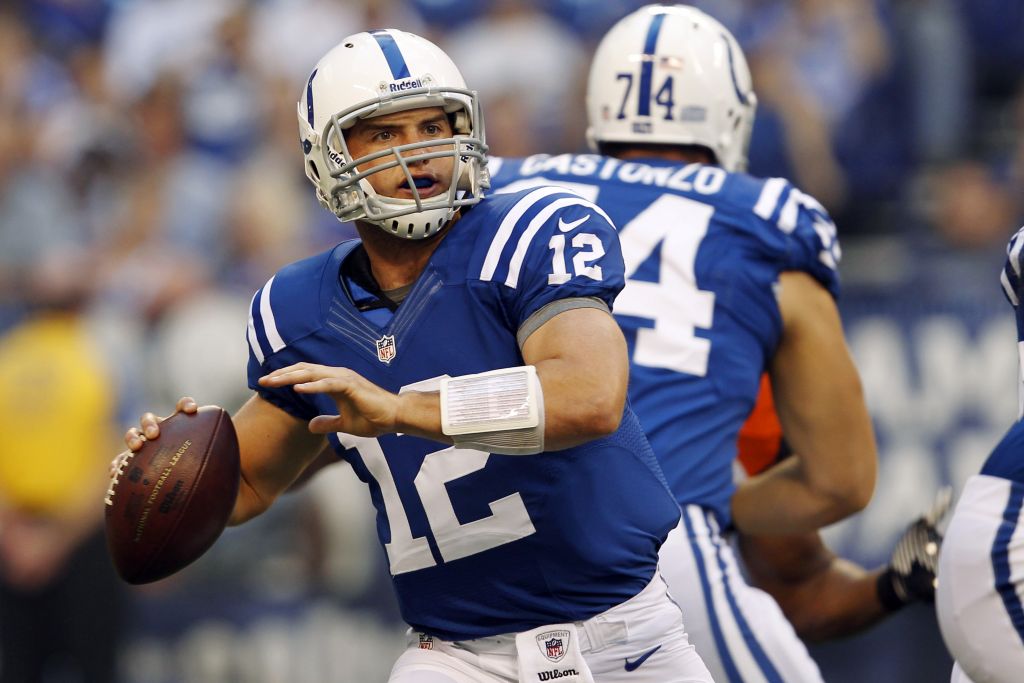
Luck winds up to throw deep.
But you rarely see Luck’s completion split into (a) 10 yards through the air, and (b) 15 yards after the catch by his receiver. Brian Burke calls those 10 yards “Air Yards” and I think that is a pretty useful moniker. The question is, what do you do with Air Yards? Luck led the NFL in Air Yards per completed pass last year (8.0), but that doesn’t make the statistic an indicator of quality. Tim Tebow’s 2011 performance produced the highest single-season Air Yards per completion average since 2006 (8.9), while Jake Delhomme (2008) and Derek Anderson (2010) each have led the league in that metric, too. Air Yards per completed pass is a very useful way to describe a player’s style, but you can’t use it alone to determine a player’s quality.
One question I have: Are Air Yards more repeatable for a quarterback than the yards he gains via his receivers’ YAC? It’s important to keep that question separate from this one: Is a quarterback who has a high number of air yards and a low YAC better than a quarterback in the opposite situation? Today, I plan to focus on the first question, but let’s take a second to address the second one.
According to ESPN’s research, yards after the catch is more about what the receiver does than the quarterback. As a result, a completion that is in the air for 40 yards is better for a quarterback’s ESPN QBR than a pass that is in the air for 5 yards on which the receiver runs for 35 yards after the catch. That makes sense, I suppose, and I suspect that’s probably true more often than not. The easiest counterargument is to point to Joe Montana, and say that what made Montana great was his pinpoint accuracy that enabled players like Jerry Rice to rack up big YAC numbers.I’m going to put off any further analysis of how much of YAC should be attributed to the quarterback and how much to the receiver, because it’s pretty complicated. One thing that is a bit easier to analyze is how “sticky” Air Yards are from year to year.
[continue reading…]
Have you taken a look at a passing leaderboard lately? Here’s the PFR passing leaderboard sorted by ANY/A; as always, all columns are sortable.
| Rk | QB | Tm | G | Cmp | Att | Cmp% | Yds | TD | TD% | Int | Int% | Y/A | AY/A | Y/C | Sk | Yds | NY/A | ANY/A | Sk% |
|---|---|---|---|---|---|---|---|---|---|---|---|---|---|---|---|---|---|---|---|
| 1 | Peyton Manning | DEN | 6 | 154 | 227 | 67.8 | 1808 | 14 | 6.2 | 4 | 1.8 | 8 | 8.4 | 11.7 | 10 | 63 | 7.4 | 7.8 | 4.2 |
| 2 | Josh Freeman | TAM | 6 | 104 | 187 | 55.6 | 1538 | 11 | 5.9 | 5 | 2.7 | 8.2 | 8.2 | 14.8 | 9 | 65 | 7.5 | 7.5 | 4.6 |
| 3 | Eli Manning | NYG | 7 | 169 | 265 | 63.8 | 2109 | 12 | 4.5 | 7 | 2.6 | 8 | 7.7 | 12.5 | 5 | 40 | 7.7 | 7.4 | 1.9 |
| 4 | Robert Griffin III | WAS | 7 | 133 | 189 | 70.4 | 1601 | 7 | 3.7 | 3 | 1.6 | 8.5 | 8.5 | 12 | 15 | 106 | 7.3 | 7.4 | 7.4 |
| 5 | Drew Brees | NOR | 6 | 166 | 273 | 60.8 | 2097 | 18 | 6.6 | 7 | 2.6 | 7.7 | 7.8 | 12.6 | 12 | 86 | 7.1 | 7.2 | 4.2 |
| 6 | Ben Roethlisberger | PIT | 6 | 155 | 235 | 66 | 1765 | 11 | 4.7 | 3 | 1.3 | 7.5 | 7.9 | 11.4 | 13 | 72 | 6.8 | 7.2 | 5.2 |
| 7 | Tom Brady | NWE | 7 | 186 | 285 | 65.3 | 2104 | 12 | 4.2 | 3 | 1.1 | 7.4 | 7.8 | 11.3 | 14 | 96 | 6.7 | 7.1 | 4.7 |
| 8 | Aaron Rodgers | GNB | 7 | 183 | 262 | 69.8 | 1979 | 19 | 7.3 | 4 | 1.5 | 7.6 | 8.3 | 10.8 | 26 | 142 | 6.4 | 7.1 | 9 |
| 9 | Matt Schaub | HOU | 7 | 140 | 222 | 63.1 | 1650 | 10 | 4.5 | 4 | 1.8 | 7.4 | 7.5 | 11.8 | 8 | 59 | 6.9 | 7 | 3.5 |
| 10 | Jake Locker | TEN | 4 | 67 | 106 | 63.2 | 781 | 4 | 3.8 | 2 | 1.9 | 7.4 | 7.3 | 11.7 | 3 | 16 | 7 | 6.9 | 2.8 |
| 11 | Matt Ryan | ATL | 6 | 160 | 236 | 67.8 | 1756 | 14 | 5.9 | 6 | 2.5 | 7.4 | 7.5 | 11 | 13 | 107 | 6.6 | 6.7 | 5.2 |
| 12 | Carson Palmer | OAK | 6 | 148 | 241 | 61.4 | 1732 | 7 | 2.9 | 4 | 1.7 | 7.2 | 7 | 11.7 | 12 | 93 | 6.5 | 6.3 | 4.7 |
| 13 | Alex Smith | SFO | 7 | 127 | 190 | 66.8 | 1427 | 9 | 4.7 | 5 | 2.6 | 7.5 | 7.3 | 11.2 | 18 | 100 | 6.4 | 6.2 | 8.7 |
| 14 | Joe Flacco | BAL | 7 | 150 | 252 | 59.5 | 1837 | 9 | 3.6 | 6 | 2.4 | 7.3 | 6.9 | 12.2 | 18 | 110 | 6.4 | 6.1 | 6.7 |
| 15 | Andy Dalton | CIN | 7 | 156 | 243 | 64.2 | 1831 | 13 | 5.3 | 10 | 4.1 | 7.5 | 6.8 | 11.7 | 17 | 102 | 6.7 | 5.9 | 6.5 |
| 16 | Cam Newton | CAR | 6 | 101 | 173 | 58.4 | 1387 | 5 | 2.9 | 6 | 3.5 | 8 | 7 | 13.7 | 15 | 102 | 6.8 | 5.9 | 8 |
| 17 | Tony Romo | DAL | 6 | 150 | 221 | 67.9 | 1636 | 8 | 3.6 | 9 | 4.1 | 7.4 | 6.3 | 10.9 | 9 | 59 | 6.9 | 5.8 | 3.9 |
| 18 | Ryan Fitzpatrick | BUF | 7 | 133 | 218 | 61 | 1435 | 15 | 6.9 | 9 | 4.1 | 6.6 | 6.1 | 10.8 | 8 | 44 | 6.2 | 5.7 | 3.5 |
| 19 | Christian Ponder | MIN | 7 | 152 | 227 | 67 | 1492 | 9 | 4 | 6 | 2.6 | 6.6 | 6.2 | 9.8 | 16 | 68 | 5.9 | 5.5 | 6.6 |
| 20 | Sam Bradford | STL | 7 | 131 | 219 | 59.8 | 1592 | 7 | 3.2 | 6 | 2.7 | 7.3 | 6.7 | 12.2 | 21 | 131 | 6.1 | 5.5 | 8.8 |
| 21 | Ryan Tannehill | MIA | 6 | 118 | 198 | 59.6 | 1454 | 4 | 2 | 6 | 3 | 7.3 | 6.4 | 12.3 | 12 | 109 | 6.4 | 5.5 | 5.7 |
| 22 | Matthew Stafford | DET | 6 | 164 | 264 | 62.1 | 1754 | 5 | 1.9 | 6 | 2.3 | 6.6 | 6 | 10.7 | 12 | 86 | 6 | 5.4 | 4.3 |
| 23 | Michael Vick | PHI | 6 | 136 | 231 | 58.9 | 1632 | 8 | 3.5 | 8 | 3.5 | 7.1 | 6.2 | 12 | 17 | 90 | 6.2 | 5.4 | 6.9 |
| 24 | Andrew Luck | IND | 6 | 134 | 250 | 53.6 | 1674 | 7 | 2.8 | 7 | 2.8 | 6.7 | 6 | 12.5 | 16 | 99 | 5.9 | 5.3 | 6 |
| 25 | Mark Sanchez | NYJ | 7 | 116 | 218 | 53.2 | 1453 | 9 | 4.1 | 7 | 3.2 | 6.7 | 6 | 12.5 | 14 | 77 | 5.9 | 5.3 | 6 |
| 26 | Jay Cutler | CHI | 6 | 106 | 187 | 56.7 | 1359 | 8 | 4.3 | 7 | 3.7 | 7.3 | 6.4 | 12.8 | 19 | 121 | 6 | 5.3 | 9.2 |
| 27 | Russell Wilson | SEA | 7 | 104 | 175 | 59.4 | 1230 | 8 | 4.6 | 7 | 4 | 7 | 6.1 | 11.8 | 14 | 97 | 6 | 5.2 | 7.4 |
| 28 | Brandon Weeden | CLE | 7 | 154 | 272 | 56.6 | 1783 | 9 | 3.3 | 10 | 3.7 | 6.6 | 5.6 | 11.6 | 11 | 69 | 6.1 | 5.1 | 3.9 |
| 29 | Philip Rivers | SDG | 6 | 139 | 209 | 66.5 | 1492 | 10 | 4.8 | 9 | 4.3 | 7.1 | 6.2 | 10.7 | 18 | 118 | 6.1 | 5.1 | 7.9 |
| 30 | Kevin Kolb | ARI | 6 | 109 | 183 | 59.6 | 1169 | 8 | 4.4 | 3 | 1.6 | 6.4 | 6.5 | 10.7 | 27 | 159 | 4.8 | 4.9 | 12.9 |
| 31 | Matt Hasselbeck | TEN | 5 | 96 | 156 | 61.5 | 931 | 5 | 3.2 | 4 | 2.6 | 6 | 5.5 | 9.7 | 10 | 74 | 5.2 | 4.7 | 6 |
| 32 | Blaine Gabbert | JAX | 6 | 88 | 158 | 55.7 | 906 | 6 | 3.8 | 3 | 1.9 | 5.7 | 5.6 | 10.3 | 15 | 105 | 4.6 | 4.5 | 8.7 |
| 33 | Matt Cassel | KAN | 5 | 103 | 176 | 58.5 | 1150 | 5 | 2.8 | 9 | 5.1 | 6.5 | 4.8 | 11.2 | 13 | 74 | 5.7 | 4.1 | 6.9 |
[continue reading…]