≡ Menu

Pittsburgh’s Aaron Donald Was Your Combine MVP

Building on yesterday’s post, I decided to crown a combine MVP because it’s February and there’s nothing else to do. I looked at each player’s combine results, courtesy of the great NFLSavant.com, in four different tests.

40-yard dash

There were 268 players with 40-yard dash times posted at NFL Savant. I ran a regression using weight as the input and 40-yard time as the output, and the best-fit formula (R^2 of 0.75) was:

[math]Expected 40 Time = 3.433 + 0.00554 * Weight[/math]

Using this formula, Jadeveon Clowney, with a weight of 266 pounds, would be projected to run the 40 in 4.91 seconds. Since he actually ran the 40 in 4.53 seconds, he gets credited for finishing +0.38 seconds above expectation. That was the best of any player in Indianapolis this year. The table below shows, for each of the 268 players (the table, by default, displays only the top 10, but you can change that in the dropdown box), their weight, their actual 40 time, their expected 40 time, and the difference. Auburn tackle Greg Robinson hopes be a top-five pick, and his 40 time does a good job displaying his athleticism. Pittsburgh’s Aaron Donald comes in third, but there will be plenty of reasons to talk about him later. [continue reading…]

{ 20 comments }

Thoughts on Jadeveon Clowney’s 40-yard dash time

The hype on Clowney is almost as wide as his wingspan

The hype on Clowney is almost as wide as his wingspan.

Jadeveon Clowney ran the 40-yard dash in 4.53 seconds, which only confirmed that the South Carolina star is an incredible athlete. But how freakishly insane is that time? The 40-yard dash, like every other aspect of the combine, is only useful when placed in proper context. The dash is biased in favor of lighter players; one way to control for this drawback is to measure Clowney only against defensive ends and linebackers, although that doesn’t totally solve the weight issue. That’s one reason Football Outsiders has published a Speed Score for running back prospects, calculated as (Weight * 200)/(40 time^4).

The website NFLsavant.com is an excellent source of historical combine data going back to 1999. I looked at all the defensive ends and outside linebackers with 40-yard times over that period, and ran a few regressions to get a sense of the relationship between weight and speed. A simple one worked just as well as the more complicated ones, and that formula produced an R^2 of 0.30. That best-fit formula was 40-yard time = 3.609 + 0.00455*weight. So for Clowney, at a weight of 266 pounds, he would be projected to run the 40 in 4.82 seconds. Since Clowney actually ran it in 4.53 seconds, that means he was 0.29 seconds faster than we would expect.

That is really, really good, although you already knew that. Here’s some more context. NFLSavant.com has 706 defensive ends or outside linebackers since 1999 with 40-yard times. Clowney, by rating 0.29 seconds better than expected, comes in ahead of 700 of those players. The other five?

[continue reading…]

{ 9 comments }

Predictions in Review: AFC South

During the 2013 offseason, I wrote 32 articles under the RPO 2013 tag. In my Predictions in Review series, I review those preview articles with the benefit of hindsight. Previously, I reviewed the AFC West and the NFC West. Today, the AFC South, beginning with a straightforward case in Tennessee.

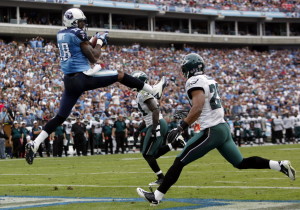
Britt smoked the Eagles secondary

Britt smoked the Eagles secondary.

Can Kenny Britt become the next great wide receiver?, July 9, 2013

Spoiler alert: Kenny Britt did not become the next great wide receiver, at least in 2013 (apparently, I still can’t quit him). Britt is an easy player to fall in love with, if you ignored the warning signs. He was just 20 years old when he played in his first NFL game in 2009. In 2010, he led all players in yards per route run according to Pro Football Focus, but his raw numbers underhwlemed because the Titans were a run-heavy team and Britt missed 30% of the season with a hamstring injury. In 2011, he matched his elite YPRR production, but a torn ACL/MCL tear ended his season after 94 pass routes.

He struggled in 2012, but I was willing to write that off due to recovering from the ugly knee injury, additional hamstring and ankle injuries, and a first-year starter in Jake Locker. That set up 2013 as a season where I thought Britt had great breakout potential. I interviewed Thomas Gower, of Total Titans and Football Outsiders, and asked him his thoughts. Gower was more pessimistic than I was about Britt, and for good reason.

As it turned out, Britt never seemed quite right mentally (in more ways than one); he struggled with drops and was eventually dropped behind Justin Hunter and Kendall Wright on the depth chart. He finished the year with 11 catches for only 96 yards and no touchdowns. In late December, Britt said he would definitely be a #1 wide receiver somewhere in 2014, which means I’m susceptible to falling into the Britt trap again. [continue reading…]

{ 2 comments }

The 1956 NFL Season: The Forward Pass on Life Support

The history of offense in the NFL is not a linear one. The early ’70s was the dead-ball era of the passing game, and it’s largely true that pass frequency and efficiency have steadily increased since then. But NFL teams passed more frequently in the ’60s than they did in the ’70s, and passing ratios wildly fluctuated in the ’50s. The picture below shows the league-average pass ratio for the NFL [1]I have excluded the AFL statistics from this data set. for each year from 1950 to 1980. Pass ratio is simply defined as (Pass Attempts + Sacks) / (Pass Attempts + Sacks + Rush Attempts).

p-r rat2

As you can see, 1956 represents a huge outlier over the 30-year period. Pass ratios dropped significantly in 1956, increased slightly in 1957, and then spiked back up, seemingly without reason. The other main valley, of course, was in the mid-1970s. The pass-to-run ratio dropped every year after the merger before plummeting to 43% in ’73. It spiked back up temporarily in ’74 and ’75 before dropping again, bottoming out at 42% in ’77 and necessitating the 1978 rules changes.

The next graph shows the league-average ANY/A for each season (in green) and the Adjusted Yards per Carry average (Rushing Yards + 20*Rushing TDs) / (Rush Attempts) in red. As you can see, passing was slightly more effective than rushing in the mid-’60s, which presumably caused a shift towards more passing. As pass efficiency decreased, so did pass attempts. [continue reading…]

References

References
1 I have excluded the AFL statistics from this data set.
{ 14 comments }

Brown was number one in 2013

Brown was number one in 2013.

Wide receiver is a notoriously difficult position to analyze using statistics. Era adjustments are arguably more important here than at any other position, but even within the same season it is not easy to compare wide receivers. Most people, myself included, would probably say that Josh Gordon or Calvin Johnson was the best wide receiver in football in 2013. Gordon, after all, led the NFL in receiving yards despite missing two games, while Johnson is well, Megatron. If you place more emphasis on other metrics, you would be interested to know that Pierre Garcon led the NFL in receptions, while Jimmy Graham led all players in receiving touchdowns (and Demaryius Thomas led all wide receivers in that statistic).

But, as you can tell from the title of this post, it was Pittsburgh’s Antonio Brown who led all players in True Receiving Yards. Regular readers are familiar with the concept of True Receiving Yards, but walking through the system with both Brown and Gordon will serve as a useful reminder.

Let’s start by recognizing that Brown’s season was special in its own right: he became the first player to record 50 receiving yards in 16 different games in a single season. He also finished 2nd in both receptions and receiving yards, so it doesn’t take much processing through the True Receiving Yards machine to vault Brown into first place. He ended the year with a 110-1499-8 stat line, while Gordon finished 2013 with 87 catches for 1,646 yards and nine scores.

The first step in the True Receiving Yards calculation is to convert each player’s stat line into a single statistic, Adjusted Catch Yards. By giving each player 5 yards for each reception and 20 yards for each touchdown, Brown is credited with 2,209 Adjusted Catch Yards and Gordon 2,261, making them the top two players in 2013 by that metric. [continue reading…]

{ 3 comments }

Estimated DVOA Ratings From 1950 to 2013

For over a decade, Football Outsiders has been publishing its DVOA grades. Last week, Andreas Shepard, a loyal reader of both FO and this site, came up with estimated DVOA ratings going back to 1950. You can read the fine print on how he derived the formula in the Methodology section at the end of this post. Andreas did an excellent job looking at some of the best and worst teams in many different DVOA categories, so you should give his article a read. But to me, at least, the real value of team ratings for over 1600 teams in 8 different categories is as a reference piece. And since the tables I create here are both sortable and easily searchable, I’ve worked with Andreas to present the team ratings in a way to make life easy for the reader. Consider these like an encyclopedia for team ratings, available for you to find the team you’re interested in whenever you like.

Andreas created estimated DVOA ratings for each year from 1950 to 2013 (remember, Football Outsiders has posted actual DVOA ratings published for each year from 1989 to 2013, but I am providing the estimates for each year.) The table below shows all 1638 teams from 1950 to 2013; here’s how to read the table below, which is sorted from best to worst in Total DVOA. The Packers (you can click the link to see Green Bay’s PFR page that year) in 1962, playing in the NFL, rank as the top team in estimated DVOA. That year, Green Bay went 13-1 with a winning percentage of 0.929 and a points differential of 19.1 points per game.

The Packers had an Offensive Pass DVOA grade of 18.9% and an Offensive Run DVOA grade of 23.0%; all DVOA ratings are centered around 0%, so this shows how the Packers were well above average in both offensive measures. For defensive ratings, negative grades are better, and the Packers have an incredible -33.2% estimated Defensive Pass DVOA grade, along with a -8.6% estimated Defensive Run DVOA grade. The Packers’ Total Offensive DVOA grade was 21.4%, the Total Defensive DVOA grade was -20.7%, and the Special Teams DVOA grade was 5.8%. Finally, the Packers have a total estimated DVOA of 47.9%, the best since 1950. If you type “gnb” into the table below, you will see all Packers teams. You can type in any team’s code to see just their teams, or sort the table by any of the categories available.

[continue reading…]

{ 10 comments }

When will a team go an entire game without running?

Belichick checks to see if anyone has gone a whole game without calling a run yet

Belichick checks to see if anyone has gone a whole game without calling a run yet.

The record for fewest rush attempts in a game is 6, set by the 2004 Patriots and tied by the ’06 Cardinals. The circumstances there are as you would expect. The Patriots fell behind 21-3 in the first quarter to the Steelers in 2004, and Pittsburgh owned the league’s top rush defense. In 2006, the Cardinals faced the Minnesota Vikings, owners of one of the greatest rush defenses in history. Minnesota allowed just 985 yards (the second lowest in modern history) on 2.8 yards per carry (the third lowest mark of the modern era) in 2006. That day, the Cardinals didn’t fall behind early, but called on Matt Leinart to throw 51 passes compared to just four Edgerrin James runs. It was not a winning formula, but I’m not sure Denny Green had the wrong strategy.

But will a team ever go a full game without attempting a run? In college, the floor has also been six runs, at least in recent memory. Baylor — with coach Guy Morris, who coached under Hal Mumme and next to Mike Leach at both Valdosta State and Kentucky — was the first, calling just six runs on the road against the 2006 Texas Longhorns. A year later in Austin, it was Leach who orchestrated the only other six-carry game since 2005. That day, he put the game in the hands of Graham Harrell (36/48, 466 yards, 5 TDs, 1 INT), Michael Crabtree (9/195/2), Danny Amendola (8/82) and Edward Britton (8/125/1), but alas, the Red Raiders defense couldn’t stop Jamaal Charles.

I suppose we should wonder when the first 5-carry game will occur before asking about the first 0-carry game. But it’s a Sunday in the offseason, so I’ll throw this one out to the crowd. Will we ever see a 0-carry game? If so, how many years from now until it occurs? Against the Bills this year, the Ravens called 31 straight passing plays but still passed on “only” 86% of all plays from scrimmage. What will it take to get that percentage to 100?

{ 15 comments }

Journal of Sports Analytics Seeks Contributions

I’m confident that Football Perspective’s readers are some of the brightest on the internet. Now, perhaps, comes a chance to prove it. The Journal of Sports Analytics is asking for submissions, and this new journal aims to be the central forum for the discussion of practical applications of sports analytics research, serving team owners, general managers, coaches, fans, and academics. The journal is requesting analytical research on any single sport or across sports that seeks to improve the understanding of the game or strategies for improving a team or a league. More information is available here.

Several journals exist that touch on the sports analytics field, but the focus practical application is what I think will make the Journal of Sports Analytics stand out (and also make it more appealing to the average reader). The journal’s advisory board is very impressive, and comprises Rich Cho, Tim Connelly, Marc Cuban, Eric DeCosta, Kevin Demoff, Dell Demps, Jessica Gelman, Dan Kantrovitz, Tony Khan, Ted Leonsis, Sig Mejdal, and Daryl Morey. The editorial board further includes top sports analysts and practitioners from various teams and leagues across a variety of sports. The publisher is IOS Press.  The co-editors in chief are Philip Maymin and Eugene Shen.

There are no author submission fees, and all submissions will be double-blind peer reviewed. Initial submissions must be in PDF format and anonymized (names, affiliations, and acknowledgments removed), but otherwise may be in any convenient style. There are no page limits. If accepted for publication, your paper must be revised to meet the journal’s style guidelines.

Your submission may not be under review at any other journal while it is under review at the Journal of Sports Analytics and it may not have been previously published or accepted for publication in a journal. Presentations at conferences, appearances in conference proceedings, and working papers posted online are typically not considered as previous publication, and such submissions are welcomed. It is often useful to incorporate comments from seminars and conferences into a longer, more detailed version to submit to the journal for review.  Contact information for Philip and Eugene is available at the journal’s website.

{ 1 comment }

Should Division Winners Get Home Field?

In the 2013 playoffs, the 12-4 San Francisco 49ers had to play a road game against the 8-7-1 Green Bay Packers. It’s hard to justify situations like this, especially when the NFC West was one of the best divisions in football history and the NFC North was below average. Division winners are automatically given a home game under the current NFL structure, but the NFL is reportedly open to modifying that rule. I thought this would be a good idea, with one caveat; after further investigation, I no longer even have a caveat.

Let’s start with an acknowledgment: there is no “traditional” NFL playoff format. The NFL has modified its playoff system more times than anybody other than Jason Lisk can remember. There are no automatic rules regarding home field: in 1934, West champion Chicago went 13-0 and had to play the East champion Giants in New York because the league alternated which division was the host each year, and even years were East years. Two years later, the 10-1-1 Packers had to play at 7-5 Boston for the same reason.

Even in more recent times, it was not unusual for the best team in the league to have to win a road playoff game. In the 1968 playoffs, the famed 13-1 Colts — thought to be one of the greatest teams in football history prior to Super Bowl III — had to win in Cleveland to win the NFL championship and earn the right to play in the Super Bowl. [1]After realignment in 1967, the West division was selected to host the title game in ’67 (the Ice Bowl) and ’69 (Vikings over Browns), while the East would get home field in ’68 and … Continue reading The 1972 Dolphins (14-0) had to play at Pittsburgh (10-4) in the AFC Championship Game, as that was the AFC Central’s year to have first priority.

Even a wildcard hosting a division winner is not unprecedented. 1982 was a very weird year because of the strike, but you’d be hard-pressed to find a weird result than this one: the NFC Central champion Packers (5-3-1) had to play at NFC East runner-up Dallas (6-3), while the NFC Central runner-up Vikings (5-4) got to host the NFC West champion Falcons (5-4). That’s because following the players’ strike, the league simply seeded teams 1-8 that year because of the abbreviated schedule. [continue reading…]

References

References
1 After realignment in 1967, the West division was selected to host the title game in ’67 (the Ice Bowl) and ’69 (Vikings over Browns), while the East would get home field in ’68 and … well, the East drew the short end of the stick when the AFL-NFL merger took effect in 1970.
{ 10 comments }

Predictions in Review: NFC West

During the 2013 offseason, I wrote 32 articles under the RPO 2013 tag. In my Predictions in Review series, I review those preview articles with the benefit of hindsight. Last week was the AFC West; this week, the NFC West.

Let’s begin in Arizona, where I actually got one right.

Questioning the Narrative on Larry Fitzgerald, June 20, 2013

The conventional wisdom was that Larry Fitzgerald was going to have a bounce-back year in 2013. That view was widely-held: in fact, I caged a lot of my negative Fitzgerald comments with caveats, as it felt like criticizing Fitzgerald was just something football writers didn’t do. Fitzgerald was one of the game’s best wide receivers when Kurt Warner was under center, and it felt wrong to argue with folks who wanted to give him a pass for the mediocre numbers he produced with John Skelton/Ryan Lindley/Kevin Kolb. With Carson Palmer in Arizona in 2013, the expectation was a big year for Fitzgerald. Instead, he produced 82 passes for only 954 yards, although he did score 10 touchdowns.

For the second year in a row, Fitzgerald failed to lead his team in receiving yards per game, with Andre Roberts (2012) and Michael Floyd (2013) instead earning those honors. So what’s happened with Fitzgerald? I have no idea, but he’s certainly not the same player he was during the Warner/Anquan Boldin days. And while the touchdowns made sure he wasn’t a complete fantasy bust, he gained just 22.2% of all Cardinals receiving yards in 2013, somehow falling short of his 23.6% mark in his miserable 2012 season. [continue reading…]

{ 6 comments }

Projecting Team Wins Using DVOA

For a decade, Football Outsiders has been using advanced analytics to measure and predict team performance. And since the Football Outsiders database now goes back to 1989, I thought it would be worthwhile to test the predictive power of Football Outsiders’ ratings.

If you’re not familiar, FO uses DVOA as its base measure of team strength. The goal here is to use DVOA ratings in Year N to predict win totals in Year N+1. Now, what expectations should we have for DVOA? The fact that the team with the best DVOA in history — Washington in 1991 — won only 9 games the following season is not a knock on DVOA. That was an outstanding Super Bowl team that declined significantly the following year. Ditto the 16-0 Patriots looking less impressive without Tom Brady in 2008. But at a minimum, DVOA must do better at predicting future wins than say, just wins. And it should also do better than Pythagenpat ratings, which only incorporate points scored and points allowed. So does it?

Let’s start with the basics. The best-fit formula [1]Over the period 1989 to 2012, excluding the 1994, 1998, and 2001 seasons. to project wins in Year N+1 using *only* wins in Year N is:

5.343 + 0.332 * Year N Wins (Correlation Coefficient: 0.32)

And, as shown last week, by using Pythagenpat wins, we get a correlation coefficient of 0.36. So what happens if we instead use Year N DVOA as our input? We get the following best-fit formula:

8.01 + 6.378 * DVOA (Correlation Coefficient: 0.39)

As a result, DVOA does beat both regular wins and the Pythagenpat ratings. Now, what if we use both DVOA ratings and number of wins to predict future wins? As it turns out, the wins variable was nowhere near significant (p = 0.61), which means once we know the DVOA ratings, knowing the number of wins adds no predictive power. In other words, the evidence doesn’t prove that a team with a lot of wins but an average DVOA rating is better than a team with an average number of wins and an average DVOA rating.

But can we improve on DVOA? What if instead of using Team DVOA as our input, we use Offensive DVOA, Defensive DVOA, and Special Teams DVOA? Team DVOA obviously incorporates all three of these elements, but perhaps analyzing team strength on a more granular level will tell us more about the appropriate weights. Keeping in mind that for defenses, a negative DVOA grade means an above-average defense, here is the best-fit formula to predict future wins with those three inputs:

8.01 + 6.779 * OFFDVOA – 5.642 * DEFDVOA + 6.518 * STDVOA

[continue reading…]

References

References
1 Over the period 1989 to 2012, excluding the 1994, 1998, and 2001 seasons.
{ 20 comments }

Smith against the Bucs

Smith looks to go deep against the Bucs.

We were very spoiled last year. Andrew Luck, Robert Griffin III, and Russell Wilson had outstanding rookie seasons in 2012, and perhaps that set expectations a bit high for the 2013 class. No one will confuse those three with EJ Manuel, Geno Smith, and Mike Glennon, all of whom struggled for most of their rookie seasons. But while Smith and Glennon didn’t produce excellent numbers, they produced very interesting ones.

Among the 35 quarterbacks with the most pass attempts, Glennon finished a very pedestrian 27th in Adjusted Net Yards per Attempt. But he did it in a very unique way: Glennon had an outstanding 19/9 touchdown-to-interception ratio, but he ranked dead last in Net Yards per Attempt. One reason for that is Glennon averaged only 10.6 yards per completion, the 3rd worst average among the 35 passers.

Smith finished 34th in ANY/A, largely due to his horrific 12/21 TD/INT ratio. He was a bit better in NY/A, ranking 28th, but what’s interesting about the Jets quarterback is that he ranked 7th in yards per completion. That metric is not a particularly effective measure of passer quality — after all, Matt Ryan ranked 35th — but it is a pretty good way to describe a quarterback’s style. While both Glennon and Smith were below average, they were below average in very different ways. [continue reading…]

{ 10 comments }

The Thamel/Evans column on Michael Sam is Reprehensible

That not a peep was heard, through a 12-2 season and a Cotton Bowl victory, says more about football’s readiness to accept gay players than thousands of speculative words. — Michael Tanier, Sports on Earth

By now you know that Michael Sam, a star defensive end at Missouri, is set to become the first openly-gay, active NFL player. Regular readers know that I rarely use this platform to criticize other writers. But an article by Pete Thamel and Thayer Evans discussing how Sam’s sexual orientation will cause his draft stock to drop is worthy of a deviation from my general rule. [Update: A reader sent me a great article by Stefan Fatsis that goes into further detail on the failure of SI in this story. Go ahead and read his article and then come back; don’t worry, this article will still be here.]

[Sam’s] decision to come out prior to May’s NFL draft will make his path to the league daunting, eight NFL executives and coaches told SI.com.

In blunt terms, they project a significant drop in Sam’s draft stock, a publicity circus and an NFL locker room culture not prepared to deal with an openly gay player. Sam, the SEC Defensive Player of the Year, was projected as a mid- to late-round draft pick prior to his announcement.

While none of the executives overtly condemned Sam’s decision, their opinions illuminated an NFL culture in which an openly gay player — from the draft room to the locker room — faces long odds and a lonely path.

The executives and coaches were granted anonymity by SI.com for their honesty. Their answers were consistently unsparing.

At first glance, it felt odd that — in an article asking NFL executives and coaches for honest information — Thamel and Evans did not even mention the fact that NFL executives and coaches do not volunteer honest information to the media about a draft prospect in February. But after reading the full article, it’s easy to see why that omission occurred. Sam’s draft status is not the point of the article; rather, his stock is simply a vehicle to “inform” us that the NFL has a culture that will not accept an openly gay player. Then, in what I would consider to be a reprehensible bit of journalism, Thamel and Evans focused exclusively on those who bashed anonymously and made no effort to find those who would praise Sam publicly.

“I don’t think football is ready for [an openly gay player] just yet,” said an NFL player personnel assistant. “In the coming decade or two, it’s going to be acceptable, but at this point in time it’s still a man’s-man game. To call somebody a [gay slur] is still so commonplace. It’d chemically imbalance an NFL locker room and meeting room.”

A teammate risks chemical imbalance, touches Sam anyway

A teammate risks chemical imbalance, touches Sam anyway.

What does it mean to say that we are a decade or two away from being “ready” for an openly-gay player? What does Unnamed Personnel Assistant expect to happen between now and 2029 that will make the NFL “ready” for an openly-gay player? What does being “ready” even mean? Nate Burleson, Sheldon Richardson, and countless other NFL players have publicly praised and supported Sam, which I guess is not as insightful as to the dynamic of an NFL locker room as the anonymous musings of Unnamed Personnel Assistant.

More shockingly, how could Thamel and Evans not touch the “football is a man’s man game” line? Is the journalistic standard so low that we may tacitly approve of the implication that gay men are not manly men because an anonymous executive said as much? I would not have that quote under my byline, but that’s just me.

Kudos to the investigative powers of Thamel and Evans to discover that gay slurs are commonplace in the locker room. As we have learned from the Richie IncognitoJonathan Martin scandal, so are racial slurs. Would Thamel-Evans and/or the anonymous personnel assistant say we are not ready for racially integrated locker rooms?

When the anonymous executive said that a gay man would chemically imbalance a locker room, a responsible journalist would ask what the hell that means. Based on the apparent lack of any follow-up question, it appears that neither Thamel nor Evans did as much, and were instead happy to get their soundbite.

“I just know with this going on this is going to drop him down,” said a veteran NFL scout. “There’s no question about it. It’s human nature. Do you want to be the team to quote-unquote ‘break that barrier?'”

The first question you might have after seeing those quotes is why is a veteran NFL scout not being asked for his thoughts on Michael Sam the football prospect. Your second question should be in regards to why Thamel and Evans chose to run a quote about where Sam will be drafted from a scout and not an executive, although you can probably answer that question yourself. As to the scout’s question, I think that answer is pretty obvious: several teams would want to be the team to break that barrier. The Patriots appear to be one, and the Lions, Giants, and Packers all publicly stated that they would welcome Sam on their team. So either Thamel and Evans are such incompetent journalists [1]I’ll note that this is a legitimate possibility. that they couldn’t find a source in time to publicly say as much, or they simply weren’t interested in finding one.

If Sam is among that group of [similarly-rated] players, the potential distraction of his presence — both in the media and the locker room — could prevent him from being selected.

“That will break a tie against that player,” the former general manager said. “Every time. Unless he’s Superman. Why? Not that they’re against gay people. It’s more that some players are going to look at you upside down. Every Tom, Dick and Harry in the media is going to show up, from Good Housekeeping to the Today show. A general manager is going to ask, ‘Why are we going to do that to ourselves?'”

The former general manager said that it would take an NFL franchise with a strong owner, savvy general manager and veteran coach to make drafting Sam work. He rattled off franchises like Pittsburgh, Green Bay, San Francisco, Baltimore and Indianapolis as potential destinations. The former general manager added that a team with a rookie head coach would not be an ideal landing spot.

Artificially creating a small market for a player is Smoke Screen 101, an issue that Thamel and Evans never discuss. To the larger point, there is an element of truth that some general managers are going to break ties against Sam. But the two journalists appear to be interested in muckraking and little more. Consider the questions left unasked:

  • Are there any teams that will break ties in favor of Sam? Will certain owners or general managers be attracted to the prospect of positioning himself as this generation’s Branch Rickey, the general manager who signed Jackie Robinson? Almost certainly.
  • What is the media’s responsibility and role in this story as the medium becomes the message. The media’s coverage of Sam seems likely to impact the very events — i.e., his draft stock, and perhaps his career — the media is covering. This, along with any concomitant moral responsibility that may or should be attached to such reporters, is a worthy topic for discussion that is instead ignored.
  • If teams break ties against Sam, is that appropriate? Is such a decision acceptable, or worthy of our condemnation? Again, Thamel and Evans are mind-bogglingly silent on this point. And let’s not confuse being neutral with being unbiased. The distinction between reporter and columnist is already blurred when picking and choosing your anonymous sources. I would have gained respect for Thamel and Evans had they followed that quote with a paragraph along these lines: “We don’t doubt that some decision makers in draft rooms across the country will break ties against Sam. That’s unfortunate, but we understand that general managers with tenuous job security are hesitant to take the road less traveled. That doesn’t make it right, but we acknowledge that many people lack the courage to be implements of social change, and that’s true even when they’re jobs aren’t on the line. Still, it is hard not to be disturbed by a system that would see Sam’s draft stock fall because of his declaration.”

But, of course, there was no such paragraph. And then, incredibly, Thamel and Evans found more ways to be horrible.

Sam’s announcement did not come as a surprise to most NFL teams. Sam’s sexual orientation was considered an open secret in his college town of Columbia, Mo., and the assistant personnel man said he believed “90 percent of teams” were already aware that Sam was gay and had dropped him on their draft boards. He estimated that of the 32 NFL franchises, only two or three didn’t know prior to Sunday night’s news. He projected that it will impact Sam’s draft status “quite a bit.”

Multiple NFL executives questioned Sam’s decision to come out now, as he will be the biggest story in football between now and the NFL draft on May 8. The NFL combine from Feb. 22-25 could turn into a four-day referendum on Sam’s professional future. And his place in the NFL draft will be endlessly debated between now and May.

Those ellipses in between the two paragraphs represent just one omitted paragraph. I make note of this, because apparently Thamel and Evans forget what they wrote two paragraphs earlier. Nearly every team knew that Sam was gay, all of his college teammates knew, and many in Columbia were aware, too. Is it really hard to understand why Sam would want to take control of his destiny? Sam’s sexual orientation was already known, and was going to be a topic of conversation. He risked his status being leaked to the public, with Sam then being forced to respond to such rumors. Shouldn’t we applaud his decision to own his truth? By coming out — literally — and letting the world know, Sam chose to be proactive and aggressive, character traits previously were assumed to be well-received by NFL executives and coaches, even anonymous ones.

It is hard to overstate the importance of a gay person’s decision to come out. According to the American Psychological Association: “Coming out is often an important psychological step for lesbian, gay, and bisexual people. Research has shown that feeling positively about one’s sexual orientation and integrating it into one’s life fosters greater well-being and mental health. This integration often involves disclosing one’s identity to others; it may also entail participating in the gay community. Being able to discuss one’s sexual orientation with others also increases the availability of social support, which is crucial to mental health and psychological well-being.”

Was that too challenging for Thamel and Evans to discover? Were they unable to come up with an answer when asked why Sam chose to make his announcement right before the time when a draft prospect’s mental and psychological well-being gets stressed the most? The decision to come out has unique implications for African Americans, so much so that the Human Rights Campaign has published a resource guide on the subject specifically geared for African Americans. The guide opens with this quote from a Howard University student: “Fear can be paralyzing and can often trap you in silence. It’s the fear of going against our religious upbringing, of losing friends and families, and of shattering the dream that most parents have for us as children. But I have found that coming out has not only strengthened the bonds I have with the people in my closest circle, but has also made me feel whole and complete as a person. The day I chose to live without regret or shame was the day I chose to really live.”

If anonymous executives want to criticize Sam for the timing of his decision of choosing to live his life without shame or regret, their opinions are as valuable as the names attached to them. It was not unintentional that I did not link to Thamel and Evans’ article. But I will link to another article at CNN SI, a much more worthy one from the always terrific Stewart Mandel.

References

References
1 I’ll note that this is a legitimate possibility.
{ 18 comments }

Contest Results: Tom Brady’s 2013 Season

Most Brady projections overshot their target

Most Brady projections overshot their target.

In the summer, I ran a contest to predict the final stats that Tom Brady would produce in 2013. Suffice it to say, nearly everyone was much more bullish on Brady than they should have been: of the 21 contest entries, 19 of them projected Brady to finish with a better ANY/A average than what he actually produced.

The average entry predicted 603 pass attempts, 4,467 yards, 30.8 TDs, 10.4 INTs, 28 sacks, and 139 sack yards lost, for an average ANY/A of 7.09.  In reality, Brady ended the year with 628 attempts, 4,343 yards, 25 TDs, 11 INTs, 40 sacks, and 256 sack yards lost. Basically, the group over-projected his Yards per Attempt by half a yard, expected six more touchdowns, and 12 fewer sacks. Brady’s ANY/A was 6.13, nearly one full adjusted net yard below the average projection.

The winning entry goes to Joe: [continue reading…]

{ 6 comments }

When I went on the Advanced NFL Stats Podcast in late December, I discussed my use of Z-scores to measure the Seattle pass defense. Host Dave Collins asked me if I was planning on using Z-scores to measure other things, like say, Adrian Peterson’s 2012 season. I told him that would be an interesting idea to look at in the off-season.

Well, it’s the off-season. So here’s what I did.

1) For every season since 1932, I recorded the number of rushing yards for the leading rusher for each team in each league. So for the Minnesota Vikings in 2012, this was 2,097.

2) Next, I calculated the average number of rushing yards of the top rusher of each other team in the NFL. In 2012, the leading rusher on the other 31 teams averaged 974 yards.

3) Then, I calculated the standard deviation of the leading rushers for all teams in the NFL. In 2012, that was 386 yards.

4) Finally, I calculated the Z-score. This is simply the difference between the player’s average and the league average (for Peterson, that’s 1,123), divided by the standard deviation. Peterson’s Z-score was 2.91, good enough for 15th best since 1932. The table below shows the top 250 seasons using this method from 1932 to 2013; it’s fully searchable and sortable, and you can change the number of entries shown by using the dropdown box on the left. [continue reading…]

{ 7 comments }

Predictions in Review: AFC West

During the 2013 offseason, I wrote 32 articles under the RPO 2013 tag. For some of the teams, the article functioned as a team preview, but in most cases, it was just my way of researching something I found interesting about each team. I thought it would be fun — and perhaps educational — to go back and review each of those articles. Today, we’ll begin with the AFC West.

Are the Chiefs better than your average worst team?, May 16, 2013

The point of this article was to examine a Chiefs team that was inconsistent on paper. Kansas City was a bottom-2 team in the NFL in 2012 based on record, SRS, and the efficiency models of both Advanced NFL Stats and Football Outsiders. On the other hand, Kansas City sent six players to the Pro Bowl in 2012, and went 17-15 over the prior two seasons.  Here was the threshold question in the article:

So, when projecting the 2013 Chiefs, how much “bonus” credit do we give them for having a bunch of Pro Bowlers or for being a pretty good team (based solely on record) the prior two years? And what about the fact that they added Andy Reid, Alex Smith, Anthony Fasano, and Donnie Avery (and Eric Fisher, Travis Kelce, and Knile Davis) on offense and Sean Smith, Dunta Robinson, and Mike DeVito on defense?

I questioned the legitimacy of some of the value of the six Pro Bowlers, but noted that having a good record the prior two seasons may net the team an extra win or two. Here was my conclusion:

Most bad teams experience a lot of turnover, and the Chiefs are no different. As bad as they were in 2012, a new coach and a new quarterback can solve a lot of problems. According to Vegas, the Chiefs are projected to be about 2.3 points worse than average, which jives with the 6.5 win total projected for the team. Kansas City has also hired Chris Ault as a consultant, and the father of the Pistol offense could mean the Chiefs are actually fun to watch this year. I’m cautiously optimistic about the Chiefs, but they seem unlikely to resemble last year’s version in style or production. That has to be considered a very good thing.

We all know what happened: Kansas City started the season 9-0, and finished 11-4 before resting 20 starters in the season finale against San Diego. The additions of Reid and Smith turned out to be outstanding, and defensive coordinator Bob Sutton did an excellent job with the defense. But the biggest change between the Chiefs in 2012 and 2013 was in the turnover department. After finishing with 24 more giveaways than takeaway in 2012, the Chiefs were +18 in the TO department in 2013. That’s the biggest improvement in one season since 1970, and the fourth largest improvement ever: [continue reading…]

{ 2 comments }

The AP’s All-Pro Voting Process Is a Joke

In early January, the Associated Press announced its All-Pro team. The voting process is pretty simple: 50 voters select their top players at each position, and a first-team All-Pro squad is announced.  The runners-up at each position are placed on the second-team, but that leads to some very odd results. If fans, teams, and Hall of Fame voters are going to put weight on a player being considered a 2nd-team All-Pro, then the voters should actually vote for both a first and second team. Simply naming the second vote getter (or third and fourth vote getters at positions with two starters) as the second-team All-Pro(s) invites significant abuses of the system.

Let’s take a look at the detailed voting breakdown.  I’ve bolded the first-team All-Pro(s) at each position, and italicized the second-team “choices.”

Quarterback

Peyton Manning, Denver, 50.

This one’s pretty easy.

Running Back

LeSean McCoy, Philadelphia, 48; Jamaal Charles, Kansas City, 47; Adrian Peterson, Minnesota, 1; Eddie Lacy, Green Bay, 1.

Did you hear that Eddie Lacy was a second-team All-Pro choice in 2013? That’s because one voter — presumably one in Wisconsin — decided that Lacy was better than McCoy or Charles in 2013. And that’s it. Is Lacy, or for that matter, Peterson, a more-deserving choice as a 2nd-team All-Pro than Matt Forte, Marshawn Lynch, Alfred Morris, Knowshon Moreno, or DeMarco Murray? Who knows — and that’s the point. The 2nd-team All-Pro honors going to Peterson and Lacy are essentially meaningless pieces of information. All we know is that 1 voter out of 50 decided that those two were top-2 running backs in 2013. Gregg Rosenthal noted that it was a shame that Forte was passed over for 2nd-team honors, and I agree with that sentiment. But Forte wasn’t passed over in the literal sense: had the 50 voters actually selected a second-team pair of running backs, I suspect Forte would have been chosen.

It’s also worth noting that it appears as though 3 voters selected only one running back. Brilliant.

Fullback

Mike Tolbert, Carolina, 31; Marcel Reece, Oakland, 8; Anthony Sherman, Kansas City, 5; Bruce Miller, San Francisco, 4; John Kuhn, Green Bay, 1.

Anyone want to offer me 49:1 odds that the AP voter who selected Kuhn also selected Lacy?

Tight End

Jimmy Graham, New Orleans, 49; Vernon Davis, San Francisco, 1.

Vernon Davis was a 2nd-team All-Pro in 2013 because…. 2% of all voters thought Davis was better than Jimmy Graham. Graham should have been a unanimous pick, but we all know what happened here: some voter decided that he wanted Davis to get some love, and figured he could ensure such accolades by placing Davis on the 2nd team by casting just one vote for him. I love Davis, and think he’s probably an underrated player nationally, but how can anyone give any credibility to this “accomplishment”?

[continue reading…]

{ 35 comments }

Pythagenpat Records in 2013

Brett  Keisel

Brett Keisel.

For years, sports analysts have used Pythagorean records as more granular measure of team strength than pure record. We’re not exactly at the point where Pythagorean records are mainstream, but I think, at least with respect to readers of this blog, people are pretty comfortable using Pythagorean records.

For the uninitiated, the use of Pythagorean records in sports dates back at least 30 years, and probably longer. Bill James is generally credited with popularizing this approach in baseball, and the same analysis has since been applied to just about every other spot. The formula to calculate a team’s Pythagorean winning percentage is always some variation of:

(Points Scored^2) / (Points Scored ^2 + Points Allowed^2)

My research has discovered that for football, the best-fit exponent is 2.57. However, football is subject to points inflation.  The best-fit exponent for the NFL in 1972 is not necessarily the best one for 2002 or 2013. This is particularly relevant now, as the 2013 season was the second highest scoring in history. [1]In fact, it came in just four hundredths of a point behind the 10-team, 12-game 1948 schedule Moreover, the same exponent that works for a Broncos game does not necessarily work for a Panthers game. [continue reading…]

References

References
1 In fact, it came in just four hundredths of a point behind the 10-team, 12-game 1948 schedule
{ 8 comments }

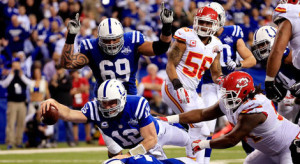
Superman wears #12 in Indianapolis now.

Superman wears #12 in Indianapolis now.

The NFL playoffs began in very entertaining fashion in Indianapolis. The Chiefs lost Jamaal Charles on the first drive of the game to a concussion, but stormed out to a 38-10 lead. Then the Colts pulled off the second greatest comeback in NFL history, eventually winning 45-44. The much-maligned Alex Smith had the game of his life, finishing 30 of 46 for 378 yards, with 4 touchdowns and no interceptions while also rushing for 57 yards.

Of course, Andrew Luck had an incredible game, too, even if it wasn’t necessarily as efficient. Luck went 29/45 for 443 yards and 4 touchdowns to counter his 3 interceptions, rushed for 45 yards, and recovered a Donald Brown fumble and ran it in for the touchdown.

Which made me wonder: where does this game rank among the greatest quarterback battles? To make life simpler, I’m only going to look at passing statistics, although obviously both players added some value on the ground. Smith averaged 9.23 Adjusted Net Yards per Attempt, defined as (Passing Yards + 20*TD – 45*INT – Sack Yards) divided by (Pass Attempts + Sacks). The NFL average in 2013 was 5.87 ANY/A, which means Smith produced 3.36 ANY/A over average. And, since he had 48 pass attempts (including sacks), that means Smith provided 161 yards over average.

Luck’s averages were hurt by the three interceptions, but he still produced 8.23 ANY/A and therefore 2.41 ANY/A over average. That means, over his 46 dropbacks, he produced 111 yards of value over average. So where does that mean this game ranks among all playoff games since 1970? My initial thought was to simply add the two value over average numbers, but that ended up producing a list dominated by great games by one quarterback. To counter this, I decided to only look at games where both quarterbacks were above average and to instead take the Harmonic Mean of their values. This wound up producing a pretty good list, and it places Luck/Smith at #9. [continue reading…]

{ 5 comments }

Insane Ideas: Rules Changes

Should the depth of the NFL end zone be extended from 10 to 20 yards? Practically, this is probably impossible, as adding 20 yards to certain fields would be an issue in many NFL stadiums. But let’s ignore that issue for today. I recently had lunch with a baseball friend of mine who suggested this change. My initial reaction was that this would be a bit odd, but there are several reasons to like his idea:

1) My baseball friend — let’s just call him Sean — doesn’t like how compressed things are at the goal line. Why are teams in effect penalized for getting down to the 1 yard line? Why make things easier on the defense?

If you think about it, there’s no reason for the end zone to be ten yards deep. If you are someone who believes we need more rules to promote defense, would you be in favor of making the end zone five yards deep? If not, why not? What makes ten the right number?

We have been conditioned by announcers to believe that life is tougher near the goal line for NFL offenses, and that this is a good thing. Does that make sense?

2) The goal posts would remain at the back of the end zone, which has three benefits. One, the extra point would now be slightly more difficult, which would quiet that controversy. Two, teams might be a little more likely to go for it on 4th and goal, as a 30-yard field goal isn’t as much of a gimme as a 20-yarder. But most importantly, when it’s fourth-and-three from the 30 yard line, teams would now go for it. Perhaps idiot-proofing coaching isn’t a desirable reason for change, but I am in favor of most rules that result in less kicking.

3) This would allow for 119-yard returns, a trade-off that I’m willing to make even if it lowers the possibility of an Orlovsky happening.

So what do you guys think? Feel free to leave your thoughts in the comments, or go in a different direction and post your own insane idea rules change. Here’s one of mine: in the final two minutes of the fourth quarter, the clock stops on a play that does not gain yards.

The purpose of this hypothetical rule change would be to stop teams from taking a knee to end the game. I don’t expect this to be a very popular idea, although the Pro Bowl actually implemented this rule this year. But watching teams battle for 58 minutes and then have the game essentially end with 2 minutes left always rubbed me the wrong way. I know, I know, the winning team earned the right to do it. That doesn’t mean I have to like it. I’d rather see a team have to at least gain a yard to end the game. I’m pretty sure all 32 coaches would hate this rule, but it would certainly make the end of certain games more exciting. That’s a pretty risky statement, I know, because it’s hard to top the victory formation for excitement.

{ 44 comments }

Yesterday, I looked at the average height of the receivers of each team in the NFL in 2013. Today, we’ll use the same method but look at every NFL team since 1950. As it turns out, the 2013 Bears rank as one of the third tallest group of receivers in history. The only thing Chicago didn’t have was a 6’8 Harold Carmichael.

The table below shows the 200 teams with the tallest average receivers since 1950. A couple of famous teams are at the top of the list, including the 2007 Super Bowl champion Giants. Eli Manning will never be confused with a hyper-accurate quarterback, so it was smart of the Giants to surround him with tall targets like Plaxico Burress, Amani Toomer, and Jeremy Shockey. The 1998-2000 Minnesota Vikings with Randy Moss, Cris Carter, Jake Reed, and Andrew Glover, all made the top 25. And before Chicago had Brandon Marshall, Alshon Jeffery and Martellus Bennett, the Bears had another trio of monster wide receivers: Harlon Hill, Bill McColl, and Jim Dooley. [continue reading…]

{ 4 comments }

Chicago's twin towers

Chicago's twin towers.

In Marc Trestman’s first year as head coach, the Chicago Bears quickly turned into one of the most explosive offenses in football. Even after losing Jay Cutler, backup quarterback Josh McCown came in and seamlessly executed Trestman’s offense.

Chicago ranked in the top 5 in passing yards, passing touchdowns, net yards per pass attempt and points, an impressive accomplishment for a franchise that seemed permanently stuck in 1958. And while the Bears have a lot of talented offensive players, the first thing that stands out to you when watching Chicago is that they look like a basketball team. I don’t write that because of the way the team throws the ball, but because the receivers actually look like basketball players. Chicago’s top three receivers are Brandon Marshall and Alshon Jeffery (each 6’4) and tight end Martellus Bennett (6’7): those are easy targets to spot for whomever is at quarterback for the Bears.

I calculated the average receiving height of each team during the 2013 NFL season by taking a weighted average of the height of each player on each team, weighted by their percentage of team receiving yards. For example, Jeffery caught 31.9% of all Chicago receiving yards, so his 76 inches counts for 31.9% of Chicago’s average height.  Bennett gained 17.1% of the team’s receiving yards, so his 79 inches counts for 17.1% of Chicago’s average height, and so on. The table below shows the average height for each team in 2013, along with the percentage of team receiving yards and height for each team’s top four receiving leaders: [continue reading…]

{ 5 comments }

The Best Scoring Offenses Since 1932

Denver had one of the greatest offenses ever

Denver had one of the greatest offenses ever.

On Monday, I looked at the greatest defenses — measured simply by points allowed and adjusted for strength of schedule — in NFL history. Today, I want to look at which offenses were the greatest in regular season history, and see where the 2013 Broncos stack up.

As noted in the post on defenses, during Super Bowl week, Bill Barnwell’s article ranked Denver’s 2013 offense as the greatest scoring machine ever. He used the statistical measurement known as the Z-Score to show that Denver’s offense was 3.3 standard deviations above average, and no offense had ever been 3.3 standard deviations above average before.

Where does that 3.3 number come from? Denver averaged 37.9 points per game during the regular season. The league average was 23.4 points, which means that Denver’s offense was 14.5 PPG better than average. The standard deviation of points per game among the 32 NFL offenses in 2013 was 4.36 points; therefore, Denver gets a Z-score of 3.32, because the Broncos scored points at a rate that was 3.32 standard deviations better than the mean. [continue reading…]

{ 8 comments }

Peyton Manning’s Legacy

Can you spot the GOAT?

Can you spot the GOAT?

Super Bowl XLVIII was the nightmarish end to the dream season had by Peyton Manning and the Broncos. After the greatest scoring season in NFL history, Denver’s high-powered offense was held to just 8 meaningless points against one of the greatest defenses in NFL history. Great players have been having bad games on the biggest stages since the beginning of sports. But the NFL world has a unique reaction when that player is Manning; for him, every loss is yet another building block on his Narrative(TM).

When Tom Brady leads the greatest scoring offense in NFL history to 14 points against a defense that allowed 22 points per game during the regular season, it does not become part of his narrative. When Joe Montana leads the 49ers to just three points in back-to-back playoff losses to the Giants, those games are pushed to the footnotes section of his biography. When the favored Colts were shut out by the Browns in the 1964 NFL title game, that goose egg did not become indelibly intertwined with the legacy of Johnny Unitas. Our memory of Otto Graham‘s 1953 season is that it was one of the greatest quarterback seasons in football history, even if he went 2/15 for 20 yards with no touchdowns and two interceptions in a losing effort in the NFL title game. We remember Sammy Baugh as one of the greatest players ever, forgetting that he was the face of an embarrassing 73-0 loss to the Bears in the 1940 championship game. For most quarterbacks, ugly playoff performances are quirks of history; for Manning, they become bullet points in a character assassination.

Mike Tanier already discussed the silliness that surrounds Manning’s career. Detractors have played “move the goal posts” for nearly two decades with Manning, beginning with his high-profile losses in college. Even after Manning seemingly silenced the last anti-Manning argument, his detractors just invented a new game.

He led his team to a Super Bowl victory. He began to reliably beat Brady’s Patriots. Instead of installing Manning’s legacy behind shatterproof glass, we just juggled harder. One Super Bowl victory, plus another loss, simply isn’t enough for this particular player! The bar for true greatness is multiple Super Bowl victories, an easy standard to set if you are a Patriots fan or a television analyst who shared a locker room with Troy Aikman! It’s a wonder we did not go back and retroactively demand an Orange Bowl or two.

Today’s post is not written to make you feel bad for Peyton Manning. You should not. But the question that has been repeatedly asked over the last three weeks – What is Peyton Manning’s legacy? – is one that is easy to answer. His legacy is that he’s the greatest quarterback ever. That’s not a very exciting answer in the world of #HOTTAKES, but it’s the truth.

We’re past the point of debating how valuable Manning has been in the regular season. Two years ago, I concluded that Manning was the greatest statistical quarterback in NFL history, and that’s before he even donned a Broncos uniform. That analysis didn’t consider how the Colts fell from Super Bowl contender to worst team in the league in the span of one Manning injury. That analysis didn’t consider that in his first year with the Broncos, Denver set the record for the largest year-to-year increase in completions, because that result was preordained. That analysis isn’t based on the MVPs, the All-Pros, the Pro Bowls, or anything but the numbers. I’ll re-run the study this summer, but the only question is how much farther ahead of the competition Manning’s increased his lead.

Attacking Manning’s numbers is a fool’s errand. As a result, as Manning’s regular season production has taken on mythic proportions, the anti-Manning crowd has begun to use that success as a sword. He’s the best regular season quarterback of all time, they will say, emphasizing those two words as if they were agents of disease.

Manning’s teams have struggled in the playoffs. Manning has struggled some, too, although not nearly as much as some believe. Is it surprising that Manning has an 11-12 career playoff record? I suppose so, because we’re at the point that literally every single time Manning loses a game we are surprised. Over the last nine seasons, there have been just seven games where Manning’s team lost as an underdog. [1]This excludes three meaningless end-of-year games where Manning was the nominal starter before sitting on the bench for the rest of the game, and the Colts were underdogs for precisely that reason. … Continue reading A Manning loss is an event, a mystery to be solved, a bat signal for the Manning truthers to emerge.

Some — perhaps many — will argue that Manning is not the greatest quarterback ever. Instead of Manning, that title should be reserved for Montana, or Brady, or Unitas. With Montana, the argument always goes back to the #4RINGZ (although you rarely hear about Bart Starr and his #5RINGZ). As a football historian, I find it disheartening that Montana is mostly remembered as a four-time champion, because he was one of the greatest regular season quarterbacks ever. You never hear Montana referred to as one of the greatest statistical quarterbacks or one of the greatest regular season passers, because those are Naughty Words. But Montana was. And he should be lauded for that.
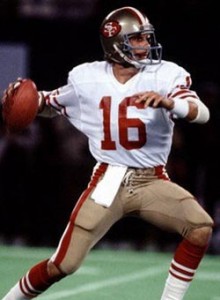
One of the greatest regular season quarterbacks ever

One of the greatest regular season quarterbacks ever.

The Montana over Manning argument is simple: Montana is better because he went 4-0 in Super Bowls, while Manning is 1-2. Such hard-hitting analysis ignores the fact that in each of the four seasons Montana won the Super Bowl, the 49ers defense ranked in the top three in either yards allowed, points allowed, or both. For Manning, “only one Super Bowl” is a scarlet letter. The common argument goes, “How could the greatest quarterback ever only win one Super Bowl?” That’s a fair question to ask, but we know the answer: the playoffs are a single elimination tournament where random events happen. Montana threw three interceptions and lost a fumble in the 1981 NFC Championship Game, but the 49ers still won. In Super Bowl XXII, Montana nearly lost the game with a pass that hit Lewis Billups in the hands, but the defensive back couldn’t catch the ball. Montana was a better quarterback in the playoffs than Manning, but he also lost twice as 8+ point favorites. In one of those games, he was benched. Montana may be the second greatest quarterback of all time, but his resume is not beyond reproach.

“How could the greatest quarterback of all time win just one championship?” is Manning’s burden to bear, but it’s not hard to frame anti-Montana questions, either. After all, why did he only win two MVP trophies? That question is no more — and no less — fair than the Manning one. How great could Montana have really been if he did not win a single MVP trophy in his first ten seasons? After finally winning the award in back-to-back seasons, his replacement won the same award twice in the next five years? Shouldn’t we expect the greatest quarterback ever to be the best player in his league more than twice? Let Montana win three more MVP awards, and then we can talk about him being better than Manning.

The MVP question isn’t the only one out there. If Montana was so great, how come the Associated Press only named him a first-team All-Pro three times in his career? Shouldn’t the greatest player at his position in NFL history be recognized as the best player at his position more than three times in his career? Manning’s done it seven times! Be named the best player at your position four more times, then talk.

Those who believe Montana or Brady are better than Manning will not be convinced otherwise. I have no interest in yet another Brady/Manning debate. I would not deem it a coincidence that Montana and Brady were coached by Bill Walsh and Bill Belichick, the two best coaches of the last 30 years. I would not be so quick to blame Manning for losing in the Super Bowl, instead of praising him for taking teams coached by Jim Caldwell and John Fox to the big game. Brady, like Montana, has won just two MVPs. He was only a first-team All-Pro selection twice in his career, although he has a good excuse: he was competing with Manning nearly every year.
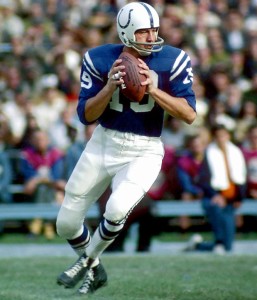
The best quarterback of his era not to win a title in the '60s

The best quarterback of his era not to win a title in the '60s.

Unitas, as great as he was, doesn’t compare favorably to Manning, because nobody compares favorably to Manning. Technically, Unitas won three titles, but he left Super Bowl V with an injury while the Colts were trailing, and Earl Morrall was the quarterback who led Baltimore’s come-from-behind victory. If that ever happened to Manning, there would be riots in the streets before Manning was credited with that win.

As good as Unitas was, nearly every factor points in Manning’s favor. We already know that Manning’s numbers — after adjusting for era — dwarf those of every other quarterback. But other factors tell a similar story. Unitas was a 10-time Pro Bowler and 5-time Associated Press 1st-team All-Pro; those are great accomplishments, but most of those accolades came when the NFL had between ten and sixteen teams, and several franchises employed a quarterback-by-committee approach during that era. Standing out as an elite quarterback was easier back then, but no matter: Manning still has Unitas beat, with 13 Pro Bowls and seven AP first-team All-Pros.

Unitas did not have the sustained success of Manning (he had a pair of down seasons in the middle of his career) nor did his career reach the highest peaks that Manning did in ’04 or ’13. Unitas did not win a single championship in the sixties, and in that era, he was the Manning to Starr’s Brady. Unitas won two titles early and then suffered a long postseason drought. Unitas was a three-time MVP, but that still puts him behind Manning.

Quarterback debates can be silly. We don’t wonder why Barry Sanders never won a Super Bowl. The  legacy of Jim Brown wasn’t tarnished even though he didn’t win a playoff game until his second-to-last season. Manning is the greatest quarterback in NFL history. That’s his legacy. He’s earned that label after reaching unparalleled levels of success, by producing at a level well above average, game after game, month after month, season after season. It’s a bit odd that Manning’s teams haven’t had more success in the playoffs, but that’s all it is. Ted Williams never won a World Series, but it doesn’t make him any less of a ballplayer. Even Boston fans can agree with that.

We are told that quarterbacks are different, and that a quarterback is responsible for his team’s success. But constant repetition does not make it so. We’re smart enough to know this; I know we are. We don’t think Russell Wilson is a better quarterback than Manning just because the Seahawks beat the Broncos. But Super Bowl XLVIII just showed that a great team can beat a great quarterback. A great effort by an in all three phases of the game is usually what it takes to beat Manning. Perhaps that is his true legacy, as no quarterback has ever been tougher to beat.

References

References
1 This excludes three meaningless end-of-year games where Manning was the nominal starter before sitting on the bench for the rest of the game, and the Colts were underdogs for precisely that reason. That never happened in 2005 or 2006, but in 2007, against the undefeated Patriots, the Colts were 5-point underdogs and lost 24-20. In 2008, the Colts were 4-point road dogs to the undefeated Titans, and lost 31-21. We skip 2009, and then in 2010, the Colts lost as road dogs to the Eagles and Patriots. In 2012, as post-surgery Manning was working back into GOAT Manning, Denver lose to Atlanta, Houston, and New England in the first five weeks as underdogs. And since someone will ask, Brady has lost as an underdog ten times over that span, excluding the week 17 game against Houston in 2009.
{ 98 comments }

Super Bowl XLVIII Recap

A fitting end to a dream season

A fitting end to a dream season.

It almost seems silly to spend much time recapping one of the most lopsided Super Bowls ever. But we have six months until we get to watch another NFL game, so I think we can spend one more day recapping the 2013 season. One housekeeping note: Football Perspective isn’t going anywhere. Just like last year, we’ll be publishing a post every day of the offseason. So be sure to check back daily! Freelance articles are also welcome, so just send me an e-mail if you’d be interested in contributing to the site.

There were some great recaps published in the immediate hours after the Super Bowl, including summaries from Bill Barnwell and Mike Tanier, a Super Bowl edition of Audibles at the Line from Football Outsiders, Ben Stockwell’s Refocused recap at Pro Football Focus, an analytic take from Advanced NFL Stats, the gut-punching summaries from Douglas Lee  and T.J. Johnson at It’s All Over, Fat Man!, and the elated Danny Kelly and Jacson Bevens from FieldGulls.

So with 24 hours to sleep on things, here are my thoughts on how any why Seattle produced a Super Bowl blowout.

The Seattle Defense vs. The Denver Offense

I wrote a lot about Super Bowl XLVIII, but by far the most anticipated subplot was seeing Peyton Manning against Richard Sherman and the Seattle pass defense. In my Super Bowl preview, I encouraged readers to watch the YAC: No quarterback gained more yards on yards after the catch in the regular season than Manning. On a per-catch basis, Denver receivers averaged 5.75 yards after the catch according to NFLGSIS, but Seattle led the league in YAC/Catch allowed at 4.1.  The Seahawks press coverage and sure tackling seemed like a bad matchup for Denver, and it was: according to Pro Football Focus, Denver receivers gained just 3.7 yards after the catch per reception in the Super Bowl.

That’s just part of the biggest story, of course, which is how one of the greatest pass defenses in NFL history — and one of the greatest defenses in NFL history — played like it on the biggest stage. Cliff Avril (5 hurries, 2 hits according to PFF) was remarkable in the first half, dominating the Broncos offensive line and forcing both Manning interceptions. Kam Chancellor and Malcolm Smith were the recipients of both Manning picks, and both had strong all-around games, too. Richard Sherman was quiet, but Manning and the Broncos largely avoided him, which means his impact was felt. [continue reading…]

{ 5 comments }

The Best Scoring Defenses In NFL History

Head of the LOB

Head of the LOB.

Congratulations to the Seattle Seahawks and their fans on winning Super Bowl XLVIII. With the win, Seattle has confirmed its status as one of the greatest defenses in NFL history. The Seahawks defense produced a game for the ages on Sunday: facing Peyton Manning, Demaryius Thomas, and one of the greatest offenses ever, Seattle’s defense outscored Denver’s offense, 9-8. Led by Malcolm Smith, Cliff Avril, Kam Chancellor, Earl Thomas and Richard Sherman, the Seahawks stamped their claim with the ’85 Bears, ’00 Ravens, and ’02 Bucs as one of the greatest defenses of the last 30 years.

But today, I want to look at which defenses were the best in regular season history, and see where Seattle stacks up. Bill Barnwell had an interesting post during Super Bowl week. He used the statistical measurement known as the Z-Score to show that Seattle was the tenth best defensive scoring team in NFL history. Don’t be too confused by the idea of a Z-score: in English, this just means that Seattle’s defense — and yes, I am going to conflate the concepts of defense and points allowed throughout this post — was 2.2 standard deviations above average in points allowed, one of just ten teams to ever produce such a result.

So how do we get there? Well, Seattle allowed 14.4 points per game during the regular season. The league average was 23.4 points, which means that Seattle’s defense was 9.0 PPG better than average. The standard deviation of points per game among the 32 NFL defenses in 2013 was 4.08 points per game; therefore, Seattle has a Z-score of 2.20, because the Seahawks allowed points at a rate that was 2.20 standard deviations better than the mean.

Today, I wanted to do the same analysis but adjust for strength of schedule, by deriving offensive and defensive SRS grades. Of course, Pro-Football-Reference has published offensive and defensive SRS grades for awhile, but I decided to crunch the numbers on my own and see if they matched up with what Neil and Mike did (they did). For the uninitiated, SRS stands for Simple Rating System, which is simple to understand but a bit complicated to derive. The SRS is simply margin of victory (or, in the case of offenses and defenses, margin of production above league average) adjusted for strength of schedule. The key is using an iterative process, where, in Excel, we adjust the ratings hundreds of times; after all, to adjust for SOS, you have to adjust for the SOS of each opponent, and the SOS of each opponent’s opponent, and so on.

The table below shows the top 200 scoring defenses since 1932. Here’s how to read the 2002 Bucs line. That season, Tampa Bay allowed 9.4 points per game less than league average. The average defense the Bucs faced — using the iterative method to derive SOS grades — was 0.4 points above average. Therefore, Tampa Bay is credited with an adjusted rating of 9.8 PPG better average. The standard deviation of defensive ratings in the NFL in 2002 was 3.45, giving the Buccaneers a Z-score of 2.83, the highest ever. The table below is fully sortable and searchable, and shows the top 200 defenses. [continue reading…]

{ 35 comments }

Why is the Over/Under So Low In Super Bowl XLVIII?

The Over/Under for Super Bowl XLVIII was just 48 points for most of the last week, although it went up to 48.5 on Thursday and may be at 49 by kickoff. In any event, such a low number should strike Broncos fans as really odd, since the average over/under in the team’s first 18 games was 53.4 points. And the “Over” has hit in 10 of those games!

Seattle, meanwhile, has had an average over/under of 42.8 points. As it turns out, the “Under” has hit in 12 of Seattle’s 18 games this season, including each of the last seven. Readers who are good at arithmetic might have already noticed that the average of 53.4 and 42.8 is 48.1 points.

The graph below shows the Over/Under in each game this season for Denver and Seattle:

[visualizer id=”17753″]
[continue reading…]

{ 1 comment }

2014 Hall of Fame Candidates

Tonight, the newest members of the Class of 2014 will be announced. Here are the 15 finalists:

Rushing Receiving
Rk Name Pos From To AP1 PB St CarAV G Att Yds TD Lng Rec Yds TD Lng
1 Derrick Brooks LB 1995 2008 5 11 14 140 224
2 Marvin Harrison WR 1996 2008 3 8 12 124 190 10 28 0 15 1102 14580 128 80
3 Michael Strahan DE 1993 2007 4 7 14 121 216
4 Will Shields G 1993 2006 2 12 14 113 224 1 4 0 4
5 Aeneas Williams DB 1991 2004 3 8 13 106 211
6 Tim Brown WR 1988 2004 0 9 13 104 255 50 190 1 19 1094 14934 100 80
7 Andre Reed WR 1985 2000 0 7 14 98 234 75 500 1 46 951 13198 87 83
8 Walter Jones T 1997 2008 4 9 12 96 180
9 Kevin Greene LB 1985 1999 2 5 11 94 228
10 John Lynch DB 1993 2007 2 9 13 88 224 1 40 0 40
11 Charles Haley DE 1986 1999 2 5 8 84 169
12 Jerome Bettis RB 1993 2005 2 6 12 79 192 3479 13662 91 71 200 1449 3 34
13 Morten Andersen K 1982 2007 3 7 24 51 382
14 Edward Debartolo, Jr. Owner
15 Tony Dungy coach

[continue reading…]

{ 25 comments }