≡ Menu

Third Down Performance: How Much Is A 3rd Down Worth?

From 2002 to 2021, NFL teams converted 38.9% of all third down attempts. Third down performance is really meaningful when it comes to winning games, but it can also be pretty random from sample to sample. So as a result, third down performance has an outsized performance on who wins and loses that game, but is probably not all that predictable as to who will win the next game.

I thought it would be interesting to look at this in the context of the pre-game point spread. Let’s start with a few basic numbers, looking at this 20-year period.

  • Teams that were favored by 1 to 5.5 points won 58.7% of their games.
  • Teams that were favored by 6 to 8 points won 73.6% of their games.
  • Teams that were favored by more than 8 points won 83.4% of their games.

But let’s say you know that the favorite would lose the third down battle. How does that change things?

  • Teams that were favored by 1 to 5.5 points but were worse on third downs won only 43.4% of their games.
  • Teams that were favored by 6 to 8 points but were worse on third downs won only 54.2% of their games.
  • Teams that were favored by more than 8 points but were worse on third downs won 68.2% of their games.

Now, saying an underdog just needs to win the third down battle is not very helpful, and only a little more precise (and about as useless) as saying they just need to score more points. But it does help to provide some guardrails about the magnitude of third down performance. It can flip a big favorite into a coin flip, and a huge favorite suddenly has a real chance of losing.

Can we quantify exactly how important third down success is? I’m glad you asked. As we know, each team has a 38.9% chance of converting an average third down. Suppose each team has 15 third down attempts in the game. Let’s say one team coverts 10 of 15, while the other only converts five opportunities. The expected number of third down conversions for both teams is 5.8 (0.389 multiplied by 15), so one team converted 4.2 more first downs than expected, while the other converted 0.8 fewer than expected. The net difference, of course, is five conversions — let’s call that the net third downs added. [continue reading…]

{ 3 comments }

Ten years ago, I looked at the passing distribution of NFL teams since 1970. Let’s revisit that post today, with an expanded look at what’s happened over the last decade.

I examined every season in the NFL since 1970, when the AFL and NFL merged. [1]It is not lost on me that NFL history is not linear, and in many ways, the 1960s is more similar to the 1980s than the 1970s. That said, out of laziness, I only went back to 1970. I then calculated the percentage of receiving yards for each team that went to its running backs, tight ends and wide receivers. The graph below shows the breakdown from each season from 1970 through 2021. [2]Some caveats: Obviously many players straddle the line across multiple positions. There are some judgment calls involved with H-Backs, tight ends turned wide receivers, running backs turned tight … Continue reading. There are two large trends: wide receivers have become slightly more important over time, jumping from 53% of the receiving pie during the ’70s to 63% over the last ten years. The entire jump, though, came in the aftermath of the 1978 rules changes, as the percentage of receiving yards that went to wide receivers steadily rose form 53% in 1977 to 62% in 1987 and 1988.

The other notable change is the switch in primacy of the tight end relative to the running back. From 1970 to 1983, running backs gained 27% of all receiving yards while tight ends picked up just 19% of the pie. That breakdown was pretty consistent each season: tight ends were at 18%, 19%, or 20% almost every season, and running backs consistently gained between 25% and 29& of the receiving game. The 1984 season was a weird outlier: running back production was way down while tight end production was up, but that was mostly a one year blip. From 1985 to 1994, running backs averaged 22% of the pie, a noticeable decrease from the pre-1984 era, but tight ends dropped, too, down to 15% during that decade. And from 1986 through 2007, tight ends were under 20% of the receiving pie each year. But tight ends have held steady at 20 or 21 percent, while running back production in the receiving game has dropped to about 16%. In 2004, tight ends gained more receiving yards as a group than running backs, and it has remained that way in every season since. This is strongly tied, of course, to the near-elimination of the fullback position from the modern game. [continue reading…]

References

References
1 It is not lost on me that NFL history is not linear, and in many ways, the 1960s is more similar to the 1980s than the 1970s. That said, out of laziness, I only went back to 1970.
2 Some caveats: Obviously many players straddle the line across multiple positions. There are some judgment calls involved with H-Backs, tight ends turned wide receivers, running backs turned tight ends, etc. I did my best to make the appropriate call in each case. Note also that for this article, I’ve eliminated all players who ended the season with negative receiving yards, and am only looking at receiving yards by running backs (which includes fullbacks), receivers and tight ends.
{ 0 comments }

The Bengals had to choose between Chase and a left tackle.

The debate was intense this spring.  The Cincinnati Bengals desperately needed to help young quarterback Joe Burrow, and there were likely going to be two outstanding offensive prospects available for Cincinnati.  But those players would help the offense in drastically different ways.

One option was to draft Burrow’s former teammate, LSU WR Ja’Marr Chase. The other was to draft Oregon OT Penei Sewell, which would help the offense in a very different way.  Many chimed in on the debate, and the most interesting part of the analysis was the value placed on each position.  Few debated whether Chase or Sewell were elite prospects; both were blue chip players at their position in college, and little of the argument centered on how they compared to others at the same position.  Rather, the question could be boiled down to this: was adding a great WR prospect better or worse than adding a great OT prospect?

On a pass play, the wide receivers are attackers and the offensive linemen are mitigators. Grouping players into attackers and mitigators can be a helpful way to analyze what each position brings to the game.  An elite attacker is always valuable, although his value might be limited if he’s lined up against a great mitigator.  But a mitigator is only as valuable as the person he’s trying to mitigate and the other mitigators on his team. This is easiest to think about when it comes to cornerbacks.  Nnamdi Asomugha was a shutdown, Hall of Fame level cornerback for three years in Oakland at a time when the Raiders pass defense was below average. Asomugha was targeted to an absurdly low degree, and while teams were forced to throw away from him, that didn’t matter much because the other mitigators were below average. [continue reading…]

{ 0 comments }

Los Angeles Makes Another Blockbuster Jared Goff Trade

It was just under 5 years ago that the Rams made a blockbuster trade to acquire the number one overall pick to select Jared Goff. As a reminder, in April 2016, the Rams traded:

the 15th overall selection (WR Corey Coleman), the 43rd [1]Which had been acquired when the Rams traded Sam Bradford to the Eagles. pick (Austin Johnson), the 45th selection (Derrick Henry), and a third round pick (#76, Shon Coleman), plus next year’s first round pick (which turned into the 5th overall pick and Corey Davis) and third round picks (#100, Jonnu Smith)

to Tennessee for

the first overall pick (Goff), and two later round picks in the 2016 Draft (#113-Nick Kwiatkoski, #177-Temarrick Hemingway)

At the time, the Rams probably didn’t think they would be sending the 5th overall pick in 2017, but that’s one of the risks of trading away a future first round pick.  And how did it work out for Los Angeles?  It’s tough to say.  Goff certainly didn’t live up to expectations: the Rams are explicitly telling the world that Goff is not good enough by trading him and a lot of draft capital to Detroit for Matthew Stafford.  On the other hand, not only did Goff have a lot of success with the Rams, but there is some irony in what wound up happening.  The concern in sending a lot of draft capital to move up to draft a quarterback is that you wind up in Jetsland, where New York sent a ton of capital for Sam Darnold and then never could build a team around him.  The Rams didn’t get the franchise quarterback they wanted, but wound up building a great team around Goff despite the lack of draft capital.  One could argue that Los Angeles is one of the top-5 talented teams in the NFL, if you remove the quarterback from the equation.

And that is the gamble Los Angeles is making this weekend.  The Rams just sent Goff, along with the team’s first round picks in both 2022 and 2023 and the 88th pick in the 2021 Draft to Detroit for Matthew Stafford.  And it’s very interesting what the trade says about not just how the Rams, but the entire NFL, view Goff.

Valuing future picks is always challenging because we have to include the time value discount associated with those picks plus the uncertainty of knowing exactly where they will fall in the draft. [2]The Texans have twice traded away top-5 draft picks in recent years without knowing it.  This trade is particularly difficult to analyze because it’s initially unclear whether Goff is an asset (a talented, former number one overall quarterback in his prime) or a liability (a quarterback viewed as significantly overpaid with a contract that is going to cost Detroit $54M in cap dollars over the next two years, unless they cut him, in which case he would cost $44M over the next two years).

What do the Lions want to do? If they are looking to tear down the roster and rebuild, Goff may not have a lot of value — and they could look to trade him or cut him in the next 12 months.  That would mean he is viewed as a liability, and the Rams actually paid less than they would have for Stafford if they didn’t make Detroit take Goff.  On the other hand, are we to assume that no team would have traded for Goff with his existing contract?  If even one team (the Colts? Steelers?) would have offered the Rams something, then there would have been no reason to bundle him in this deal.  But perhaps his contract really was an albatross: we will only find out once we see what the Lions do with him.  As it turns out, we can get a pretty good sense of whether Goff is an asset or a liability by analyzing the rest of the trade.  More on that in a moment.

For Detroit, this closes the book on the Stafford chapter.  Did he disappoint in Detroit?  I think the better summary is that he was a very good player saddled on a bad franchise. There are only four quarterbacks to start 130+ games with one team despite having a losing record: Stafford, Joe Ferguson, Jim Hart, and John Brodie.  Here is every quarterback-team relationship with 130+ starts, with their collective winning percentage on the X-Axis and their number of starts on the Y-Axis.  I have put Stafford, Ferguson Hart, and Brodie in team colors; yes, Stafford has the worst winning percentage of the group. [3]And yes, this cut-off was intentional, and historians should have been able to guess that Archie Manning started 129 games for the Saints.

So how much is Los Angeles giving up to get Stafford?  Some NFL teams put a full round discount on future picks, which would make a 2022 1st round pick equal to a 2021 2nd round pick, and a 2023 1st round pick equal to a 2021 3rd round pick.   That is more justifiable when, like with the Rams, the expectation at least is that those first round picks will not be top-10 picks.  If we use the Jimmy Johnson calculator, and treat the ’22 1st as equivalent to the 45th pick and the ’23rd 1st like the 75th pick, that implies L.A. sent value equal to the 20th or 21st pick in this year’s draft.  But that is probably the wrong way to analyze the situation: it assumes too significant a discount, as we would expect Stafford to be worth more than that (for example, Indianapolis has a quarterback need and the 21st overall pick in this year’s draft, and that presumably would not have been enough to get Stafford).

So if that discount is too high, how do we determine the right discount?  Let’s start by saying the average first round pick is worth 18.4 points on my chart, equivalent to the 13th overall selection (because the dropoff in value is logarithmic). On the JJ Chart, the average first round pick is about the same, falling in between the 12th and 13th overall picks.

If we use a 10% discount rate, that would make a 2022 1st round pick equal to the 17th pick on my chart and the 15th on the JJ Chart. Use a 20% discount rate, and a 2022 1st round pick is equal to the 23rd pick on my chart and the 17th on the JJ chart; a larger discount rate than that is hard to justify. For a 2023 1st round pick, using a 10% discount rate, we get the 22nd pick or the 17th pick on the FP and JJ charts, and equivalent to the 36th pick and the 24th pick in 2021 using a 20% discount rate.

Here, the Rams are getting Stafford, a relatively known commodity. [4]It’s important to keep in mind that often teams trade future firsts with a specific rookie player in mind; when Atlanta traded a future first round pick for the 6th pick in the draft it … Continue reading Does that argue for a higher discount rate? Perhaps so. So let’s say we use the 20% number. How do we value the 88th pick in this year’s draft plus the two first rounders the next two years? [5]Of course, the Rams are without a first round pick in 2021 due to the Jalen Ramsey trade. If we consider the 2022 and 2023 first round picks to be average in value, and then apply a 20% discount, those picks combined with the 88th overall selection are equivalent to the 32.6 points on the Football Perspective Draft Value Chart and 1817 points on the traditional, JJ Chart. That’s equal to between the 1st and 2nd picks on my chart, or the 4th pick on the traditional chart.

And that is… a lot. I feel pretty confident in saying that such a collection of picks is worth more than Stafford alone. The Jets and Dolphins are the 2nd and 3rd picks, and I don’t see any reason to think either team would trade that pick for Stafford. Miami in particular might be a great landing spot for a player like Stafford, but there was no indication that the Dolphins were willing to offer up the 3rd overall pick for Stafford.

Which means the Rams — and the NFL — must view Goff as a liability. Stafford alone isn’t worth the 3rd pick in the draft, but Stafford is worth the 3rd pick along with Goff’s contract.

References

References
1 Which had been acquired when the Rams traded Sam Bradford to the Eagles.
2 The Texans have twice traded away top-5 draft picks in recent years without knowing it.
3 And yes, this cut-off was intentional, and historians should have been able to guess that Archie Manning started 129 games for the Saints.
4 It’s important to keep in mind that often teams trade future firsts with a specific rookie player in mind; when Atlanta traded a future first round pick for the 6th pick in the draft it wasn’t for the generic 6th pick; it was for Julio Jones, a player they certainly had a very high grade on. That sort of certainty and opportunity (after all, the 6th pick if used on Jones might be worth the 1st overall pick to Atlanta if he was the top player on their board) would make teams more comfortably trading more, which would imply a higher discount rate on future picks.
5 Of course, the Rams are without a first round pick in 2021 due to the Jalen Ramsey trade.
{ 0 comments }

NFL Playoff Seedings – A Monte Carlo Simulation

Let’s look at each round of the NFL playoffs,

Wild Card Round

There are two games played here in each conference: the 6 seed travels to on the road to face the 3 seed, and the 5 seed visits the 4 seed. The 1 and 2 seeds have byes.

My assumptions throughout this post are (1) home field advantage matters, and (2) the stronger seed is the better team, with the exception of 4 vs. 5. With 4-team divisions, the best team to not win its division — that is, often, the 2nd best team in the division with a very good division winner — is more often than not a better team than the worst division winner.

Still, home field advantage matters. So I am assuming that the 3 seed has a 60% chance of winning its game, while the 4 seed has a 55% chance of winning its game (this is lower than the general rule that the home team wins about 57% of games).

This means, after the wild card round, there’s a 100% chance that the 1 seed remains, a 100% chance that the 2 seed remains, a 60% chance that the 3 seed remains, a 55% chance that the 4 seed remains, a 45% chance that the 5 seed remains, and a 40% chance that the 6 seed remains. If you want to change these percentages, that’s very easy; more on that at the end of this post.

Division Round

Who will the 1 and 2 seeds face in the Division Round? The 1 seed has a 33% chance of facing the 4 seed, a 27% chance of facing the 5 seed, and a 40% chance of facing the 6 seed. This is because the 1 seed always plays the 6 seed when the 6 seed wins in the Wild Card round (40% chance), and faces the 4/5 winner 60% of the time. The 2 seed has a 60% chance of facing the 3 seed (when the 3 seed beats the 6 seed), a 22% chance of facing the 4 seed, and an 18% chance of facing the 5 seed.

So what will happen in the Division round?  Again, we need to come up with some probability; I took a stab at that below.  If you don’t like them, you can change them letter!

These seem reasonable to me; maybe you want to give the home team a bigger edge, but they’re close enough (and simple!) for our purposes.  So how likely is each seed to make the conference championship game using these numbers?

The 1 seed can make it by beating the 6 seed (40% chance that game happens, 80% chance of winning, therefore a 32% chance the 1 seed makes the Conference Championship Game by beating the 6 seed), the 5 seed (27%, 70%, 19%) or the 4 seed (33%, 75%, 25%): therefore, the 1 seed has a 76% chance of getting to host the title game.

The 2 seed can make it by beating the 5 seed (18% chance, 65% conditional win probability, 12% chance the 2 seed makes it by beating the 5 seed), the 4 seed (22%, 70%, 15%), or the 3 seed (60%, 60%, 36%), for a 63% chance.

You can do this calculation for all the seeds.  The 6 seed, for example, only has an 8% chance (40% chance in the Wild Card round, 20% chance in the Divisional Round) of getting to the CCG.  The 3 seed has a 24% chance, while the 4 and 5 seeds each have around a 14-15% chance.

In fact, the 5 seed has a slightly better chance of making it to the CCG than the 4 seed, because of the assumption that it is the better team.  This is offset, of course, by being on the road in the Wild Card round.

Conference Championship Game

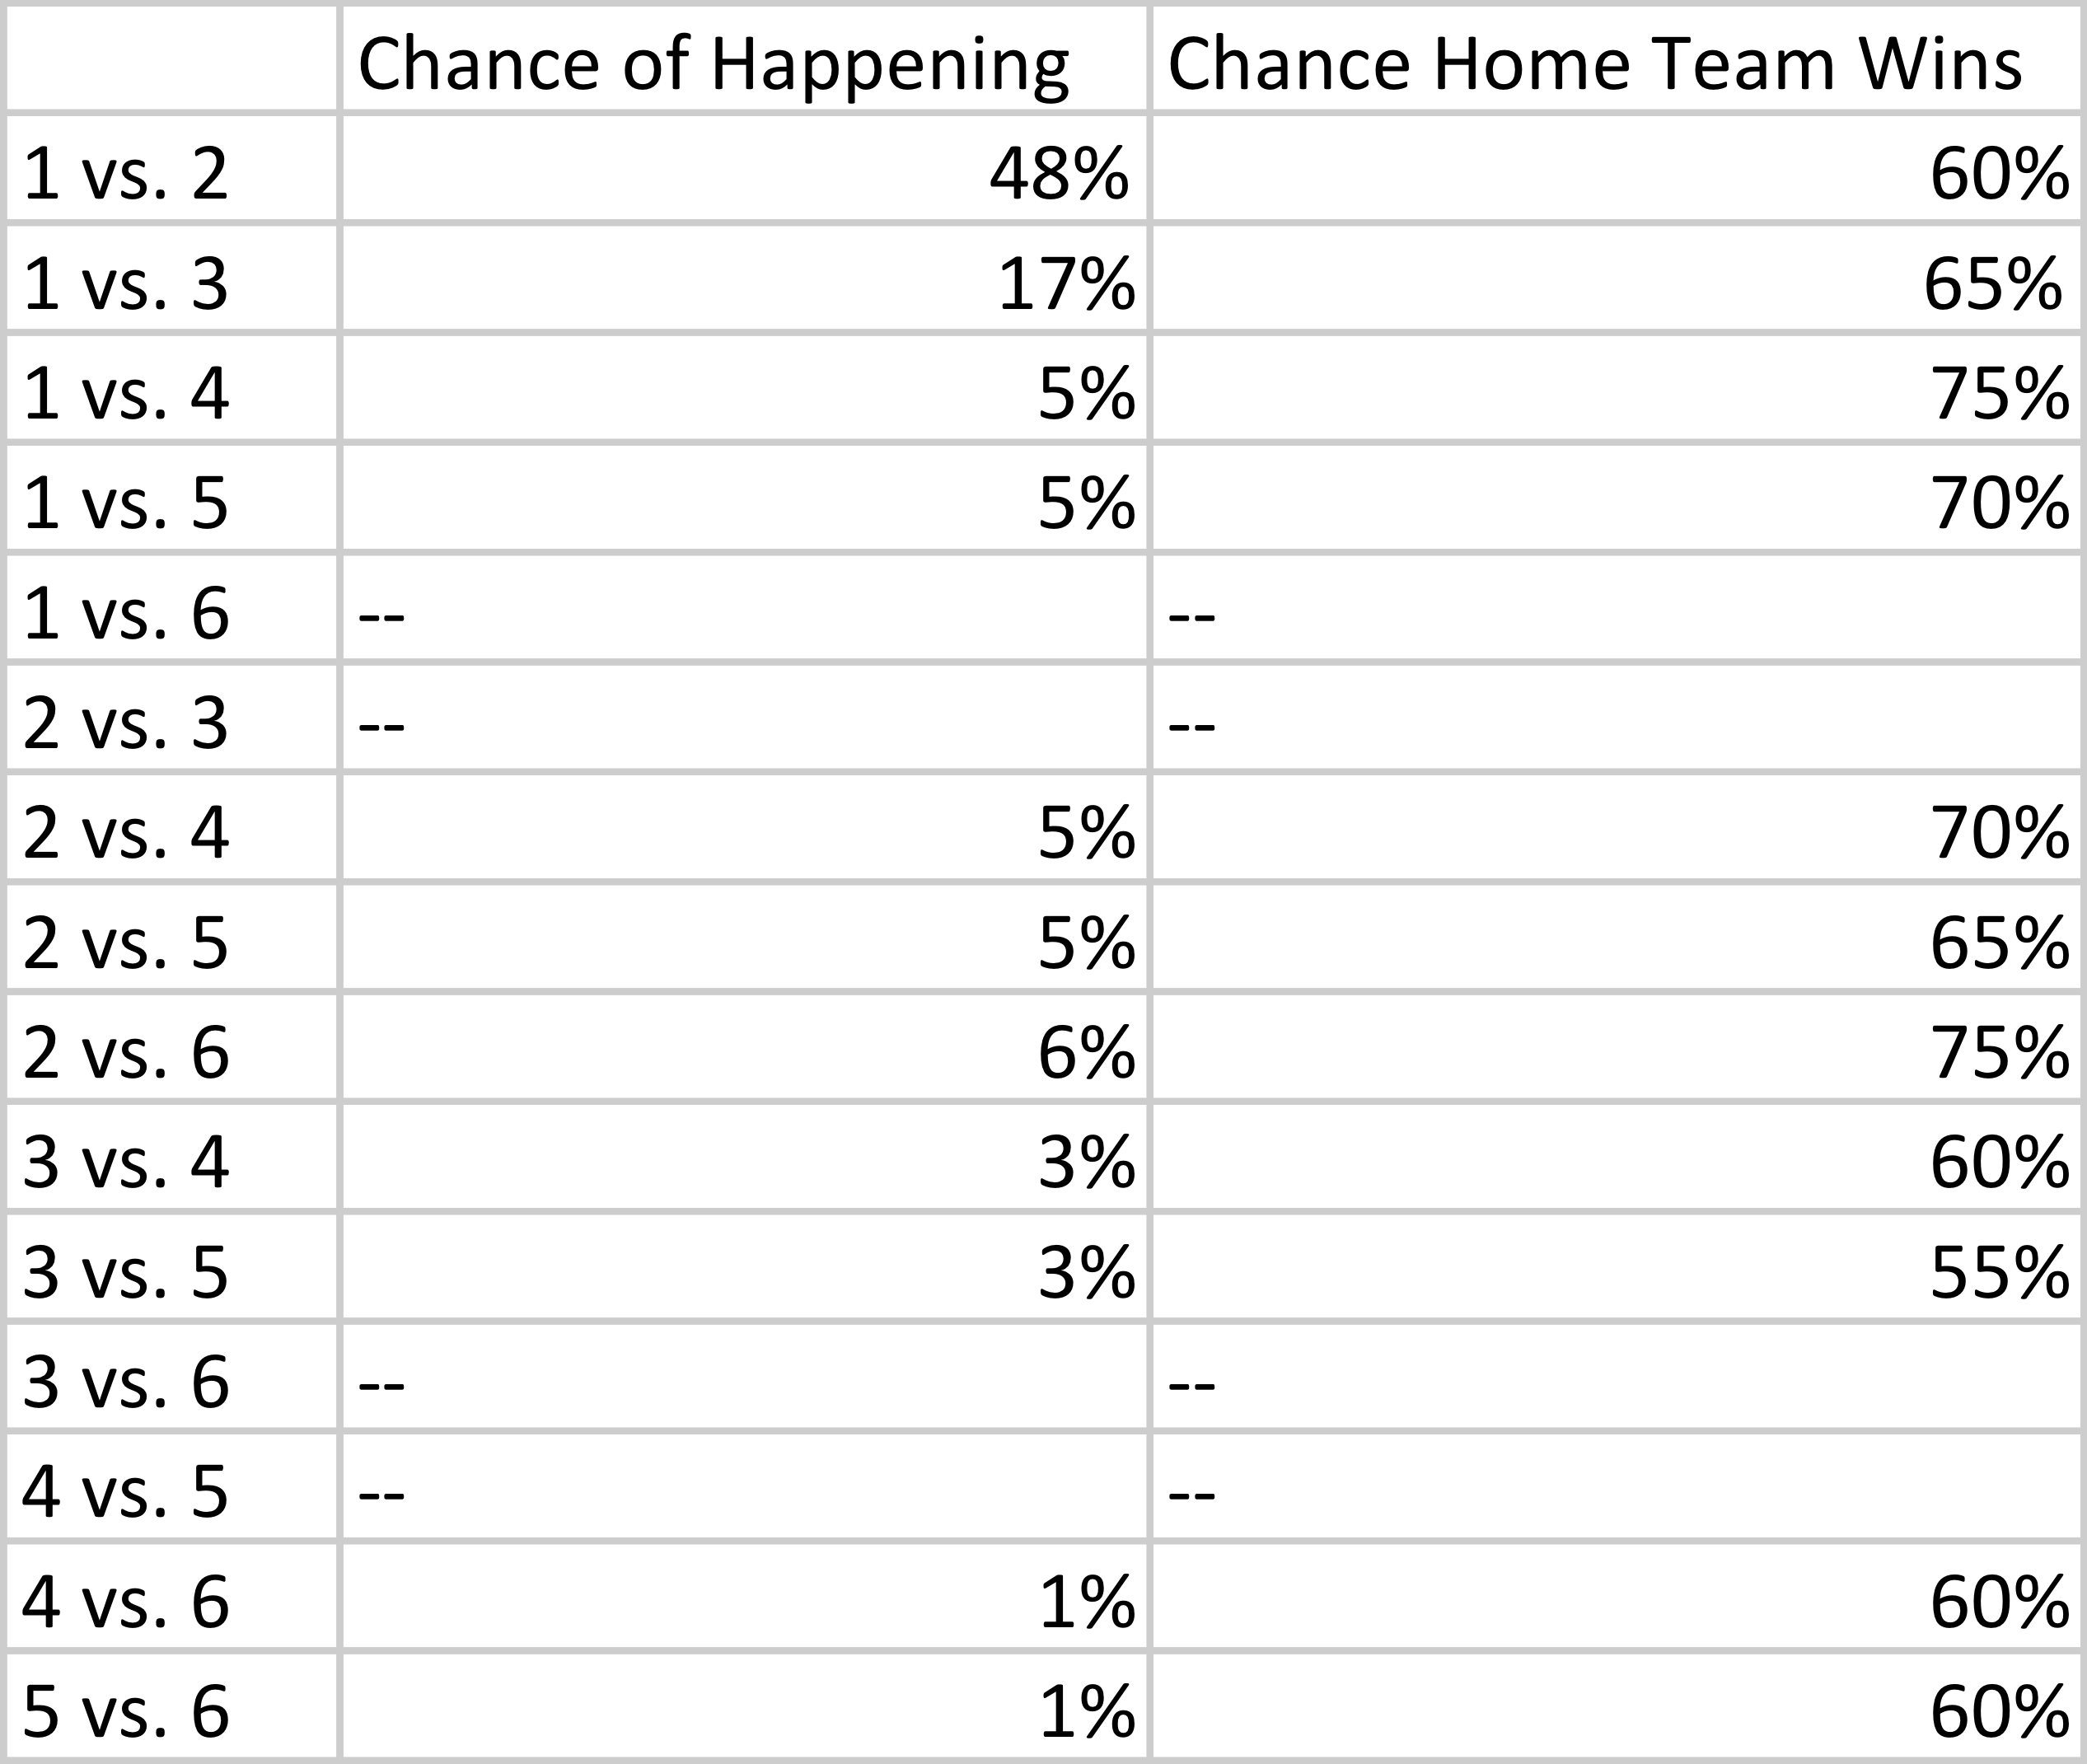
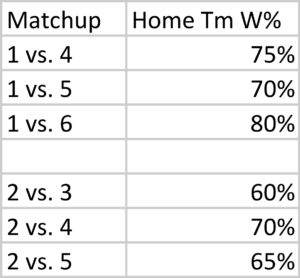
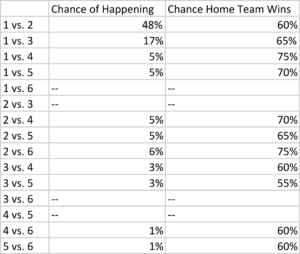
With 6 teams in the playoff field, there are 30 possible combinations (6 x 5) for the conference champinoship game.  Of course, only half of those truly exist because home field automatically goes to the better seed.  And 4 of those 15 combinations are impossible — 1 can’t play 6 and 2 can’t play 3, since it would automatically play in the Division Round, while 3/6 and 4/5 can’t meat in the CCG since they meet in the Wild Card round.  The table below shows the chance of each combination happening, along with my projection of the likelihood that the home team wins.

Again, if you disagree with any of these results, you will be able to change them! Just keep reading.

Conference Champion

If you perform all of the calculations using the assumptions in this post, you’ll see that there’s a roughly 48% chance the 1 seed wins the conference, a ~30% chance the 2 seed makes it to the Super Bowl, and the percentages drop to ~10%, 4-5%, 5-6%, and 2-3% for the 3, 4, 5, and 6 seeds.

Monte Carlo Simulation

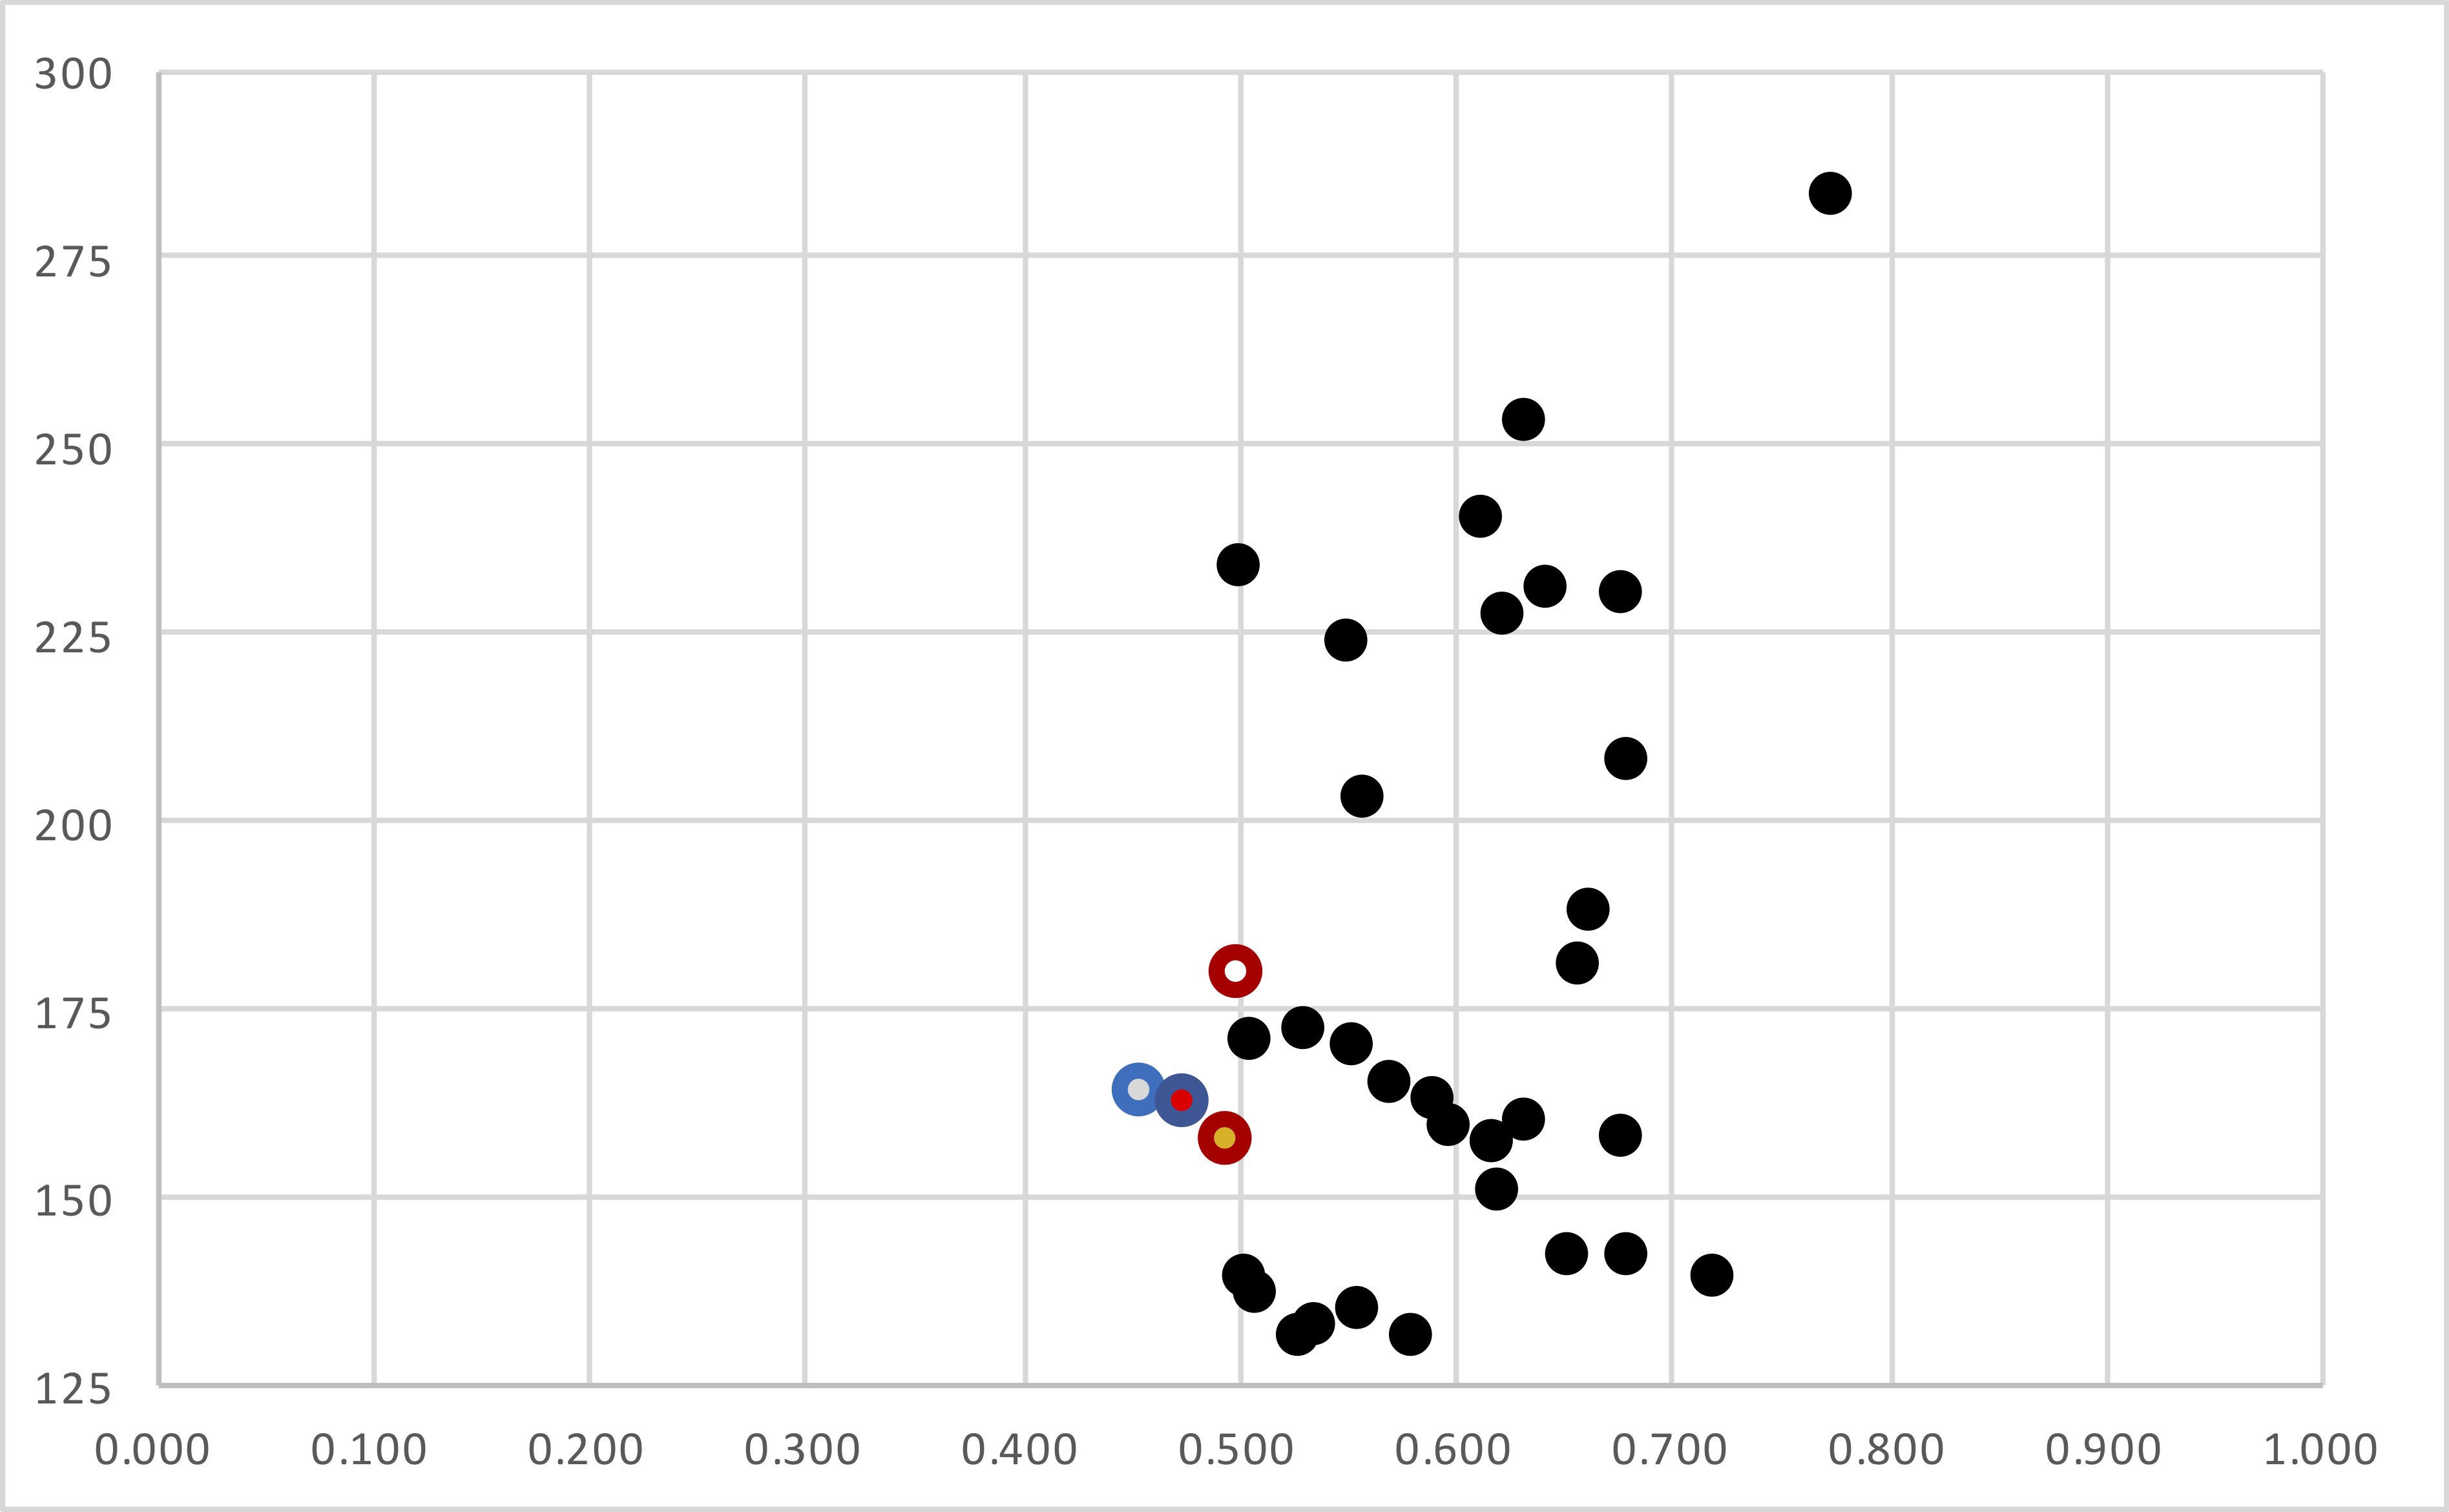
One way to re-create the above is by performing a Monte Carlo simulationYou can download the Excel file that I created here. This file simulates 32,000 NFL postseasons with random results, weighted based on the percentage chance the home team has of winning each game.

Here’s how to read/use this sheet. On the Wild Card sheet, the pre-game win probabilities are in cells V11 and V12, which are highlighted in yellow. Let’s say you think the 5 seed in a given season is really good and/or the 4 seed is really weak; in that case, let’s change the home team win probability from 55% to 40%. Well, this still only shifts the Conference Championship odds (in Column S on the “ccg” sheet) a little bit; the 5 seed jumps from just over 5% to just over 7%, while the 4 seed drops to about 3.5%.

Let’s go to the “div” sheet. Let’s say you think the 1 seed is really strong, and should have a 90% chance of winning no matter its opponent in the Division Round. Even still, this only jumps its odds of winning the conference to about 57%.

What do you think?

{ 0 comments }

The 2014 season marked a new era of passing efficiency. And since the 2014 season, the passing game has remained extremely efficient. However, there were a lot of quarterback injuries in 2019: we spent most or all of the season without Andrew Luck, Ben Roethlisberger, Cam Newton, and Alex Smith; as a result, pass efficiency, as measured by Adjusted Net Yards per Attempt, was slightly down in 2018 compared to 2019.

The graph below shows each team’s ANY/A in 2018 (X-Axis) and 2019 (Y-Axis).

[continue reading…]

{ 2 comments }

How much did passing efficiency decline in 2019 compared to a record-setting 2018? That depends, a bit, on how you measure passing efficiency — in more ways than one.

In 2018, all NFL passers combined to average 6.32 Adjusted Net Yards per Attempt. In 2019, all NFL passers combined to average 6.16 ANY/A, a decline of 2.6%. However, there is another way to measure league average, and that’s by taking an average of the average ANY/A stats for each of the 32 teams.

In 2019, while “the NFL” as a whole had a 6.16 ANY/A average, an average of each of the ANY/A rates for the 32 teams comes to 6.19. If that is confusing to you, think of it this way: when we calculate “the league average” in passing stats, we are giving more weight to the Bucs, Panthers, and Falcons than to the Ravens, Titans, and Vikings. Collectively, those three NFC South teams were responsible for 11.0% of all passing plays in 2019; meanwhile, pass plays from Baltimore, Tennessee, and Minnesota account for only 7.7% of NFL passing plays.

When we think of league average, we almost always mean a weighted average that gives more weight to the teams that pass most frequently. But there’s at least an argument to be made that league average would be better defined by taking an average of the averages. And in this case, in 2019, it would mean a higher average: that’s because the wrong passers threw it more often in 2019.

Last year, the right passers threw it more often: an average of the ANY/A produced by each of the 32 teams was 6.29 (which was lower than the normal average of 6.32, since the weaker passing teams threw less frequently last year). By this measure, passing efficiency declined only 1.6% — from 6.29 to 6.19 — from 2018 to 2019, rather than by 2.6%.

Let’s look at each team in 2019. The X-Axis shows the number of dropbacks: the NFC South teams (other than the Saints) are on the far right, because they passed the most. The Y-Axis shows pass efficiency, as measured by ANY/A.

It’s pretty clear that the “wrong teams” passed most often in 2019; the chart has a slope that is down and to the right. This, of course, is why the “NFL ANY/A” was 6.16 but the “average of the ANY/A for the 32 teams” was 6.19; by giving the Ravens and Titans equal weight to the Bucs and Panthers, you raise the average.

You might think this is how things always are: after all, the whole point behind my Game Scripts work is that teams with the lead pass less often, and trailing teams pass more often. But of course we already discussed that last year, the reverse was true: the right teams passed more often. In fact, there isn’t much of a trend in recent years as to whether or not the better passing teams are more likely or less likely to pass more often.

This final graph is a little wonky, but here goes. It shows the league average ANY/A in each season calculated the normal way minus the average of the ANY/A for all of the teams. So in 2019, you get a negative number (6.16 – 6.19 is -0.03); in 2018, it’s positive. Any time the graph is above 0, it means that the right teams are passing more often. Any time it’s below zero — as in 2019 — it means the wrong teams are passing more often.

What do you think?

{ 0 comments }

Kyle Allen and Patrick Mahomes are at opposite ends of the quarterback spectrum. Allen was an undrafted free agent; Mahomes is one of the most talented quarterbacks in league history and was the 2018 NFL MVP.

Allen ranks 32nd out of 34 qualifying quarterbacks in the most basic (in a good way) of passing stats: net yards per attempt.

Mahomes ranks 1st this year in NY/A, after ranking 1st in the same stat last year among quarterbacks who started at least 8 games.  Net yards per attempt is a good stat, and Mahomes is excellent at it because he’s an excellent quarterback (or maybe vice versa).

But you know better than to expect this to be a “Mahomes good Allen bad” post. Because I did a triple take this morning when I noticed that Kyle Allen has thrown for first downs at a higher rate this season than Mahomes.  That seemed impossible, and I had to double check twice just to make sure the data wasn’t wrong.

In general, there is a significant correlation between Net Yards per Attempt (which is passing yards, net of sack yards lost, divided by pass attempts plus sacks) and Passing 1st Down Rate (which is passing first downs divided by pass attempts plus sacks).   Both of these are very good stats to measure quarterback play, and last year, Mahomes led the NFL with a 43.2% passing first down rate.   Passing 1st Down Percentage is a good quick and dirty stat, and one where the best quarterbacks tend to fare very well. It is certainly not biased against a player like Mahomes.  But this year, Mahomes ranks 13th in that metric despite still having a very good NY/A average, while Allen shockingly ranks 11th in the metric.

So we have two pretty good, and easy to calculate passing stats, that in general are very correlated.  How correlated? Take a look at the graph below, which shows the same data as the table above.  And while the logos are for teams, the data  is for individual quarterbacks, not team-level data. So the Jets logo is only Sam Darnold, not the full Jets passing stats in 2019. And for the Redskins, Titans, and Steelers, it’s Dwayne Haskins, Ryan Tannehill, and Mason Rudolph in the chart below.  The Panthers, and to a lesser extent, the Chiefs, stand out as a notable outlier: [continue reading…]

{ 33 comments }

When Does ANY/A Get It Wrong? By Adam Steele

Adam Steele is back for another guest post. You can view all of Adam’s posts here. As always, we thank him for contributing.


When Does ANY/A Get It Wrong?

In Chase’s review of week one passing stats, I commented that the league’s passing efficiency was inflated by ANY/A in comparison to expected points added (EPA). Today’s post takes a deeper dive into the discrepancy between ANY/A and EPA and which quarterbacks look better in each metric.

While ANY/A is a good metric for quick and dirty analysis, it ignores a number of important variables for accurately measuring a quarterback’s passing efficiency. These variables include: first downs, failed completions, air yard / YAC splits, dropped passes, fumbles, the context of interceptions, and garbage time adjustments. My metric of choice to solve these issues is ESPN’s model of expected points (the primary component of Total QBR). I prefer ESPN’s version in particular because it attempts to isolate the quarterback’s share of credit for every play; the EPA numbers found at Pro Football Reference and Advanced Football Analytics hold the quarterback fully responsible for his team’s pass plays, which, in my opinion, is not much better than just using ANY/A.

In order to compare EPA to ANY/A, I divided pass EPA by dropbacks then converted EPA/A into an index stat using the same formula for ANY/A+. For those not familiar, index stats are scaled so a score of 100 is average and 15 points represents one standard deviation above or below that average. EPA data goes back to 2006 which gives us 439 qualifying seasons to compare. As you would suspect, these two variables are closely correlated (R^2 of 0.74) in the aggregate, but there will be many individual outliers. In the graph below, the X-Axis shows the ANY/A+ for each quarterback, while the Y-Axis shows the EPA/Attempt+ for that quarterback. [continue reading…]

{ 0 comments }

Kliff Kingsbury Kicks, Kicks, And Kicks Again

Kliff Kingsbury, flirting with the apple of his eye

Week 2 of the 2019 NFL season. With 2 minutes left in the first quarter, trailing 7-0, Arizona faced a 3rd-and-1 from the Ravens 4-yard line. Kyler Murray threw an incomplete pass, setting up a 4th-and-1 from the same distance.

This is an obvious situation to go for it, particularly when you are a 13-point underdog. Only contortionists can concoct 4th-and-1 situations where going for it is a bad idea, and nobody can sustain that argument from the opponent’s 4-yard line in the first quarter. And yet, Cardinals head coach Kliff Kingsbury sent out Zane Gonzalez to kick a short field goal, cutting the lead to 7-3.

After the next Baltimore drive resulted in a field goal, Arizona again drove down the field. The Cardinals reached 3rd-and-goal from the 3-yard line, when Murray threw an incomplete pass. That set up 4th-and-goal from the 3, trailing 10-3 midway through the 2nd quarter. This was another obvious go-for-it situation, but once again, Kingsbury sent Gonzalez out to get three points. Over the last 10 years, NFL offenses have scored touchdowns on about 41% of 3rd (or 4th) and goal plays from the 3-yard line. And as we’ll see in a minute, a 41% success rate is far above the necessary rate to make going for it the correct decision.

On Arizona’s first drive of the second half, trailing 17-6, Arizona once again drove inside Baltimore’s 10-yard line. On 2nd-and-goal from the 5, Murray threw to Larry Fitzgerald. Incomplete. On 3rd-and-goal from the 5, Murray again failed to connect with Fitzgerald. Facing 4th-and-goal from the 5, the Cardinals again sent out Gonzalez for a third chip shot. The Ravens defense was then called for a delay of game, moving Arizona up to the 2-yard line. From there, Kingsbury — trailing by 11 in the 2nd half — kept Gonzalez on the field! In perhaps the most indefensible move of the day, Kingsbury chose to kick a field goal. Over the last 5 years, teams have converted half of these 3rd (or 4th) and goal plays from the 2 into touchdowns. [continue reading…]

{ 1 comment }

More Thoughts On The Value Of A Passing Offense

This is Part 2 to yesterday’s post about how value is determined. Please read that before proceeding.

Here’s a hypothetical situation to consider. In a few months, the NFL owners get together and decide that passing is too easy, scoring is too high, and offenses are too good. As a result, they have agreed upon a drastic rules change: starting in the 2020 season, NFL defenses will be allowed to put 12 players on the field, while NFL offenses will still be constrained to 11 players.

This will significantly change the NFL landscape, of course. Scoring is going to plummet. Passing efficiency is going to tank, and rushing with any sort of consistency is going to be impossible.

Now, here’s a question. You are the Kansas City Chiefs with Patrick Mahomes, who — for the sake of this argument — has just completed his second consecutive MVP season. He’s the clear best quarterback in the NFL, but he will now be playing in an NFL where passing is going to be much, much harder.

Does this rule change help or hurt your team’s chances of winning?

Think about it for a minute.

*****************************

I can wait.

***************************** [continue reading…]

{ 1 comment }

How Is Value Determined?

You are offered the opportunity to win some money by picking two marbles, one each out of two different bags. First, you get to dip your hand into a bag of six red marbles, with each marble worth a different dollar amount. The dollar amounts are $10, $20, $30, $40, $50, and $60. You will next get to dip your hand into a bag of six blue marbles, with the marbles worth $60, $64, $68, $72, $76, and $80.

Simple math will tell you that the average red marble is worth $35 and the average blue marble is worth $70; it’s clear which bag has the better marbles, and you can also expect to walk away with about $105 once this game is completed. Now, our benevolent contest operator says he will make your life even better. In one of the bags, he will discard the bottom three marbles: he will remove either the $10, $20, or $30 marbles from the red bag, or the $60, $64, or $68 marbles from the blue bag. This, of course, is great news. [continue reading…]

{ 0 comments }

It’s the game’s first play from scrimmage. Your team has the ball, on 1st-and-10, at its own 30-yard line. The quarterback hands it to the running back, who begins running forward.

He avoids a tackle in the backfield, preventing a 1-yard loss. He then runs from the 29 to the 30 to the 31 to the 32…. and so on, until getting tackled at the 45 yard line. He gets high-fives from his teammates as he jogs back to the huddle.

Now, let’s look at you the coach. Which one-yard incremental gain out of those 15 yards made you the happiest? The least-happy? Let’s assume that you are all-knowing, and therefore know the value of each yard gained at all points during a game. If we had a happiness monitor on you, where would it spike? Did the 1-yard gain from the 29 to the 30 make you happy (ignoring for these purposes, the fact that you couldn’t gain the other yards if you didn’t gain the first ones)? Was it the 1-yard gain from the 33 to the 34, putting you in 2nd-and-6? The 1-yard gain from the 39 to the 40, guaranteeing a new set of downs? The 1-yard gain from the 44 to the 45, bringing you ever closer to the end zone?

What about the least happy: that is, which 1-yard gain did almost nothing for you? As it turns out, there’s an answer to that question. And it may surprise you.

Using the Expected Points Added feature in PFR’s play-by-play log, we can measure how many expected points were added as each yard was gained.  That is shown that in blue columns in the graph below. For example, a 1-yard gain is worth -0.4 expected points, because gaining just one yard on 1st down is a bad thing; it sets a team back.  Gaining exactly 4 yards is worth 0.0 expected points: it doesn’t change how you think this drive will end. Gaining 12 years is worth nearly 0.8 additional expected points, and gaining 15 yards is worth nearly one full point of EPA.  That’s what the blue columns show.

The red columns? They show the marginal expected points added of each additional yard gained.  There are three takeaways from looking at the marginal value of each yard: (1) each yard is worth about +0.14 EP up until yard 10; (2) the 10th yard provides zero (or even negative!) value, and (3) all yards after 10 are about half as valuable as the yards gained before 10 yards (about +0.07 EP). Take a look:

This is a bit counter-intuitive.  Don’t feel bad if you thought that the 10th yard was the most valuable yard, since that is the yard that moves the chains.  But history shows us that it’s better for an offense to have 2nd-and-1 at the 39 than 1st-and-10 at the 40, since 2nd-and-1 is such an advantageous situation for the offense.

Pretty interesting, I think.

Now, let’s do the same exact exercise but for 2nd-and-10. Once again, each additional yard is worth about 0.14 EP in the beginning, but then we have an enormous jump when it comes to that 10th yard.  Gaining 9 yards on 2nd-and-10 is worth 0.50 EPA, but gaining 10 yards is worth 1.21 EPA!  That means there are 0.71 EPA assigned to that 10th yard, making it by far the most valuable. And then, once again, the value of each yard gained after picking up a first down drops in half to about 0.07 EPA.  The total EPA from each gain is shown in blue, while the red column shows the marginal value of each yard gained.

[continue reading…]

{ 1 comment }

Dungy and Edwards in Tampa Bay

16 seasons ago, the Rooney Rule was instituted in the NFL. At the time there were just two African American head coaches in the NFL: Tony Dungy of the Colts and his former assistant, Herm Edwards of the Jets.

Today, there are… just three African American head coaches in the NFL.  Mike Tomlin, hired by the Steelers in 2007, Anthony Lynn, hired by the Chargers in ’17, and newly-hired Brian Flores, who comes to Miami after a stint as the linebackers coach and de facto defensive coordinator/play caller in New England in 2018.

One big reason that Tomlin and Lynn are still around: they went to teams with Ben Roethlisberger and Philip Rivers. Other minority head coaches — and, of course, white coaches — haven’t been nearly so lucky.

There has been a lot written over the last two months about the lack of African American head coaches in the NFL, especially after five were fired in the last few months. This is a complicated topic with a simple reality: African American coaches have been stuck with bad quarterbacks and subsequently fired.

Arizona’s Steve Wilks was fired after one season with Josh Rosen at quarterback, who was the worst statistical passer in 2018. Denver’s Vance Joseph was fired this year after winning 11 games in two seasons in Denver with Trevor Siemian, Brock Osweiler, Paxton Lynch and Case Keenum as his quarterbacks. Cleveland’s Hue Jackson was finally fired in 2018 on the basis of a 1-31 mark in ’16 and ’17 with Cody KesslerJosh McCown, and a 21-year-old DeShone Kizer. And in New York, Todd Bowles was fired after four years with the Jets, coaching Ryan Fitzpatrick, Josh McCown, Bryce Petty, and a 21-year-old Sam Darnold. [continue reading…]

{ 0 comments }

Analyzing Third Down Passes From 1997 to 2017

How has the NFL evolved when it comes to third down passing? Using the PFR Play Index, I looked at all passes on third downs in each season from 1997 to 2017 that met the following criteria:

  • The play came during the regular season.
  • The pass happened in the first three quarters of the game to minimize the effects of game situation, as 4th quarter passes may be different than passes earlier in the game (although that’s worth investigating, too!).
  • The team on offense was down by no more than 14 points or up by no more than 14 points, to again minimize the effects of game situation.
  • The distance was between 5 and 10 yards to go, to isolate obvious passing situations but not hopeless ones.

What were the results? What do you *think* the results would be? [continue reading…]

{ 12 comments }

13 Points > 14 Points, Part II

Yesterday, I wrote about the peculiar bit of trivia that teams scoring exactly 13 points win more frequently than teams scoring exactly 14 points. There were some great comments in those posts, and today, I want to get a little more granular with the data.

From 1999 to 2016, there were 462 games where a team scored exactly 13 points by two field goals and one touchdown, and 382 games where a team scored exactly 14 points by two touchdowns and two extra points. Note: the data set in today’s post is limited to 13-point games with 2 FG + 1 TD and 14-point games with 2 TDs (and 2 XPs); all other avenues to 13 or 14 points were discarded. In the 13-point games, teams won 26.2% of the time and allowed 19.7 points; in the 14 point games, teams won 14.1% of the time and allowed 24.8 points.

So the 13-point scoring teams allowed 5 fewer points per game than the 14-point scoring teams, which of course explains why they have a better record.  What about when those scores occurred? On average, the 13-point scoring teams produced their three scores at 15.6 minutes, 31.7 minutes, and 47.4 minutes of game play — in other words, early 2nd quarter, early 3rd quarter, and early 4th quarter. Meanwhile, the 14-point scoring teams scored at the 22-minute mark and the 43-minute mark, or midway through the 2nd quarter and at the end of the 3rd quarter.

Does that mean anything? I’m not so sure.  So instead, let’s break things into 5-minute buckets.  How early into the game did these teams first score?

The 13-point teams produced their first score in the first quarter in 53% of games; conversely, the 14-point teams only scored in the 1st quarter in 36% of games.  In 83% of games, the 13-point scoring teams had scored by the 25-minute mark, compared to just 60% of 14-point scoring teams.  Of course, the 13-point scoring teams are often scoring field goals, while the 14-point scoring teams are only scoring touchdowns.

What about their second scores?  For 13-point scoring teams, a whopping one-third of teams scored for the second time in the final 5 minutes of the first half.   For the 14-point scoring teams, 41% of those teams were at 7 points until the final 10 minutes of the game, with 25% stuck at 7 until the final 5 minutes.

Teams that scored 14 points but had their second touchdown come in the final 10 minutes went 20-136, for a 12.8% winning percentage. That dropped to 10.5% — a 10-85 record — when the second score came in the final 5 minutes.

Finally, what about the field goal kicking teams? When did their third score occur?

There were also 9 games where the 13-point scoring team scored in overtime, which were all wins.  But teams also won 35.8% of games where the third field goal came in the final five minutes of regulation, for a 49-88 record.

There’s some evidence that time of possession plays a factor in the 13 vs. 14 phenomenon, and it’s possible (although I am not particularly persuaded) that scoring on three drives may have some marginal benefit above scoring on two drives. But for the most part, I think this phenomenon is the result of survivorship bias.  Teams that score a field goal late are often going to win games, even (especially!) if they don’t score a lot of points overall.

{ 4 comments }

The Jacksonville defense ranks 32nd in rushing yards allowed and rushing yards per carry allowed, making it the worst rushing defense in the league by either measure. Some of this is the result of the small sample size of a four-week season: Bilal Powell had a 75-yard fluke touchdown run on Sunday against the Jaguars, and backup Elijah McGuire had a 69-yard run a couple hours later that, while not fluky, is probably not going to happen every four games.

But that’s not what’s weird about the Jaguars defense.  What’s weird is that opposite the worst rushing defense in the league is the stingiest pass defense, in terms of both yards (meaningless) and ANY/A (very meaningful). The Jaguars lead the league in sacks, with 18, while ranking 3rd in passer rating (which doesn’t include sacks). So this is a really strong pass defense, at least through four games.

In theory — more on this in a minute — a team shouldn’t be really good at pass defense and really bad at rush defense, absent some extreme roster composition. And with Calais Campbell, Yannick Ngakoue, Malik Jackson, Paul Posluszny, Myles Jack, and Telvin Smith, the Jaguars front seven has more than enough talent to turn this thing around.  If I had to guess, the rush defense will improvement significantly, while the pass defense will still play like a top-10 unit the rest of the way.  In other words, this should be a really good defense, not just a really great pass defense. [continue reading…]

{ 6 comments }

A rare sighting: Christian Hackenberg throwing a pass for the Jets

Penn State quarterback Christian Hackenberg was a very polarizing prospect. Pro Football Focus called him undraftable, and he ranked as the 2nd-worst quarterback in college football in 2014.

But there’s one thing we know: at least someone in the Jets organization really liked him. That person, presumably, is general manager Mike Maccagnan, although it’s likely that head coach Todd Bowles and now-retired offensive coordinator Chan Gailey (and perhaps owner Woody Johnson) had positive thoughts about Hackenberg, too. We know this because the Jets drafted Hackenberg with the 51st pick in the 2016 Draft, so obviously New York wanted him on the team.

Hackenberg was stuck behind Ryan Fitzpatrick, Geno Smith, and Bryce Petty as a rookie.  He was the fourth string quarterback for much of the year, so even once Smith and Petty were hurt, Hackenberg never had enough reps to make him prepared to take the field over Fitzpatrick even in the season finale.

So where do the Jets (which I am using as a stand in for Maccagnan, or a combination of Maccagnan and Bowles) stand on Hackenberg now? There are a few possibilities: [continue reading…]

{ 14 comments }

There are no fewer than four problems with passer rating.

1. It does not adjust for era.

2. It only includes four variables — completion percentage, yards per attempt, touchdown rate, and interception rate — which means valuable information like sacks, first downs, and rushing are excluded.

3. The variables it does include are improperly weighted: a completion is worth 20 yards (too much), a touchdown is worth 80 yards (also too much), and an interception is worth -100 ways (again, too much).

4. Like nearly all non-proprietary formulas, it does not provide any situational context: an interception on 1st-and-goal from the 1 is the same as an interception on a Hail Mary, a 10-yard catch on 4th-and-9 is the same as a 10-yard catch on 3rd-and-30, etc.

These are just some of the reasons why passer rating is stupid. For reasons I can’t quite articulate, I only want to focus on solving the issue presented by problem number one. Yes, it may be silly to artificially tie one hand behind my back, but my goal here is not to come up with a new formula, but just to fix one specific issue with passer rating that everyone can acknowledge.

The past two days, I have been writing about passer rating. If you ignore the upper and lower limits in the formula, passer rating’s four variables can be re-written like this: [continue reading…]

{ 14 comments }

Playing like cowards

When athletes lose to inferior opponents, the excuses quickly follow. That’s a pretty good rule of thumb, and it applies to women’s soccer, too. Here’s what Hope Solo said after the U.S. lost to Sweden in the Olympics:

“I thought that we played a courageous game,” Solo said. “I thought that we had many opportunities on goal. I think we showed a lot of heart. We came back from a goal down; I’m very proud of this team.

“I also think we played a bunch of cowards. But, you know, the best team did not win today; I strongly, firmly believe that. I think you saw America’s heart. You saw us give everything that we had today. Unfortunately the better team didn’t win.”

The U.S. outshot Sweden 27-2, but the game ended 1-1 after 120 minutes plus stoppage time. The unique thing about soccer is that its tiebreaker is a shootout, which is kind of like playing an NFL game and then having a field goal kicking contest. In other words, once you go to a shootout, the better team suddenly doesn’t have much (any?) of an edge.

Asked to elaborate on what she meant by cowards, Solo referenced Pia Sundhage, the Swedish coach who formerly coached the United States and won two Olympic gold medals.

“Sweden dropped off, didn’t want to open play,” Solo said. “They didn’t want to pass the ball around. They didn’t want to play great soccer, entertaining soccer. It was a combative game, a physical game. Exactly what they wanted and exactly what their game plan was. They dropped into a 50. They didn’t try and press, they didn’t want to open the game and they tried to counter with long balls. We had that style of play when Pia was our coach.

“I don’t think they’re going to make it far in the tournament. I think it was very cowardly. But they won. They’re moving on, and we’re going home.”

[continue reading…]

{ 88 comments }

Thoughts on Thresholds Models of Collective Behavior

I would like to recommend Revisionist History, a new podcast from Malcolm Gladwell. His third podcast, The Big Man Can’t Shoot, nominally covered Wilt Chamberlain and his struggles at the free throw line. But, as is often the case with Gladwell’s work, it’s about so much more than that.

Of particular interest to me was the academic paper Gladwell cited, which formed the meat of the podcast. It was written by Mark Granovetter, back in 1978, and is titled Threshold Models of Collective Behavior. Here’s a link to the paper, which I recommend reading if you have the time.   But a couple of Granovetter’s examples resonated with me as being particularly relevant to us, and I would like to reproduce them here using a football analogy.

[Note: You may wonder why am I copying his work here? I find the application of this idea of threshold models of collective behavior to be worthwhile for our broader discussion, and I think the best way to encourage discussion of it here is to reproduce it in our world, rather than just telling you to go read a link.  Full credit, of course, belongs to the author.]

Many analysts, myself included, think that NFL teams are way too conservative when it comes to going for it on 4th down. In general, coaches do not call plays in an optimal way, and we have long understood that part of the problem is no coach wants to take the heat for failing unconventionally. So we just assume that “the NFL” is overly conservative on this point.

Now, let’s make some assumptions. “Being aggressive” is not a binary thing — there are hundreds of aggressive/conservative options/decisions that come up in a season — but to simplify things, let’s assume that coaches can either be aggressive or conservative. And, let’s assume that right now, all 32 head coaches are conservative.

However, let’s assume that all 32 coaches think being aggressive is better than being conservative, but they also have resistance to switching from being conservative to being aggressive. And these resistances are not uniformly held: these 32 coaches each have different thresholds on when to make that switch. Let’s say the Patriots would be willing to be aggressive as long as just one other team was aggressive first. This would mean New England is very eager to be aggressive, but just doesn’t want the spotlight solely on them. And let’s say the 49ers would be aggressive as long as two other teams became aggressive first. And the Ravens would be aggressive as long as three other teams were aggressive first. [continue reading…]

{ 22 comments }

When an athletic but raw player is drafted, it’s common to hear that he will succeed if he can be “coached up” in the NFL. That idea relies on the assumption that there’s going to be enough individualized coaching in the NFL for that player to reach his potential. But I’m not really sure if that is true, especially when it comes to less highly-touted prospects.

This was an interesting article about offensive linemen in the NFL who believe that the time limits on practices under the CBA “have forced NFL coaches to spend most of their time installing the offense, rather than focusing on the tricks of the trade. That’s led to sloppy play.” And Ryan Riddle, a former sixth round pick who now writers at Bleacher Report, recently tweeted something similar, saying that NFL coaches focus on the macro level rather than individual technique. [continue reading…]

{ 15 comments }

NBA 3-Point Attempts and Going For it On 4th Down

In overly simple terms (ignoring things like fouls, rebounds, game theory, etc.), the expected value of a 2-point field goal attempt is the 2-point field goal percentage multiplied by 2, and the expected value of a 3-point field goal attempt is the 3-point field goal percentage multiplied by 3. Here’s a look at the EV for both 2-point and 3-point attempts in every NBA season going back to 1979-1980, courtesy of basketball-reference:

nba

The inflection point came right around 1990; after that, the 3-point shot was associated with a higher expected value, and since ’97-’98, the 3-point shot has about 12% more EV than a 2-point shot. Now, I know just about nothing about the NBA and even less about NBA analytics, but it’s easy to draw a couple of conclusions from this chart. One would be that teams should be taking more 3-pointers, even though “traditional coaches” have not been fans of the 3-point shot. It’s easy to look at this chart and dismiss it, and say that a team shouldn’t take a bunch of 3 pointers just because the math says it makes sense. On the other hand, you have the Golden State Warriors. [continue reading…]

{ 11 comments }

Yesterday, the NFL approved a one-year rule to kickoffs to change the spot of the snap after a touchback to the 25-yard line. Last year, 56% of all kickoffs were not returned, and the average starting field position following kickoffs was heavily impacted by the 2011 rule change that moved kickoffs from the 30 to the 35 yard line:

kickoff fp

This change goes in the other direction, albeit with competing interests. On one hand, this provides a significant incentive for kickoff returners to take a knee. Many kickoffs are boomed several yards into the end zone; at this point, the odds are pretty low that an average return five yards deep will make it out ahead of the 25-yard line. [continue reading…]

{ 7 comments }

Additional Thoughts on Sam Bradford

On Thursday, I wrote about the mediocre (and worse) statistics produced by Sam Bradford throughout his career. Today, I wanted try to present the other side of the case. I’ve written about Bradford a few times here at Football Perspective, and some of those articles are instructive:

  • A year ago, I wondered whether Bradford would break out in his first season with the Eagles, and became a quarterback with the rare age 27 breakout season. I wrote that the odds were highly against a quarterback playing like Bradford through age 26 and then turning into a very good quarterback, but number one picks stuck on bad teams were the quarterbacks most likely to buck that trend.

In the context of defending Bradford, it is easy to point to a revolving cast of characters, both at receiver and offensive coordinator. His first three seasons in St. Louis, he had a different leading receiver and different offensive coordinator each year. In fact, he’s now had five different leading receivers in each of his five seasons, and last year was the first time he’s had a player gain even 700 receiving yards:

YearTop ReceiverRec YdsOffensive Coordinator
2010Danny Amendola689Pat Shurmur
2011Bradon Lloyd683Josh McDaniels
2012Chris Givens698Brian Schottenheimer
2013Jared Cook671Brian Schottenheimer
2015Jordan Matthews997Pat Shurmur

As a result, no player has gained even 15% of Bradford’s career passing yards. In fact, Bradford’s career-leading weapon is Brandon Gibson, who has 11.2% of Bradford’s yards. And only Danny Amendola is also over seven percent.

ReceiverTarYdsPerc
Brandon Gibson226165211.2%
Danny Amendola22913989.5%
Chris Givens1199936.7%
Jordan Matthews1179186.2%
Lance Kendricks1249006.1%
Steven Jackson1458715.9%
Zach Ertz1058165.5%
Austin Pettis1206904.7%
Danario Alexander746054.1%
Daniel Fells653912.6%
Brandon Lloyd583512.4%
Laurent Robinson753442.3%
Jared Cook423342.3%
Mark Clayton463322.2%
Brian Quick453152.1%
Darren Sproles652972.0%
Brent Celek202952.0%

That’s a pretty underwhelming set of receivers. One thing that might be instructive is seeing how those players have fared without Bradford. Let’s go in descending order based on the number of targets each player has seen from Bradford. [continue reading…]

{ 2 comments }

Before you can get good at projecting fantasy points, you need to understand how fantasy points are scored.  And there’s probably no better place to start than in the passing game.

I used the following scoring system to determine passing fantasy points: 1 point per 25 yards passing (this is gross passing, so if you look at team passing data, you need to add back in sack yards), 4 points per touchdown pass, and -1 point per interception.  That’s it.

The average team in 2015 scored 16.1 fantasy points per game; to make life a bit more intuitive, I am going to convert fantasy point numbers into a plus/minus average number. So the Patriots passing attack, which scored 329.5 fantasy points in 16 games, and averaged 20.6 FP/G, gets credited as +4.5. That was the best average in football. On defense, the Patriots were slightly better than average, at +0.3 points per game (here, positive is good for defense; if you forget, just check the Saints line). Using New Orleans as an example, the Saints get a +4.2 offensive grade (ranked 2nd) and a -6.5 defensive grade (32nd). I put all 32 teams into the table below with their respective offensive and defensive grades and ranks: [continue reading…]

{ 5 comments }

How many interceptions will a team throw in a game?  That’s dependent on a number of things, of course, but I want to focus on three things: how interception prone the team is, how interception prone the opposing defense is, and the Game Script.

Suppose you knew what the Game Script of a game would wind up being; given that you have a general sense of the offense’s and defense’s interception rates, what weight would you put on each variable to predict a team’s interception rate?

The same is true for other statistics.  For example, what about rushing yards?  How many yards would you project Team A to run for against Team B, if you knew the rushing stats for  Team A’s offense, Team B’s defense, and the Game Script?

Or passing yards.  Or completion percentage.  The interplay between offense and defense is always interesting — some research suggests about 60% of the result is due to the offense, with 40% based on the defense — but throwing in Game Scripts adds an interesting element.

Oh, and one final thought: how would you go about trying to answer these questions.  What studies would you run?  What would you like me to do?

{ 8 comments }

Grouping Players Into Attackers and Mitigators: Part I

I’ve been reading Chris Brown’s excellent new book, The Art of Smart Football. One of the passages in Brown’s book about legendary head coach Sid Gillman stood out to me:

Realizing that a football field is nothing more than a 53⅓-yard-wide geometric plane, Gillman designed his pass patterns to stretch defenses past their breaking points. His favorite method was to divide the field into five passing lanes and then allocate five receivers horizontally in each one. Against most zones, at least one receiver would be open.

Below is an example of what Gillman was referring to: [1]While I couldn’t find the exact picture Chris used in the book, this one illustrates the same concept. you can see that, horizontally, one target will end up in each fifth of the field:

When it comes to pass patterns, the receivers are the players on the attack, and there’s a relatively wide variance in how effective a receiver can be (i.e., he can get open all the time, some of the, none of the time, etc.). But the players in pass coverage should be viewed in a different way: all they can do is mitigate the player in front of them. [continue reading…]

References

References
1 While I couldn’t find the exact picture Chris used in the book, this one illustrates the same concept.
{ 9 comments }

You remember 1976, don’t you? Two teams — the Colts with Bert Jones and Roger Carr, and the Raiders with Ken Stabler and Cliff Branch — stood out from the pack when it came to pass efficiency that season. The Colts led the NFL in passing yards, ranked 2nd in passing touchdowns, and threw just 10 interceptions, tied for the fewest in the NFL. Oakland threw 33 touchdown passes — nine more than the Colts and 12 more than any other team in football — while ranking 3rd in passing yards. Both teams averaged 7.5 Net Yards per Pass Attempt, while every other team was below seven in that metric. Those two teams went a combined 24-4.

The next four best passing teams were St. Louis, Dallas, Minnesota and Los Angeles. Each of those teams went 10-4 or better. In fact, the linear relationship between pass efficiency and team record was quite strong that year. Take a look at the chart below, which plots Relative ANY/A — i.e., Adjusted Net Yards per Attempt relative to league average — on the X-Axis, and Winning Percentage on the Y-Axis: [continue reading…]

{ 21 comments }

Guest Post: Questioning ANY/A

Adam Steele is back for another guest post. And, as always, we thank him for that. You can view all of Adam’s posts here.


Within the analytics community, we seem to have reached a consensus that ANY/A is the best box score metric for measuring passing efficiency. Over at the Intentional Rounding blog, Danny Tuccitto tested the validity of ANY/A using a technique called Confirmatory Factor Analysis. You can read his three part analysis here, here, and here. Essentially, he discovers that Y/A and TD % are valid statistics for measuring QB quality, while sack % and INT % are not. At first I was skeptical, but after some pondering I came up with a half-baked theory of why this might be true:

As we evaluate the potential for an athlete to succeed in professional sports, there are two kinds of statistics: Qualifying and Disqualifying. In the case of quarterbacks, I define a qualifying statistic as a minimum threshold the player must meet to even be considered NFL worthy. If we deconstruct ANY/A into its four components, Y/A and TD % emerge as qualifying statistics. In today’s NFL, I estimate that a QB must possess a true talent level of at least 6.0 Y/A and 2.5 TD % to deserve a roster spot. There are very few people in the world who can reach those thresholds against NFL caliber defenses (my best guess is around 100). With these two simple statistics, we’ve already weeded out the vast majority of quarterbacks from ever playing in the NFL.

Next, we turn to sack % and INT %, which are disqualifying statistics. By themselves, neither of these skills qualify a QB to play in the NFL. Anybody can avoid sacks or interceptions if they’re not worried about gaining yards. However, the inability to avoid sacks or interceptions will disqualify a QB from the NFL, regardless of how high his Y/A and TD % might be. I estimate these limits as roughly a true talent 12% sack rate and 4.5% INT rate. The population of quarterbacks who can stay under these limits AND perform above the minimum Y/A and TD % is very small. In most years, there aren’t enough of these QB’s to fill the 32 NFL starting spots. Among quarterbacks who receive significant NFL playing time, there is a strong survivorship bias for the disqualifying statistics of sack % and INT %, as the quarterbacks who make too many negative plays have already been weeded out of the sample. Given that Y/A and TD % are far rarer skills with no upper limits, these two statistics are the true measuring stick at the NFL level.

To test this theory, I created a very simple metric called Positive Yards Per Attempt (PY/A). It’s just passing yards plus a 20 yard bonus for touchdowns, divided by pass attempts (which does not sacks). I then converted PY/A into a value metric by measuring it relative to league average (RPY/A) [1]Note that in calculating league average, I excluded the player in question from the league average totals. So each player is compared to a slightly different definition of league average. and VALUE above average by multiplying RPY/A by attempts. We already have these variations of ANY/A (that is, RANY/A and VALUE), so comparing the two metrics is very straightforward. Since the merger, there have been 1,423 QB seasons of with least 200 dropbacks. This table lists the top 100 seasons of PY/A VALUE, as well as the ANY/A VALUE and rankings for these players. The “Diff” column signifies the gap in ranking between the the two metrics, with a positive number indicating a QB who is favored by PY/A and negative number favoring ANY/A.

RankQuarterbackTeamYearDpbkRPY/AVALUERANY/AVALUERankDiff
1Peyton ManningIND20045103.2916374.27217621
2Dan MarinoMIA19845772.8315984.0923591-1
3Aaron RodgersGNB20115383.0815443.6193652
4Kurt WarnerSTL20015842.714722.2913392521
5Kurt WarnerSTL19995282.914483.22170161
6Tom BradyNWE20075992.4314023.4820834-2
7Peyton ManningDEN20136772.0513483.1121043-4
8Kurt WarnerSTL20003673.6512652.8210357668
9Lynn DickeyGNB19835242.5512321.71898112103
10Steve YoungSFO19944922.6712302.961454155
11Steve YoungSFO19934932.6412182.5212413524
12Ken StablerOAK19763103.912123.4811504533
13Daunte CulpepperMIN20045942.1611812.471468130
14Boomer EsiasonCIN19884183.0411782.8511924026
15Chris ChandlerATL19983723.5511612.35876119104
16Drew BreesNOR20116811.7511472.4216507-9
17Randall CunninghamMIN19984452.6911433.32147912-5
18Tom BradyNWE20116431.8611332.4315628-10
19Bert JonesBAL19763723.0811283.8415259-10
20Philip RiversSDG2010579210842.112173818
21Drew BreesNOR20095342.1110842.74146514-7
22Daunte CulpepperMIN20005082.2410612.1310836240
23Philip RiversSDG20095112.1510462.73139519-4
24Philip RiversSDG20085032.1510252.412093915
25Joe MontanaSFO19894192.589963.161322272
26Tony RomoDAL20075441.849551.79279973
27Aaron RodgersGNB20145481.839512.59142118-9
28Mark RypienWAS19914282.249443.25139120-8
29Steve YoungSFO19985651.829412.0511564314
30Steve YoungSFO19924312.39253.33143617-13
31Jim KellyBUF19915051.959231.8392510069
32Ben RoethlisbergerPIT20095561.829211.5284513098
33Nick FolesPHI20133452.869083.371162429
34Peyton ManningIND20054701.999042.76130029-5
35Brett FavreGNB19956031.568911.911474611
36Tony RomoDAL20144652.028781.9891910670
37Drew BreesNOR20086481.388761.92124234-3
38Steve BeuerleinCAR19996211.538741.6410197941
39Dan FoutsSDG19823422.038573.07134223-16
40Roger StaubachDAL19733292.778462.09735169129
41Aaron RodgersGNB20095911.548321.8811115918
42Ken AndersonCIN19754092.058253.04132526-16
43Matt SchaubHOU20096081.418221.861130529
44Dan FoutsSDG19854481.918192.229938440
45Ken StablerOAK19743282.458093.231128549
46Jeff GeorgeMIN19993572.458081.88672193147
47Boomer EsiasonCIN19864951.728072.1410606922
48Peyton ManningIND20005911.418052.08123236-12
49Dan MarinoMIA19866401.298022.12135522-27
50Peyton ManningDEN20126041.378012.02122237-13
51Jim EverettRAM19895471.547971.9810826312
52Eli ManningNYG20116171.357961.69868735
53Warren MoonHOU19906201.367952.08128732-21
54Donovan McNabbPHI20045011.687902.3115444-10
55Peyton ManningIND20065711.417872.63150310-45
56Philip RiversSDG20135741.447841.98113651-5
57Joe NamathNYJ19723352.237712.2179114689
58Tom BradyNWE20105171.567682.59133924-34
59Vinny TestaverdeBAL19965831.397651.27743163104
60Steve YoungSFO19973912.157642.3692210444
61Drew BreesNOR20136871.177631.7116541-20
62Aaron RodgersGNB20105061.617631.8291910745
63Joe MontanaSFO19844541.767593.02137021-42
64Brett FavreGNB19975381.477551.7292310238
65Drew BreesNOR20126961.127511.2989511449
66Steve YoungSFO19912922.677463.1692210337
67Steve McNairTEN20034191.857412.67111958-9
68Trent GreenKAN20045881.337371.4585612658
69Brett FavreMIN20095651.387352.03114447-22
70Terry BradshawPIT19783891.997322.0881114171
71Drew BreesNOR20065721.327292.28130428-43
72Tony RomoDAL20095841.327281.95114049-23
73Brett FavreGNB20015321.437281.881003818
74Neil LomaxSTL19846091.297251.76107166-8
75Tony RomoDAL20063582.147231.85662200125
76Peyton ManningIND20095811.267221.93112057-19
77Aaron RodgersGNB20126031.37191.4487112144
78Peyton ManningIND20075361.397151.839798911
79Ben RoethlisbergerPIT20052912.647082.22647208129
80Ken AndersonCIN19743642.027072.459519414
81Dan FoutsSDG19816281.157022.37148611-70
82Dan FoutsSDG19806211.197011.69104871-11
83Jeff GarciaSFO20005851.257012.21129031-52
84Ben RoethlisbergerPIT20074511.736991.06476299215
85Trent GreenKAN20024961.476931.7285412742
86Peyton ManningDEN20146141.156881.59979882
87Ben RoethlisbergerPIT20146411.126841.75112156-31
88Craig MortonDEN19814301.86751.06455318230
89Peyton ManningIND20035841.176642.22129430-59
90Trent GreenKAN20035431.256541.95105670-20
91Peyton ManningIND19995471.226511.94106267-24
92Brett FavreGNB19965831.196481.5288911624
93Dan FoutsSDG19833541.96452.3884313239
94Greg LandryDET19712902.316442.13660201107
95Carson PalmerCIN20055281.266441.97104174-21
96Roger StaubachDAL19712342.866433.9799185-11
97Carson PalmerCIN20065561.236421.4681214043
98Joe MontanaSFO19874201.41640295893-5
99Tom BradyNWE20055561.216391.5686912223
100Dan FoutsSDG19784031.676362.1285212828

This list makes a strong case for the validity of PY/A. It’s populated by the greatest QB seasons of all time at the top, and filled out by a number of other notably great and very good seasons. There are a few head scratchers (most notably Lynn Dickey at #9), but for the most part it’s a very credible list that closely mirrors the ANY/A rankings. That’s the point, really. When we remove sacks and interceptions from ANY/A, it doesn’t lose much accuracy, if any. At first glance, I was concerned that PY/A systematically overrates certain quarterbacks and underrates others. That’s probably true to a certain degree. However, I would argue that ANY/A has the same issue, except it’s a different set of quarterbacks who are over- and underrated by it. The true balance almost certainly lies somewhere in between the two metrics. FWIW, the correlation between RPY/A and RANY/A is a robust 0.877, with an r-squared of 0.769.

Now lets look at the other end of the spectrum – the 100 worst PY/A VALUE seasons since 1970.

Rank TeamYearDpbkRPY/AVALUERANY/AVALUERankDiff
1423Derek CarrOAK2014623-2.02-1209-1.36-8481395-28
1422Drew BledsoeNWE1995659-1.71-1086-1.09-7161366-56
1421Jon KitnaCIN2001606-1.67-972-1.48-8981408-13
1420Chris WeinkeCAR2001566-1.79-964-1.5-8481396-24
1419Joey HarringtonDET2003563-1.67-928-1.38-7791380-39
1418Kyle BollerBAL2004499-1.93-894-1.51-7551374-44
1417Blaine GabbertJAX2011453-2.16-894-2.28-103214192
1416Jack TrudeauIND1986446-2.14-893-1.96-8741405-11
1415Vince EvansCHI1981459-2.02-883-1.78-8181391-24
1414Ryan FitzpatrickCIN2008410-2.23-828-2.18-8921407-7
1413Archie ManningNOR1975387-2.23-803-2.76-113914229
1412Sam BradfordSTL2010624-1.36-801-1.04-6461349-63
1411Mark RypienWAS1993335-2.47-788-2-6711354-57
1410Bobby HoyingPHI1998259-3.46-775-3.94-102014188
1409Kordell StewartPIT1998491-1.68-769-1.78-8731404-5
1408Kyle OrtonCHI2005398-2.05-753-2.19-8721403-5
1407Jimmy ClausenCAR2010332-2.51-749-2.8-93014136
1406Blake BortlesJAX2014530-1.57-745-2.39-1268142317
1405Colt McCoyCLE2011495-1.59-736-1.19-5911329-76
1404Mark MalonePIT1987354-1.91-734-2.24-90714106
1403A.J. FeeleyMIA2004379-2.06-732-2.25-8511399-4
1402Joey HarringtonDET2002437-1.66-711-1.4-6131337-65
1401Akili SmithCIN2000303-2.65-708-2.44-7381371-30
1400Bruce GradkowskiTAM2006353-2.07-679-1.76-6211342-58
1399Jake PlummerARI2002566-1.27-676-1.54-87014023
1398Rusty HilgerDET1988337-2.19-672-2.38-8021386-12
1397Gary MarangiBUF1976254-2.62-649-3.14-85214014
1396Joe FlaccoBAL2013662-1.05-648-1.42-942141620
1395Matt CasselKAN2009535-1.27-627-1.43-7631378-17
1394Dan PastoriniHOU1973320-2.02-626-2.39-8161390-4
1393Steve SpurrierTAM1976343-1.84-610-1.3-4771265-128
1392Joe FergusonBUF1983535-1.2-609-1.06-5701321-71
1391Jeff GeorgeIND1991541-1.25-608-1.37-7431372-19
1390Sam BradfordSTL2011393-1.69-604-1.44-5651318-72
1389Jake PlummerARI1999408-1.57-600-2.65-1079142031
1388Joe NamathNYJ1976246-2.44-598-2.91-7631377-11
1387John FrieszSDG1991519-1.22-596-0.89-4601254-133
1386Mark MalonePIT1986438-1.38-588-0.78-3441159-227
1385Mike PhippsCLE1975341-1.76-587-2.01-7311368-17
1384JaMarcus RussellOAK2009279-2.37-584-3.39-945141733
1383David CarrHOU2002520-1.31-583-2.17-1127142138
1382Brad JohnsonTAM2001603-1.04-580-0.4-2381041-341
1381Bernie KosarCLE1990460-1.37-580-1.27-5851327-54
1380Ryan LeafSDG1998267-2.31-566-3.44-918141131
1379Phil SimmsNYG1980438-1.41-565-1.41-6161338-41
1378Mark BrunellWAS2004252-2.35-558-1.85-4671261-117
1377Steve DeBergSFO1978319-1.84-554-2.25-7191367-10
1376Christian PonderMIN2012515-1.14-551-0.97-4991285-91
1375Browning NagleNYJ1992414-1.42-549-1.45-5981332-43
1374Rick MirerSEA1993533-1.13-547-1.27-6761356-18
1373Joe KappBOS1970246-2.34-546-3.55-933141441
1372Josh FreemanTAM2011580-0.99-543-1.18-6851359-13
1371Chad HenneJAX2013541-1.08-543-1.04-5651319-52
1370Steve DilsMIN1983481-1.22-542-0.68-3281142-228
1369Alex SmithSFO2007210-2.79-539-2.43-5111290-79
1368Chuck LongDET1987433-1.13-535-0.93-4611257-111
1367Todd BlackledgeKAN1984308-1.82-535-1.14-3521169-198
1366Joe FergusonBUF1984379-1.55-532-2.13-807138721
1365Donovan McNabbPHI1999244-2.45-530-2.8-6841358-7
1364Stan GelbaughSEA1992289-2.08-529-2.63-759137511
1363Jack ConcannonCHI1970409-1.29-528-0.68-2951104-259
1362Jim HartSTL1979403-1.4-528-1.39-5591315-47
1361Josh McCownARI2004439-1.29-525-1.06-4671260-101
1360Tommy KramerMIN1979602-0.93-524-0.43-2581062-298
1359Jim ZornSEA1976464-1.11-521-1.09-5411305-54
1358Mike LivingstonKAN1978308-1.79-520-1.08-3321144-214
1357Kerry CollinsCAR1997408-1.36-518-2.28-930141255
1356Rick MirerSEA1994408-1.35-515-0.71-2911100-256
1355Trent DilferTAM1996510-1.07-515-1.18-6011333-22
1354Donovan McNabbPHI2000614-0.9-514-0.44-2681071-283
1353Craig WhelihanSDG1998335-1.6-511-2.38-798138532
1352Brady QuinnCLE2009275-1.99-509-1.75-4811268-84
1351Boomer EsiasonCIN1992297-1.82-505-2.23-66213521
1350Dan PastoriniHOU1972336-1.57-502-1.35-4831270-80
1349Joey HarringtonMIA2006403-1.29-501-1.23-4941279-70
1348Kordell StewartPIT1999297-1.82-501-1.83-5451308-40
1347Doug PedersonCLE2000227-2.38-500-2.55-5781325-22
1346David KlinglerCIN1993383-1.45-499-1.37-5241297-49
1345Kelly StoufferSEA1992216-2.62-497-3.39-732136924
1344John HadlGNB1975388-1.32-496-1.55-64213484
1343Cleo LemonMIA2007334-1.6-496-1.17-3921212-131
1342Vince FerragamoBUF1985306-1.71-491-2.04-62313431
1341Danny KanellNYG1998321-1.63-488-1.6-5131291-50
1340Steve FullerKAN1979307-1.8-485-2.28-701136323
1339Steve DeBergSFO1979595-0.83-4800.32193537-802
1338Tony BanksSTL1998449-1.17-479-1.32-5921330-8
1337Bobby DouglassCHI1971255-1.98-474-2.6-708136427
1336Joey HarringtonDET2004525-0.97-474-0.52-2741075-261
1335Marc BulgerSTL2008478-1.07-472-1.36-652135015
1334Steve BonoKAN1996460-1.07-470-0.66-3051120-214
1333Mark SanchezNYJ2012487-1.02-462-1.61-786138350
1332David WoodleyMIA1980344-1.4-459-1.3-4461244-88
1331Matt HasselbeckSEA2009520-0.94-458-1.07-5581314-17
1330Mike PagelBAL1982237-1.62-458-0.83-2511055-275
1329Brett FavreGNB2006634-0.74-456-0.18-114901-428
1328Roman GabrielPHI1974373-1.26-456-0.59-2341036-292
1327Neil LomaxSTL1986473-1.08-454-0.92-4361241-86
1326Ken DorseySFO2004239-2-451-2.1-5011286-40
1325Brandon WeedenCLE2012545-0.87-449-0.98-5361301-24
1324Mike BorylaPHI1976275-1.71-448-2.07-608133511

I actually find the Worst list even more validating of PY/A than the Best list. When we think of bad quarterbacks, most us reflexively focus on quarterbacks who make a lot of mistakes and sink their teams in obvious and memorable ways. And this list is filled with conventionally terrible quarterbacks. But remember, nearly all of their negative plays have been removed, so it’s not their mistakes putting them on the list. It’s their impotence. These guys couldn’t make plays or move the ball down the field, killing their teams slowly and agonizingly. At the very top (err, bottom), we find Derek Carr’s rookie year. A lot of fans and pundits classify Carr as a budding franchise QB who showed “flashes of potential”. Actually no, he showed the exact opposite. While the younger Carr avoided sacks and interceptions at a reasonable rate, his Y/A was absolutely pathetic. Even accounting for his lousy supporting cast, that is a major red flag. It’s much easier for a young QB to reign in his mistakes than it is for him to suddenly learn how to make positive plays down the field. Blake Bortles fits precisely the same troubling profile, so I don’t have much hope for the class of 2014.

Does this change your feelings about ANY/A? Do you think Danny and I are wasting our time? If anyone else has created their own passing metric using basic stats, I’d love to hear about it.

References

References
1 Note that in calculating league average, I excluded the player in question from the league average totals. So each player is compared to a slightly different definition of league average.
{ 35 comments }
Previous Posts