≡ Menu

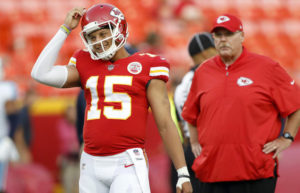
Clyde Edwards-Helaire has had a really good 13 months. He’s gone 13-1 as a starter for the 2020 Chiefs, including a win in the AFC Championship Game. This is a nice continuation of his time at LSU, where Edwards-Helaire went 15-0 as the leading rusher for the Tigers. Since January 1, 2019, Edwards-Helaire has gone 29-1 in his 30 games.

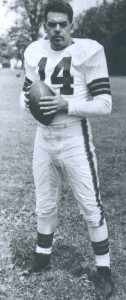
CEH is on the verge of winning the national championship and the Super Bowl in back to back seasons, a pretty rare feat. There have been 14 players to win a national championship and an NFL championship in back to back seasons. [1]The NFL qualifier excludes two other seasons. In 1947, when Frank Kosikowski was on Notre Dame’s back-to-back champions in 1946 and 1947; as a rookie, he played in the AAFC with the Cleveland … Continue reading [continue reading…]

References

References
1 The NFL qualifier excludes two other seasons. In 1947, when Frank Kosikowski was on Notre Dame’s back-to-back champions in 1946 and 1947; as a rookie, he played in the AAFC with the Cleveland Browns, who also won the the championship. In 1961, end Tommy Brooker was a key member of the undefeated Crimson Tide team. In 1962, he was drafted by the Dallas Texans (now the Chiefs), and he played both end and kicker for the team. In fact, he kicked the game-winning field goal in overtime to capture the AFL title that season.
{ 0 comments }

Leading Rusher For Each Super Bowl Team

The 2014 Patriots were not very reliant on the ground team. Jonas Gray led the team in rushing yards with just 412 in 8 games, while Shane Vereen was second with 391 over the full season. Stevan Ridley had 340 in 6 games, while LeGarrette Blount had 281 in five appearances. Even as a team, New England only ranked 18th in rushing yards. And while Blount ran all over the Colts (30/148/3) in the AFC Championship Game, he was held to just 40 yards on 14 carries in the Super Bowl, which still managed to lead the team.

Among the now 110 teams to make the Super Bowl, the 2014 Patriots rank last when it comes to rushing yards gained by their leading rusher. The 1998 Broncos, of course, rank first: Terrell Davis rushed for 2,008 yards that season. The graph below shows the rushing yards (pro-rated to 16 game seasons for years with shorter schedules) for the leading rusher on each Super Bowl team: the winners are shown in black, the losers in green, and the Bucs and Chiefs are shown in team colors. [continue reading…]

{ 0 comments }

Let’s take a quick look at the point spread for the NFC East games today:

The Cowboys are 3.5 point home favorites against the Browns.
The Football Team are 14-point home dogs against the Ravens.
The Giants are 13.5-point underdogs in Los Angeles against the Rams.
The Eagles are 9-point road underdogs tonight in San Francisco.

Yes, indeed, Mr. Tanier is correct: the NFC East are underdogs of 33 or 33.5 points today (the Baltimore/Washington line has fluctuated between 14 and 14.5 points). That sounds like a lot. It is a lot. But how much of an outlier is that?

As it turns out, there has been just one week since 1978 (which is as far back as PFR’s points spread database goes back) where the collective points spread for Dallas, Washington, New York, and Philadelphia was worse: week 13 of the 1998 season. That was the week that Randy Moss had three 50+ yards touchdown catches on Thanksgiving against the Cowboys, Washington was 2-9 under Norv Turner but upset the Raiders, the Giants under Kent Graham were 13-point dogs against a high-powered 49ers team (and lost by 24), and the Eagles and Koy Detmer were 18-point dogs against the two-time defending NFC Champion Packers.

And that’s it. Week 4 of the 2020 season is the second-worst week in history, at least as far as perception relative to opponent goes, for this quartet of teams. [1]Note that I am not saying NFC East history, as I am excluding the Cardinals from this post. Here’s the average points spread over the course of each season since 1978 for the Giants, Cowboys, Eagles, and the WFTFKATR. Remember, when looking at point spreads, it’s the reverse of points differential: a positive number indicates a weaker team. [continue reading…]

References

References
1 Note that I am not saying NFC East history, as I am excluding the Cardinals from this post
{ 0 comments }

The Detroit Lions Had An Odd Season (In Vegas)

The Lions win the award for weirdest home/road pre-game splits.

On average, the 2019 Lions were underdogs each week by 4 to 4.5 points. Detroit was only favored to win three games, and was an underdog of more than a touchdown in five games. The team was not very good in the first half of the season (3-4-1), but things went particularly south once Matthew Stafford went down due to injury. The Lions went 0-8 in the second half of the season, with Jeff Driskel (0-3) and David Blough (0-5) splitting those starts.

But there’s something pretty unusual in those splits. In 8 home games, the Lions were underdogs by an average of 4.6 points. In 8 road games, the Lions were underdogs by an average of 3.9 points. Given that home field advantage is usually worth 3 points, you’d expect a team to be favored by about 6 more points — on average — in home games than in road games. But the 2019 Lions were actually favored to do better on the road than at home! That is exceedingly rare: it has only happened a handful of times in the last 40 years.

So, what happened? You might think this has something to do with Stafford, but that’s not really the case: he was healthy for 4 home and 4 road games. Here are the full season results: [continue reading…]

{ 0 comments }

Leading Rushers In Each Super Bowl

The last running back to win the Super Bowl MVP was Terrell Davis, which happened over 20 Super Bowls ago. One reason for that is a decline in big rushing games in the Super Bowl, particularly with respect to the winning team. Just once in the last 16 Super Bowls — Dominic Rhodes back in SuperBowl XLI — has the winning team had a 100-yard rusher. Perhaps more interesting is that in the last 9 Super Bowls, the losing team had the game’s leading rusher more than half the time.

The graph below shows the leading rusher for both the winning and losing teams in the Super Bowl. The winning team’s leading rusher is in a full black circle, while the losing team’s leading rusher is in a white circle with a black outline. In addition, in the 13 of 53 Super Bowls where the game’s leading rusher was on the losing team, I’ve put that in a white circle with a red outline. [continue reading…]

{ 0 comments }

Super Bowl History: Test Your Knowledge

Can you name the winner and loser from each Super Bowl?

How about the Super Bowl MVP? The final score? The points spread? The stadium?

Test your knowledge below, by filling in as much as you can. Answers appear after the jump.

YearWinnerLoserSpreadPts WPts LSBMVPBoxscoreStadium
1966
1967
1968
1969
1970
1971
1972
1973
1974
1975
1976
1977
1978
1979
1980
1981
1982
1983
1984
1985
1986
1987
1988
1989
1990
1991
1992
1993
1994
1995
1996
1997
1998
1999
2000
2001
2002
2003
2004
2005
2006
2007
2008
2009
2010
2011
2012
2013
2014
2015
2016
2017
2018

[continue reading…]

{ 0 comments }

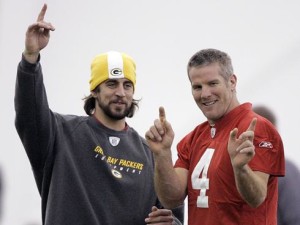
Can Rodgers erase Favre’s bad history?

In 2007, Aaron Rodgers was a third-year backup on the Green Bay Packers. In week 2 of that season, the Packers blew out the Giants, on the road, 35-13. Four months later, the Giants and Packers were playing in Green Bay in the 2007 NFC Championship Game.

Packers fans were confident: they were home, they were 7.5-point favorites, and they were facing a team they had defeated handily during the regular season. Unfortunately for them, the rematch went very differently: the Giants won, in overtime, 23-20.

But that game may give Rodgers and Packers fans something to point to as they prepare for the 2019 NFC Championship Game. Green Bay is headed to San Francisco, the site of a 37-8 49ers blowout in the regular season. San Francisco fans are confident: they are home, they are 7.5-point favorites, and they are facing a team they defeated handily during the regular season.

Of course, 49ers fans have positive examples to point to, as well. In fact, they have a lot of them, with Jimmy Garoppolo also having some experience he can point to as a backup. In 2014, Garoppolo was a rookie on the New England Patriots. In week 10 of that season, the Patriots blew out the Colts, 42-20, in Indianapolis, in a game best remembered for Jonas Gray hitting the national stage with 201 rushing yards and 4 touchdowns. The two teams would later meet in Foxboro in the 2014 AFC Championship Game. New England was a 7.0-point home favorite, and demolished the Colts even more convincingly. So much so that the 45-7 victory is mostly remembered now for the “Deflategate” controversy that surfaced after the game. [continue reading…]

{ 2 comments }

What Happens After The Blowout?

The Titans lose 59-0, falling to 0-6. And respond by winning 5 straight games.

In 2011, the Colts were the worst team in the NFL. During mid-season of the year that would be remembered as the ‘Suck 4 Luck’ campaign, Indianapolis reached its lowest moment on national television against the Saints. Facing the high powered New Orleans offense and Drew Brees, it was a mismatch from the opening gun: New Orleans won 62-7.

This was a very good Saints team — that win brought New Orleans to 5-2 — and if you were picking a team to win the next week, you probably would have picked the Saints. The Saints were favored by 14 points against the Rams, but were upset, 31-21.

In 2014, the Matt Ryan-led Atlanta Falcons dominated the Bucs in a Thursday Night massacre. Atlanta won 56-14 in a game where the victors produced a record Game Script of 32.6! At 2-1, Atlanta looked like a team on the rise, but the Falcons lost in Minnesota the next week as 3-point favorites.

It feels inconceivable that a team could look so good one week and lose the next. And even more common is the team on the losing end of a humiliating loss turning things around immediately.

In recent years, the three worst blowouts were the Rams crushing the Raiders 52-0 in 2014, the Falcons demolition against the Bucs described above, and a 58-0 win by Seattle against the Cardinals. The very next week, Oakland, Tampa Bay, and Arizona not only all won, but all won as touchdown underdogs!

My favorite example comes from the 1983 Oilers. In 1982, Houston was terrible, going 1-8. They opened the ’83 season with 9 straight losses, and in the 10th game, lost to the Bengals 55-14 and trailed 48-0 after three quarters. And yet, the next week, as 6-point home underdogs, the Oilers won for just the second time in 20 games.

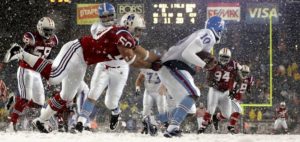
Okay, one more favorite example. In 2009, the Patriots destroyed the Titans, 59-0, on a snow-covered field in Foxboro. Tennessee dropped to 0-6 after the game, and switched quarterbacks from Kerry Collins to backup Vince Young. The Titans responded by winning five straight games!

In week 1, the Ravens dominated a Miami team that most assume is tanking. Baltimore finished the game with a remarkable +30.0 Game Script, qualifying by any measure as one of the biggest blowouts in recent memory. And while our eyes say Baltimore (a 13.5-point favorite at home against Arizona) and Miami (a 19-point underdog at home against the Patriots) will have similar performances in week two, history says we should exercise some caution in our projections. [continue reading…]

{ 1 comment }

Trivia: Marty Schottenheimer, Andy Reid, or Both?

Below are 17 questions, where the answer to each question is Marty Schottenheimer, Andy Reid, or both. All stats are through 2018 and regular season only, unless expressly noted otherwise.

Post your score in the comments! The honor system will be strictly enforced.

1. Which coach won more games?

Click 'Show' For Answer Show

2. Which coach has a better career winning percentage?

Click 'Show' For Answer Show

3. Which coach won more division titles?

Click 'Show' For Answer Show

4. The best regular season of this coach’s career was followed by a playoff loss to Bill Belichick, Tom Brady, and the Patriots.

Click 'Show' For Answer Show

5. This coach employed three minority assistants who would later become head coaches for the first time.

Click 'Show' For Answer Show

6. This coach only missed the postseason 6 times.

Click 'Show' For Answer Show

7. Which coach won the AP Coach of the Year award most recently?

Click 'Show' For Answer Show

8. Which coach won the most coaching awards from major sources other than the AP?

Click 'Show' For Answer Show

9. Which coach employed more guys who would go on to win Super Bowls as head coaches?

Click 'Show' For Answer Show

10. Which coach lost in the playoffs three times to the same legendary coach/quarterback combination?

Click 'Show' For Answer Show

11. Which coach lost to the same Hall of Fame quarterback in the playoffs with two separate coaches?

Click 'Show' For Answer Show

12. Which coach had their teams finish in the top 3 in points scored more often?

Click 'Show' For Answer Show

13. Which coach had their teams finish in the top 3 in points allowed more often?

Click 'Show' For Answer Show

14. Which coach lost a heartbreaker to the Colts in the playoffs, but not with Peyton Manning at quarterback?

Click 'Show' For Answer Show

15. Which coach had more individual quarterbacks win at least 8 games in a season?

Click 'Show' For Answer Show

16. Which coach lost more often to the eventual Super Bowl Champion in the playoffs?

Click 'Show' For Answer Show

17. Which coach has a better winning percentage with the Chiefs in the postseason?

Click 'Show' For Answer Show

How did you do?

{ 0 comments }

Trivia: Steve Young, Aaron Rodgers, or Tie?

Below are 31 questions, where the answer to each question is Steve Young, Aaron Rodgers, or tie. All stats are through 2018 and regular season only, unless expressly noted otherwise.

Post your score in the comments! The honor system will be strictly enforced.

1. Which quarterback won more games?

Click 'Show' For Answer Show

2. Which quarterback has a higher career winning percentage?

Click 'Show' For Answer Show

3. Which quarterback won the most Super Bowls as a starter?

Click 'Show' For Answer Show

4. Which quarterback won the most AP MVP awards?

Click 'Show' For Answer Show

5. Which quarterback earned the most 1st-team All-Pro selections from the Associated Press?

Click 'Show' For Answer Show

6. Which quarterback made the most Pro Bowls?

Click 'Show' For Answer Show

7. Which quarterback led the league in completion percentage most often?

Click 'Show' For Answer Show

8. Which quarterback led the league in TD/INT ratio most often?

Click 'Show' For Answer Show

9. Which quarterback led the league in passer rating most often?

Click 'Show' For Answer Show

10. Which quarterback led the league in ANY/A most often?

Click 'Show' For Answer Show

11. Which quarterback led the league in Passing Touchdowns most often?

Click 'Show' For Answer Show

12. Which quarterback had fewer (i.e., a better amount of) fumbles?

Click 'Show' For Answer Show

13. Which quarterback had more rushing TDs?

Click 'Show' For Answer Show

14. Which quarterback had more rushing yards?

Click 'Show' For Answer Show

15. Which quarterback had more rushing yards per carry?

Click 'Show' For Answer Show

The next set of questions cover the statistics produced by each quarterback relative to the other passers of his era. For Young, this looks at the 32 quarterbacks with the most pass attempts from 1985 to 1999; for Rodgers, the sample size is the 32 quarterbacks with the most pass attempts from 2005 to 2018.

16. Which quarterback ranks higher in ANY/A?

Click 'Show' For Answer Show

17. Which quarterback ranks higher in passer rating?

Click 'Show' For Answer Show

18. Which quarterback ranks higher in TD percentage?

Click 'Show' For Answer Show

19. Which quarterback ranks better (i.e., lower) in INT percentage?

Click 'Show' For Answer Show

20. Which quarterback ranks higher in Yards/Attempt?

Click 'Show' For Answer Show

21. Which quarterback ranks higher in 4th Quarter Comebacks?

Click 'Show' For Answer Show

22. Which quarterback ranks higher in Game Winning Drives?

Click 'Show' For Answer Show

23. Which quarterback had a better (i.e., lower) rank in sack rate?

Click 'Show' For Answer Show

24. Which quarterback ranked better TD/INT ratio?

Click 'Show' For Answer Show

25. Which quarterback ranked better in Yards/Completion?

Click 'Show' For Answer Show

Finally, let’s get to some playoff numbers. Which, like everything else here, isn’t easy.

26. Which quarterback won more playoff games?

Click 'Show' For Answer Show

27. Which quarterback had a better playoff winning percentage?

Click 'Show' For Answer Show

The next set of questions look at the quarterbacks with the 15 most pass attempts from ’87 to ’98 (for Young) and ’07 to ’16 (for Rodgers) in playoff games:

28. Which quarterback ranks better in Yards/Attempt?

Click 'Show' For Answer Show

29. Which quarterback ranks better in Passer Rating?

Click 'Show' For Answer Show

30. Which quarterback ranks better in rushing yards in the playoffs?

Click 'Show' For Answer Show

31. Which quarterback ranks better in playoff ANY/A?

Click 'Show' For Answer Show

How did you do?

{ 0 comments }

Cooks had a bad time in last year’s Super Bowl. Either he or the Patriots will repeat that fate this Sunday.

Wide receiver Brandin Cooks was in the Super Bowl last year with the Patriots, when New England was upset by the Eagles.  He was traded from New England to the Rams this offseason, and now his current team is up against his former team in Super Bowl LIII.  If the favorites win this time around, Cooks will have joined an exclusive club by playing in back-to-back Super Bowls with different teams… and losing both times.  And an even more exclusive club by starting in both games.

There are 8 players who have “ties” to the teams that lost in back to back Super Bowls (when they were different franchises).  Three of them have just loose ties: WR Kevin Norwood was on the 2014 Seahawks and also the 2015 Panthers for a game, but he did not make Carolina’s postseason roster. DB Anthony Madison was on the ’09 Colts roster for a hot minute, in between stints on the 2008 and 2010 Steelers. And WR Johnnie Barnes was on the ’94 Chargers (although he was inactive for the Super Bowl) and also the ’95 Steelers, but he was played on injured reserve in midseason.

Three other players were actually on the teams that made it to both Super Bowls, but did not actually play in both games.

  • TE Stephen Spach was a reserve on the 2007 Patriots and also the 2008 Cardinals. He was inactive in the Patriots/Giants Super Bowl, and tore his ACL in Arizona’s playoff win against Carolina, and was played on injured reserve before the NFC Championship Game that season.
  • QB Gale Gilbert made it to 5 straight Super Bowls with the ’90s Bills and then the ’94 Chargers. He was inactive for most of them, although he did make an appearance in the Chargers/49ers Super Bowl. Since he was on the roster for both games, I am including him here.
  • DT John Parrella was also on the ’93 Bills (inactive in the Super Bowl) and ’94 Chargers (active).

And that leaves just two players to actually play in and lose back-to-back Super Bowls with different teams. [continue reading…]

{ 1 comment }

The engineers driving football’s best offense

The 2018 Kansas City Chiefs had a remarkable offense.  Behind head coach Andy Reid and quarterback and MVP Patrick Mahomes, the Chiefs led the NFL in scoring with 565 points.  Kansas City joined the 2007 Patriots and 2013 Broncos as the only teams with 50+ passing touchdowns and 15+ rushing touchdowns, as the Chiefs scored a whopping 66 offensive touchdowns (and 5 more on defense/special teams).  But Kansas City’s offensive skill position players were not highly drafted, and that makes the Chiefs a pretty notable case.

A lot of great offenses are driven, unsurprisingly, by highly drafted skill position players. The 2007 Patriots had Randy Moss (1st round), and then Ben Watson (1st), Laurence Maroney (1st) and Jabar Gaffney (2nd) to go along with undrafted Wes Welker.

The Greatest Show On Turf Rams had high 1st round picks in Marshall Faulk and Torry Holt, along with #33 overall pick Isaac Bruce.

The Colts for much of the Peyton Manning era had 1st round picks in Marvin Harrison, Reggie Wayne, Edgerrin James, and Dallas Clark. And Manning’s 2013 Broncos had 5 players with double digit TDs: first round picks in Demaryius Thomas and Knowshon Moreno, and later picks in Julius Thomas (4th round), Eric Decker (3rd round), and undrafted Wes Welker.

The 1998 49ers had 1st round picks in Garrison Hearst, Jerry Rice, and J.J. Stokes. The ’94 49ers had Jerry Rice, Ricky Watters, Steve Young, and William Floyd. And the list goes on and on.

But there are some teams that the overwhelming majority of touchdowns came from 3rd round picks or later. For example, the 1984 Dolphins had Mark Clayton (18 TDs, 8th round), Woody Bennett (8 TDs, undrafted), Nat Moore (6 TDs, 3rd round) and Bruce Hardy (5 TDs, 9th round). Only Pete Johnson (9 TDs, 2nd round) and Mark Duper (8 TDs, 2nd round) were higher picks, among the team’s leading scorers.

The 2011 Saints top four leaders in touchdowns were Jimmy Graham (3rd round), Darren Sproles (4th), Marques Colston (7th), and Lance Moore (undrafted). The next four players were Pierre Thomas (undrafted), Robert Meachem (1st round), Mark Ingram (1st round), and Jed Collins (undrafted).

Still, the 2018 Chiefs stand out from this pack, at least if you group together all players taken in the 3rd round or later. [1]By the Jimmy Johnson Draft Value Chart, 83% of all draft value resides in the top 64 picks. Even in my draft value chart, which is more representative of actual value rather than trade value, 63% of … Continue reading A whopping 92% of Kansas City touchdowns came from such players, an almost unheard of margin for an elite offense. Take a look: [continue reading…]

References

References
1 By the Jimmy Johnson Draft Value Chart, 83% of all draft value resides in the top 64 picks. Even in my draft value chart, which is more representative of actual value rather than trade value, 63% of draft value comes from the top 64 picks.
{ 0 comments }

Aaron Rodgers On Pace To Set Interception Record

Aaron Rodgers has thrown just one interception in 10 games this year. That’s 1 interception on a league-high 385 pass attempts. And this was it:

Damon Huard (2006) holds the current record for interception rate in a season at 0.4%; he threw 1 interception on 244 passes, so to beat him, a quarterback would need to either throw no interceptions and 224 passes (to qualify), 1 interception on more than 244 passes, 2 interceptions on more than 488 passes, or 3 interceptions on more than 672 passes. Rodgers has 1 interception so far this year on 385 pass attempts (0.26%!); he has room to throw one more interception this year and still win the crown, but he probably doesn’t have wiggle room to throw two more.

Josh McCown (2013) had 1 interception on 224 pass attempts (0.4%), putting him second all-time on the single-season list. Tom Brady (2016), Nick Foles (2013), Tom Brady (2010), Dak Prescott (2016), Steve DeBerg (1990), Sam Bradford (2016), and David Garrard (2007) are the only other players to throw fewer than 1 interception for every 100 passes in a season, min 14 pass attempts per team game. (Oh, and Drew Brees has a 0.3% interception rate this year, too: he has 1 interception on 304 passes).

Interceptions rates have plummeted, of course, so it’s hard to truly compare this season by Rodgers to some of the low interceptions of years past. Here’s the league average interception rate in every season since 1970:

Another thing that makes Rodgers’ 2018 interception rate so interesting, particularly compared to Brees, is that Rodgers has thrown a lot of incomplete passes. In fact, he’s thrown more than twice as many incomplete passes as Brees — 147 to 69. The graph below shows every player this season with an interception (no regular quarterback has zero interceptions). The X-Axis shows interceptions; the Y-Axis shows incomplete passes. Rodgers really stands out here, and while you didn’t need the help finding him, I colored his dot in Packers colors:

Rodgers is tied with Joe Flacco for the league lead in incomplete passes at 147, and yet he is also tied with Brees for the fewest interceptions among qualifying passers. That’s how extreme Rodgers has been this year. Consider that Rodgers has thrown an interception on just 0.7% of his incomplete passes; Brees ranks second with an interception on 1.4% of his passes, and nobody else has thrown an interception on fewer than 2.8% of interceptions. Huard in 2006 (1.0%) currently has the record for interception rate on incomplete passes, and that’s another mark Rodgers has in his sights.

It’s been an up-and-down year for Rodgers. For example:

  • His winning percentage is below .500, the worst of his career since his first year as a starter in 2008.
  • His touchdown rate is below 5.0% for the first time in his career.
  • His completion percentage is 62%, the second lowest of his career.

On the other hand, his sack rate is slightly better than his (not very good) career average, his yards/attempt is slightly better than (his remarkably good) career average, he’s averaging more passing yards/game than any season other than 2011, and he’s posting by far the best interception rate of his career, which has been littered with remarkable interception rates.

Rodgers entered the season with a remarkable TD/INT ratio, and it’s only gotten better.  He’s now at 4.20/1, easily the best in history (only Brady and Russell Wilson — both are at 3.02 to 1 — have more than 3 touchdown passes for every interception).  And while it’s been a rough year for Rodgers, he’s in position to set a new record in 2018.

{ 1 comment }

Danielle Hunter Is Remarkable

Vikings defense end Danielle Hunter has recorded a sack in every game this season, making him just the 8th player since 1982 to record a sack in each of his team’s first 8 games:

 
Rk Year Tm W L T W-L% Count
1 William Fuller 1994 PHI 5 2 0 0.714 7
2 Shaun Ellis 2003 NYJ 2 5 0 0.286 7
3 Robert Mathis 2005 IND 7 0 0 1.000 7
4 DeMarcus Ware 2008 DAL 4 3 0 0.571 7
5 Dwight Freeney 2009 IND 7 0 0 1.000 7
6 Demarcus Lawrence 2017 DAL 4 3 0 0.571 7
7 Everson Griffen 2017 MIN 5 2 0 0.714 7
8 Danielle Hunter 2018 MIN 4 2 1 0.714 7

[continue reading…]

{ 1 comment }

Back-To-Back Long Winning/Losing Streaks

In 2017, the Houston Texans lost their final six games of the season. Tom Savage started the first of those three games, with T.J. Yates starting the final three. This year, with Deshaun Watson back from injury, the Texans… lost their first three games of the season. So entering week 4, Houston was on a 9-game losing streak. Since then? Houston has won four straight, and with a home game against the Dolphins tonight, have a good chance of running that winning streak to five straight. With a win in Denver next week, the Texans would have followed a streak of 6+ straight losses by, immediately, winning 6+ straight games.

That’s pretty rare: only six teams have ever strung together back to back streaks of 6+ wins and 6+ losses. And if Houston runs the streak to 9 straight wins, the Texans would be the first team to ever have back-to-back 9-game streaks.

The longest streak? That belongs to the San Diego Chargers. In 1987, the Chargers lost the season opener, but responded by winning 8 consecutive games (including three with replacement players). And then San Diego promptly lost 8 straight games, marking the only time a team has ever had back-to-back 8-game winning/losing streaks. For those curious, a 36-year-old Dan Fouts was the starter for 5 of the games during the winning streak, and four of the games during the losing streak, which stretched into 1988.

Just two other times has a team had a 6+ game winning streak followed by a 6+ game losing streak. In 1977, the Don Coryell Cardinals began the season 1-3 before Jim Hart and crew went on a 6-game winning streak, bringing St. Louis’s record to 7-3. From that point on, the Cardinals lost their final four games of the regular season and the team’s first eight games of 1978 under Bud Wilkinson.

Finally, the 2001 Rams under Kurt Warner won their final six regular season games, plus the team’s two NFC playoff games, allowing St. Louis to enter the Super Bowl on an 8-game winning streak. The Rams lost to the Patriots in the Super Bowl, of course, and then began the 2002 season on a 5-game losing streak, with Warner the starter for all but the final game. And at 0-5, the Rams responded with a 5-game winning streak, then under Marc Bulger!

What about teams like the Texans, who followed long losing streaks with long winning streaks? There are just three of those teams, using 6-game minimums.

In 1970, the Cincinnati Bengals had one of the more interesting seasons in NFL history.  With Paul Brown and Bill Walsh as offensive masterminds, the Bengals found a gem in Greg Cook to be the team’s quarterback in 1969.  Unfortunately, Cook suffered what would be a career-limiting injury, and the Bengals brass turned the ball over to Virgil Carter.  You know the story from there, as Carter, Walsh, and Brown helped usher the West Coast Offense into the NFL.  After winning the team’s opener, Cincinnati lost 6 straight games, before going on a 7-game winning streak to end the regular season.  The Bengals lost the team’s only playoff game.

In 1994, the New York Giants began the season 3-0, then lost 7 straight games, and then won the team’s final 6 games. Dave Brown was the team’s quarterback for all but one game.

Finally, we have the 1974 Jets, with a 31-year-old Joe Namath who managed to play every game that season.  New York lost its first game, won its second game, and then won on a 6-game losing streak followed by a 6-game winning streak to end the season.  From weeks 3 through 8, the Jets ranked 25th in passer rating and 17th in Net Yards per Attempt; during the final six weeks, the Jets ranked 3rd in passer rating and 3rd in NY/A.

{ 0 comments }

Jets running back Isaiah Crowell had a remarkable game on Sunday against the Broncos. He made the most of his 15 carries, producing a 77-yard rushing touchdown, along with carries of 54, 36 and 15 yards. He finished the day with 219 rushing yards, setting a new Jets franchise rushing record in the process.

Do you know what else he did? He averaged 14.33 yards per carry, the highest single-game YPC average by any player in history with at least 15 carries. That made me wonder: what are the highest single-game yards per carry averages at all carry levels?

Joey Galloway holds the record for yards per carry in a game, at 86.0. He did that on one carry, as you could probably guess (and what a carry it was). Up the minimum threshold to 2 or more carries, and Brian Mitchell is your record-holder: he averaged 52.2 yards per carry on 2 carries for 105 yards. At 3+ carries, Cordarrelle Patterson was the record-holder, with a 3-102-34.3 performance … until Browns running back Nick Chubb broke that mark in week 4 of this season against the Raiders with 3 carries for 105 yards.  At 4+ carries, Latavius Murray holds the record with a 28 yards per carry average.  And so on. [continue reading…]

{ 1 comment }

Weekend Trivia: Leaders in Pass Attempts

In 2017, Tom Brady led the NFL in pass attempts while playing for the 13-3 (0.813) Patriots. Since 1950, there have been just three quarterbacks to lead the league (combining the AFL and NFL) in pass attempts while playing for a team with a winning percentage of 0.813 or better. Can you name them?

Trivia hint 1 Show


Trivia hint 2 Show


Trivia hint 3 Show
[continue reading…]

{ 0 comments }

The Cleveland Browns own the #1 and #4 selections in the 2017 Draft. Assuming the Browns don’t trade down, it means the franchise would be the first team to own two top-5 picks in the Draft since…. well, do you know?

Trivia hint 1 Show


Trivia hint 2 Show


Trivia hint 3 Show
[continue reading…]

{ 0 comments }

Super Bowl LII  was notable for a bunch of reasons, including as one of the best offensive games ever. One reason the game was so exciting: there were not only a ton of scores — 14 in total — but no real scoring streaks.

In most games, three consecutive scores all come from the same team. But not so in Super Bowl LII, neither the Eagles nor the Patriots scored three straight times. I’m defining a score, of course, as a touchdown, field goal, or safety, and not counting extra points or two point conversions as separate scoring plays.

At least one team was responsible for three consecutive scores in 36 of the first 51 Super Bowls. Only in the 2007 Patriots/Giants Super Bowl did both teams fail to score twice in a row — that is, the teams alternated scores throughout the game — so the 2017 Patriots/Eagles game was the 15th Super Bowl where the longest scoring streak was stopped at two scores. What makes that remarkable is how there were 14 scores altogether, the most in Super Bowl history (the Pats/Giants Super Bowl had 5, by way of reference). Take a look at the chart below, which shows the longest scoring streak and the number of scoring plays in each Super Bowl: [continue reading…]

{ 42 comments }

Running back Duke Johnson, a 3rd round pick from the University of Miami in 2015, currently leads the Browns in receiving yards.

No. Player Age Pos G GS Tgt Rec Yds
Y/R TD R/G Y/G Ctch%
29 Duke Johnson 24 12 0 69 52 456 8.8 2 4.3 38.0 75.4%
87 Seth Devalve 24 te 12 4 46 26 335 12.9 1 2.2 27.9 56.5%
85 David Njoku 21 te 12 2 49 28 332 11.9 4 2.3 27.7 57.1%
80 Ricardo Louis 23 WR 12 9 57 26 322 12.4 0 2.2 26.8 45.6%
18 Kenny Britt 29 wr 9 4 38 18 233 12.9 2 2.0 25.9 47.4%
81 Rashard Higgins 23 wr 11 3 40 20 214 10.7 0 1.8 19.5 50.0%
19 Corey Coleman 23 rt/wr 6 6 36 15 206 13.7 1 2.5 34.3 41.7%
34 Isaiah Crowell 24 RB 12 12 30 20 180 9.0 0 1.7 15.0 66.7%
12 Josh Gordon 26 wr 1 1 11 4 85 21.3 0 4.0 85.0 36.4%
82 Kasen Williams 25 wr 7 2 18 9 84 9.3 0 1.3 12.0 50.0%
11 Bryce Treggs 23 wr 6 1 18 5 79 15.8 0 0.8 13.2 27.8%
10 Sammie Coates 24 wr 8 1 10 5 62 12.4 0 0.6 7.8 50.0%
27 Matthew Dayes 23 12 0 5 4 29 7.3 0 0.3 2.4 80.0%
11 Jordan Leslie 26 2 0 1 1 26 26.0 0 0.5 13.0 100.0%
86 Randall Telfer 25 TE 12 11 2 2 24 12.0 0 0.2 2.0 100.0%
40 Dan Vitale 24 fb 12 4 4 2 18 9.0 0 0.2 1.5 50.0%
70 Kevin Zeitler 27 RG 12 12 1 1 -4 -4.0 0 0.1 -0.3 100.0%
Team Total 24.6 12 435 238 2681 11.3 10 19.8 223.4
Opp Total 12 262 2764 10.5 23 21.8 230.3

Suffice it to say, that’s not a good thing, at least in this case. The Browns rank last in ANY/A at 3.5 and last in passer rating at 59.8; Cleveland has the worst passing attack in the NFL, and the fact that Johnson is the team’s leading receiver probably speaks to that.

It’s also pretty rare. Excluding guys like Eric Metcalf or who played running back at times but wasn’t a running back in say, the 1995 Falcons, it’s only happened twice since 2000. Two years ago, with Keenan Allen limited to 8 games and Antonio Gates to 11, Danny Woodhead led the Chargers in receiving yards. And for the 2013 Chiefs, Jamaal Charles somehow led the team in rushing and receiving yards (something neither Johnson nor Woodhead did) as Dwayne Bowe and Donnie Avery fought for table scraps.

The table below shows every running back to lead his team in receiving yards since 1970: [continue reading…]

{ 8 comments }

Here’s a look at the 2017 rushing leaders for the Seattle Seahawks:

No. Player Age Pos G GS Att Yds
TD Lng Y/A Y/G A/G
3 Russell Wilson 29 QB 12 12 71 432 3 29 6.1 36.0 5.9
32 Chris Carson 23 rb 4 3 49 208 0 30 4.2 52.0 12.3
27 Eddie Lacy 26 rb 9 3 69 179 0 19 2.6 19.9 7.7
21 J.D. McKissic 24 rb 9 1 33 143 1 30 4.3 15.9 3.7
34 Thomas Rawls 24 rb 9 3 50 129 0 23 2.6 14.3 5.6
39 Mike Davis 25 rb 2 2 22 82 0 22 3.7 41.0 11.0
16 Tyler Lockett 25 WR 12 7 8 46 0 22 5.8 3.8 0.7
22 C.J. Prosise 23  rb 5 0 11 23 0 8 2.1 4.6 2.2
Team Total 26.3 12 316 1233 4 30 3.9 102.8 26.3

You might have noticed that quarterback Russell Wilson actually leads the team in rushing yards.  Which is… pretty unusual.  Excluding situations when players who didn’t enter the NFL as a running back but played that position (like Ty Montgomery or Denard Robinson), only twice in the last 20 years has a non-RB led his team in rushing yards.  Do you know who and when?

Show


Before them, the last player was Randall Cunningham – who did it for the 1987, 1988, 1989, and 1990 Eagles. The only other time since the merger that a non-RB has led his team in rushing yards was Bears quarterback Bobby Douglass in 1972.

And before Douglass, you have to go back to 1960, when Lenny Moore led the Colts in rushing yards the year after moving to wide receiver (he still actually led the team in carries, too, but Alan Ameche was the fullback and Alex Hawkins was the running back; Moore finished with 936 receiving yards and 374 rushing yards). Also that year, Jets (well, Titans) quarterback Al Dorow led the expansion franchise in rushing yards.

Positional designations get a little tricky pre-1960, but a few other quarterbacks pulled off the feat in the ’50s. Tobin Rote led the Lions in rushing in 1958, and the Packers in rushing in 1951, 1952, and 1956. Charley Trippi led the Cardinals in rushing in 1951 and 1952, although the 1952 Cardinals had the greatest four-way race for a franchise rushing title you’ll ever see.

This is a long way of saying it’s going to be pretty noteworthy if Wilson leads the Seahawks in rushing, which seems very likely to happen.

{ 9 comments }

One of the best champions in Cleveland sports history.

The Cleveland Cavaliers and Golden State Warriors are facing off in the NBA Finals for the third straight season. That’s never happened before in NBA history, and it only happened once in pro football history… and it also involved Cleveland.

In 1952, the Browns won the American with an 8-4 record, while the Detroit Lions won the National division with a 9-3 record (after defeating the defending-champion Rams in the National tiebreaker game). Otto Graham and Bobby Layne were the two top quarterbacks in the NFL that year according to both the AP and the NY Daily News. Detroit traveled to Cleveland on December 28th and defeated the Browns 17-7, with Doak Walker’s 67-yard touchdown providing the biggest blow.

The next season, Graham had a season for the ages by any measure.  You’d be hard-pressed to argue for a better regular season by any quarterback from World War II to 1983, when a Graham-led Browns passing game finished with a Relative ANY/A of +5.00.  The Browns began the 12-game season with 11 straight wins, while Detroit finished 10-2 with both losses coming against the 8-3-1 Rams.  Cleveland lost the season finale in Philadelphia, and then traveled to Detroit for an NFL Championship rematch.

The Browns and Lions were tied 10-10 after three quarters, and Cleveland was up 16-10 late in the game.  But in the final minutes, Layne found an unlikely hero in Jim Doran for a 33-yard game-winning touchdown (video here), with Walker’s extra point providing the margin of victory. The bigger story? Graham having one of the chokiest games in football history, finishing with 2 of 15 for 20 yards with 2 interceptions. [continue reading…]

{ 15 comments }

The Jay Schroeder Index

Yesterday, I looked at the quarterbacks who were the biggest checkdown artists: i.e., which players had the best completion percentages and lowest yards per completion averages. I measured this by calculating how many standard deviations above/below average each quarterback was in those two categories in each year.

Today, the reverse. And the big winner is rookie Terry Bradshaw. We all know Bradshaw stunk as a rookie. He had a whopping 11.0% interception rate, which was horrible even for 1970. In fact, he has the second most attempts in history by a player with an 11% or worse interception rate. And since Bradshaw also ranked dead last in completion percentage, he ranked 2nd to last in ANY/A that year.

Of course, you might wonder: how could someone with the worst completion percentage and by far the worst interception rate not rank last (by a mile) in ANY/A? Well, it’s because Bradshaw ranked 2nd in the NFL in yards per completion as a rookie. He was your ultimate boom/bust passer, finishing 2.75 standard deviations below average in completion percentage and 2.18 standard deviations above average in yards per completion.

The top of the list features a bunch of interesting names, but I’m calling this the Jay Schroeder Index for a reason.  Schroeder only had 8 seasons where he threw at least 200 passes, but he makes the top 200 in 6 of those 8 seasons!  Schroeder made the list in ’86, ’87, and ’88 (despite moving from the Redskins to the Raiders this year), and then in ’90, ’91, and ’92.  He only missed the list in 1989 during this run, and that’s because he threw just 194 passes.  But in 1989, of the 34 quarterbacks with at least 150 pass attempts, Schroeder had the lowest completion percentage (46.9%) and by far the highest yards per completion average (17.0, the best of his career).  In other words, Schroeder had a top-200 season in 6 out of 7 straight years, with the lone exception being perhaps his most Schroeder-esque season! Of course, Schroeder’s love of the deep ball isn’t new to readers of this site.

The table below shows the top 200 seasons based on the Schroeder Index, using the same formula as yesterday: [continue reading…]

{ 24 comments }

As it turns out, drafting Mark Sanchez brings with it a form of Draft PTSD. Since selecting the USC quarterback with the 5th overall pick in the 2009 NFL Draft, the Jets have used 8 consecutive picks on defensive players.  That includes four busts (Wilson, Coples, Milliner), two hits (Wilkerson, Richardson), and three players where it’s probably still too early to evaluate.  Richardson has been great at times, but has also been frustrating on and off the field; in any event, his tenure with the team is likely coming to an end soon.  Pryor and Lee are still works in process, so it’s been mostly a mixed bag for the Jets over the last seven years:

Drafted Players Table
Rk Year Rnd Pick Pos DrAge From To AP1 PB St CarAV G GS Int Sk College/Univ
1 2016 1 20 Darron Lee OLB 21 2016 2016 0 0 1 4 13 9 1 Ohio St. College Stats
2 2015 1 6 Leonard Williams DE 21 2015 2016 0 1 1 19 32 31 10 USC College Stats
3 2014 1 18 Calvin Pryor DB 22 2014 2016 0 0 3 14 44 38 2 0.5 Louisville College Stats
4 2013 1 9 Dee Milliner DB 21 2013 2015 0 0 1 6 21 14 3 Alabama College Stats
5 2013 1 13 Sheldon Richardson DT 22 2013 2016 0 1 2 26 58 55 18 Missouri College Stats
6 2012 1 16 Quinton Coples DE 22 2012 2015 0 0 2 20 62 32 16.5 North Carolina College Stats
7 2011 1 30 Muhammad Wilkerson DT 21 2011 2016 0 1 5 60 92 89 1 41 Temple College Stats
8 2010 1 29 Kyle Wilson DB 23 2010 2015 0 0 1 15 95 32 4 1 Boise St. College Stats

Will that streak end tonight? If not, the Jets will set a record by becoming the first team to use 9 consecutive draft picks on players on one side of the ball. Right now, New York shares the distinction with three other franchises who have used eight consecutive first round picks in the NFL draft on efforts to rebuild one side of the ball. [continue reading…]

{ 4 comments }

In 22 team games in the 2016 playoffs, just four times did a rusher crack the 100-yard mark — or even exceed 75 rushing yards.  In the Patriots three wins, their leading rusher never cracked 50 yards, and James White was three yards away in the Super Bowl from giving New England three different leading rushers in three games.

Rushing
Rk Date Tm Opp Result G# Week Att Yds
Y/A TD
1 Le’Veon Bell 2017-01-15 PIT @ KAN W 18-16 18 19 30 170 5.67 0
2 Le’Veon Bell 2017-01-08 PIT MIA W 30-12 17 18 29 167 5.76 2
3 Thomas Rawls 2017-01-07 SEA DET W 26-6 17 18 27 161 5.96 1
4 Ezekiel Elliott 2017-01-15 DAL GNB L 31-34 17 19 22 125 5.68 0
5 Devonta Freeman 2017-02-05 ATL NWE L 28-34 19 21 11 75 6.82 1
6 Lamar Miller 2017-01-14 HOU @ NWE L 16-34 18 19 19 74 3.89 0
7 Lamar Miller 2017-01-07 HOU OAK W 27-14 17 18 31 73 2.35 1
8 Tevin Coleman 2017-01-14 ATL SEA W 36-20 17 19 11 57 5.18 0
9 Russell Wilson 2017-01-14 SEA @ ATL L 20-36 18 19 6 49 8.17 0
10 LeGarrette Blount 2017-01-22 NWE PIT W 36-17 18 20 16 47 2.94 1
11 Christine Michael 2017-01-08 GNB NYG W 38-13 17 18 10 47 4.70 0
12 Ty Montgomery 2017-01-15 GNB @ DAL W 34-31 18 19 11 47 4.27 2
13 Aaron Rodgers 2017-01-22 GNB @ ATL L 21-44 19 20 4 46 11.50 0
14 Devonta Freeman 2017-01-14 ATL SEA W 36-20 17 19 14 45 3.21 1
15 Devonta Freeman 2017-01-22 ATL GNB W 44-21 18 20 14 42 3.00 0
16 Dion Lewis 2017-01-14 NWE HOU W 34-16 17 19 13 41 3.15 1
17 Latavius Murray 2017-01-07 OAK @ HOU L 14-27 17 18 12 39 3.25 1
18 Spencer Ware 2017-01-15 KAN PIT L 16-18 17 19 8 35 4.38 1
19 Thomas Rawls 2017-01-14 SEA @ ATL L 20-36 18 19 11 34 3.09 0
20 DeAngelo Williams 2017-01-22 PIT @ NWE L 17-36 19 20 14 34 2.43 1
21 Zach Zenner 2017-01-07 DET @ SEA L 6-26 17 18 11 34 3.09 0
22 Jay Ajayi 2017-01-08 MIA @ PIT L 12-30 17 18 16 33 2.06 0
23 LeGarrette Blount 2017-01-14 NWE HOU W 34-16 17 19 8 31 3.88 0
24 LeGarrette Blount 2017-02-05 NWE @ ATL W 34-28 19 21 11 31 2.82 0
25 Jonathan Grimes 2017-01-07 HOU OAK W 27-14 17 18 4 30 7.50 0
26 Paul Perkins 2017-01-08 NYG @ GNB L 13-38 17 18 10 30 3.00 0

White’s Super Bowl heroics aside — you know, he scored a record 20 points and caught a record 14 passes — New England certainly didn’t get much production from the ground game in the playoffs. Even as a team, the Patriots averaged only 86.3 yards per game in the postseason. Among the 51 Super Bowl champions, that slots in just between two other Patriots teams, giving New England three of the four Super Bowl champions that failed to crack the 90 rushing yards mark in the playoffs. But one team averaged just 37 rushing yards per game in the postseason. Can you guess? Scroll to the bottom of the table to see. [continue reading…]

{ 1 comment }

Bill Belichick and the Patriots won their fifth Super Bowl on Sunday. For a number of reasons, that brings up some good trivia tidbits.

Most Championships

Belichick, of course, is now the only coach with five Super Bowl rings. However, three other coaches have won more titles. Paul Brown won 7 championships, although only three NFL titles (the remaining four were in the AAFC). George Halas and Curly Lambeau each won 6 NFL titles, while Belichick is now tied with Vince Lombardi at five.

Oldest Coach

Belichick is 64 years old, making him the third oldest head coach to win it all. In 2011, Tom Coughlin and the Giants beat Belichick’s Patriots in the Super Bowl, and Coughlin was 65 years old that season. George Halas won his final title in 1963, at the age of 68. Meanwhile, Dick Vermeil was 63 years old when he won the Super Bowl with the Rams to conclude the 1999 season.

Longest Run Between Titles

Belichick’s first title came in 2001, which means he’s now won championships 15 years apart. That’s tied with Curly Lambeau for the third longest stretch: Lambeau won his first championship in 1929, and his last in 1944, with both coming with the Packers. Jimmy Conzelman won as head coach of the Providence Steam Roller in 1928 and then 19 years later with the Chicago Cardinals in 1947. The longest reign, of course, goes to George Halas at 42 years; he won championships with the Bears in both 1921 and 1963. The only other coach to win titles at least 10 years apart? Weeb Ewbank, who won with the Colts in ’58 and ’59, and then as head coach of the Jets (and against the Colts) in 1968.

Most Common Record

There have been 8 Super Bowl champions with 14-2 records, and three of them (’03, ’04, ’16) were coached by Belichick. That’s tied for the second most common record for a Super Bowl champion behind 12-4. There were 11 teams that won with that record, including Belichick’s 2014 squad. The other record to win it all 8 times was 13-3. [continue reading…]

{ 5 comments }

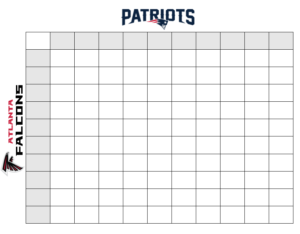
A couple of years ago, I wrote a detailed breakdown about Super Bowl squares. Well, it’s that time of year again, so I’m going to repost that article here to help you cheat to win at your Super Bowl party.

Every Super Bowl squares pool is different, but this post is really aimed at readers who play in pools where you can trade or pick squares (surely no pool has a prohibition on this!) I looked at every regular season and postseason game from 2002 to 2013. [1]Yes, this means your author was too lazy to update things for the 2014, 2015, or 2016 seasons. I suppose the rule change moving back the extra point would probably change things ever so slightly, … Continue reading The table below shows the likelihood of each score after each quarter, along with three final columns that show the expected value of a $100 prize pool under three different payout systems. The “10/” column shows the payout in a pool where 10% of the prize money is given out after each of the first three quarters and 70% after the end of the game; the next column is for pools that give out 12.5% of the pool after the first and third quarters, 25% at halftime, and 50% for the score at the end of the game. The final column is for pools that give out 25% of the pot after each quarter — since I think that is the most common pool structure, I’ve sorted the table by that column, but you can sort by any column you like. To make the table fully sortable, I had to remove the percentage symbols, but “19, 6.7, 4.1, 2” should be read as 19.0%, 6.7%, 4.1%, and 2.0%. [continue reading…]

References

References
1 Yes, this means your author was too lazy to update things for the 2014, 2015, or 2016 seasons. I suppose the rule change moving back the extra point would probably change things ever so slightly, given the small increase in missed extra points.
{ 5 comments }

In the wildcard round last season, all four road teams won.  It isn’t unusual to see a lower seed win in the wildcard round, as often you have the stronger team being on the road against a weak division winner.  That was probably the case when we saw KC beat Houston and Green Bay win in Washington last year; in addition, the Steelers upset the Bengals and Seahawks beat the Vikings.

Since then? Not a single road team has won a playoff game.  The four teams with bye last year — Carolina, Arizona, New England, and Denver — all won in the division round of the playoffs.  Then the #1 seeded Broncos and Panthers won, too, marking six straight home wins.  We skip the Super Bowl, although for trivia fans, the champion Broncos were in fact the designated home team.

In the first round of the playoffs this year, all four home teams won.  The “weak division winner” Texans were aided by a QB injury and beat the Raiders, while the 4 seed in the NFC (the Packers) rode a hot end-of-year streak to beat the Giants.  In addition, Seattle and Pittsburgh won as 3 seeds.

Then, yesterday, the 1 seeded Patriots and 2 seeded Falcons beat the Texans and Seahawks, respectively.  That runs the streak up to 12 straight wins by home teams in the playoffs.  That’s easily the most in NFL history.

In addition, if we include last year’s Super Bowl, that means the last 8 playoff games have been decided by at least 13 points.

Points
Tm Year Date
Time Opp Week Day Result PF PA PD
CAR 2015 2016-01-24 6:42 ARI 20 Sun W 49-15 49 15 34
DEN 2015 2016-02-07 6:39 CAR 21 Sun W 24-10 24 10 14
HOU 2016 2017-01-07 4:35 OAK 18 Sat W 27-14 27 14 13
SEA 2016 2017-01-07 8:15 DET 18 Sat W 26-6 26 6 20
PIT 2016 2017-01-08 1:05 MIA 18 Sun W 30-12 30 12 18
GNB 2016 2017-01-08 4:40 NYG 18 Sun W 38-13 38 13 25
ATL 2016 2017-01-14 4:35 SEA 19 Sat W 36-20 36 20 16
NWE 2016 2017-01-14 8:15 HOU 19 Sat W 34-16 34 16 18

There had never even been six straight games decided by at least 13 points, so this is also an NFL playoff record.

{ 4 comments }

The Lions began the season 9-4, but have now lost the team’s last two games headed into a winner-takes-the-NFC North showdown with the Packers. Detroit’s success — and failures — have been SOS-related. Detroit’s last two losses came to the two best teams (by record) the Lions have faced all year: the 13-2 Cowboys and 10-5 Giants. And the 9-4 start came with Detroit going 8-1 against teams with a losing record and 1-3 against teams with a winning record. To date, the only wins for the Lions this year against a team with a winning record was a 20-17 home victory over 8-6-1 Washington where Detroit had the ball, down 4, at its own 25, with 1:05 remaining. The Lions have done well by beating bad teams, but if Detroit loses to Green Bay, that unlikely win over the Redskins will be the only impressive win the team has all year.

Eight teams have finished with a winning record, missed the playoffs, and also lost at least their last three games.

  • The final season of Dan Fouts’ career was an odd one. The 1987 Chargers lost their first game, but went 3-0 during the replacement games with Rick Neuheisel and Mike Kelly at quarterback. Then, with Fouts and the regular starters back, the Chargers ran their record to 8-1… before losing their final seven games of the season. San Diego went from 8-1 to eliminated from the playoffs even before the final game of the year, and ended with an 8-7 record.
  • The 1993  Dolphins began 9-2, even though Dan Marino was lost for the season after five games with a torn achilles.  But the 9th win came in the Leon Lett game, and Miami didn’t win another game the rest of the year, while the Cowboys didn’t lose another game that season.  A 5-game losing streak to end the season was particularly painful for the Dolphins, who lost a tiebreaker at 9-7 to two other AFC teams to miss the playoffs.
  • The 2008 Bucs collapsed down the stretch, which resulted in Jon Gruden  losing his job. Tampa Bay began 9-3, but lost their final four games in embarrassing fashion. The Bucs allowed three 4th quarter touchdowns to Carolina to lose 38-23, lost a heartbreaking in overtime to Atlanta, lost by 17 to the Chargers, and then blew a 10-point 4th quarter lead as 10.5-point favorites to the Raiders.
  • The 2002 Saints, 2000 Jets, 1996 Chiefs, 1971 Lions, and 1970 Cardinals all lost their final three games and missed the postseason.  New Orleans, New York, and Kansas City all started 9-4, while Detroit was 7-3-1 and St. Louis was 8-2-1.

[continue reading…]

{ 5 comments }

I highly recommend the Bill Barnwell podcast, and this week’s episode previewing the NFC South was a good one. When hearing about the Saints terrible defense last year, Barnwell noted that it seemed like the Saints defense was always allowing big touchdowns.

Well, that’s true: New Orleans gave up a whopping ten touchdown passes of 40+ yards last season; Washington was second with 7 such touchdowns, and that included three touchdowns of exactly 40 yards. By contrast, the Saints allowed six touchdown passes of 50+ yards! The last pass defense to allow 10 touchdowns of 40+ yards was the 1989 Houston Oilers, a 9-7 team that made the playoffs.

The most long (i.e., 40+ yards) passing touchdowns allowed in a season? That sad place in history belongs to another Oilers team. In 1966, Houston allowed 15 such touchdowns in a 14-game season. The 1961 Bills allowed 14 touchdown passes of 40+ yards, the 1950 Rams allowed 12 such scores, and the ’83 Cowboys, ’68 Dolphins, ’65 Browns, and ’52 Texans allowed 11 long touchdowns.

Last year’s Saints allowed, on average, 7.9 yards on every opposing dropback last year. That’s the largest average gain since the 1981 Colts defense (8.2), and it was obviously inflated by all those long touchdowns. But the good news for Saints fans is that regression to the mean has to help New Orleans… right? [continue reading…]

{ 3 comments }
Previous Posts