
Previously:
It’s easy to forget that the 49ers were awful last season, going 4-12 and earning the second pick in the NFL Draft. To the extent you remember that San Francisco was bad last year, it’s probably because you see All-World rookie defensive end Nick Bosa dominating the league this season, and the 49ers drafted him with that second overall pick.
But otherwise, it’s hard to fathom that the dominant, 7-0 49ers, were actually terrible last year. Those 49ers allowed 27.2 points per game and scored 21.4 points per game, a difference of 5.8 points per game. This season, San Francisco is averaging 29.6 points per game and allowing just 11.0 through seven games, a difference of 18.6 points per game and an improvement of 24.4 net points per game.
That’s… a lot. In fact, it’s the third most in the NFL since 1950, trailing only the 2013 Chiefs (who added HC Andy Reid and ex-49ers QB Alex Smith in the offseason) and the 1999 Rams (who added QB Kurt Warner, RB Marshall Faulk, and WR Torry Holt in the offseason to form the GSOT offense). San Francisco has been helped by having QB Jimmy Garoppolo back, of course, but the team has mostly been aided by a dominant defense.
The graph below shows the points differential for each team since 1950 on the X-Axis, and that team’s points differential through 7 games the next season on the Y-Axis. I’ve colored in four of those dots: at -5.8, 21.6 are the ’98-99 Rams; at -5.8, 18.6 are the ’18-19 49ers. Over to the left at -13.4, 12.6 are the 2012-13 Chiefs, and at the top of the chart are the 2018-2019 Patriots, who jumped from a +6.9 points differential to a +25.0 points differential through 7 games. [continue reading…]
Previous Passing Stats:
Jared Goff was the star of week 8, with a strong tip of the hat to Cooper Kupp: playing in London, Goff threw 31 passes and gained 372 yards with 2 TDs and no interceptions and no sacks.
Meanwhile, Sam Darnold and Kyle Allen were the worst passers of the week. The second-year quarterbacks combined for 15 sacks and 6 interceptions, while combining for just 19 passing first downs on 82 dropbacks (23%).
The full week 8 passing stats below:
| Rk | Quarterback | Tm | Opp | Result | Att | Yds | TD | Int | Sk | Yds | ANY/A | VALUE |
|---|---|---|---|---|---|---|---|---|---|---|---|---|
| 1 | Jared Goff | LAR | CIN | W 24-10 | 31 | 372 | 2 | 0 | 0 | 0 | 13.29 | 212 |
| 2 | Derek Carr | OAK | HOU | L 24-27 | 30 | 285 | 3 | 0 | 0 | 0 | 11.5 | 152 |
| 3 | Drew Brees | NOR | ARI | W 31-9 | 43 | 373 | 3 | 1 | 0 | 0 | 9.02 | 111 |
| 4 | Gardner Minshew | JAX | NYJ | W 29-15 | 34 | 279 | 3 | 0 | 2 | 1 | 9.39 | 106 |
| 5 | Matthew Stafford | DET | NYG | W 31-26 | 32 | 342 | 3 | 1 | 4 | 26 | 9.19 | 99 |
| 6 | Daniel Jones | NYG | DET | L 26-31 | 41 | 322 | 4 | 0 | 3 | 32 | 8.41 | 86 |
| 7 | Kirk Cousins | MIN | WAS | W 19-9 | 26 | 285 | 0 | 0 | 3 | 12 | 9.41 | 86 |
| 8 | Aaron Rodgers | GNB | KAN | W 31-24 | 33 | 305 | 3 | 0 | 5 | 49 | 8.32 | 71 |
| 9 | Matt Schaub | ATL | SEA | L 20-27 | 52 | 460 | 1 | 1 | 2 | 17 | 7.74 | 70 |
| 10 | Russell Wilson | SEA | ATL | W 27-20 | 20 | 182 | 2 | 0 | 2 | 11 | 9.59 | 69 |
| 11 | Deshaun Watson | HOU | OAK | W 27-24 | 39 | 279 | 3 | 0 | 3 | 21 | 7.57 | 47 |
| 12 | Matt Moore | KAN | GNB | L 24-31 | 36 | 267 | 2 | 0 | 2 | 18 | 7.61 | 44 |
| 13 | Tom Brady | NWE | CLE | W 27-13 | 36 | 259 | 2 | 0 | 3 | 20 | 7.15 | 28 |
| 14 | Jacoby Brissett | IND | DEN | W 15-13 | 25 | 202 | 0 | 0 | 4 | 11 | 6.59 | 4 |
| 15 | Ryan Tannehill | TEN | TAM | W 27-23 | 33 | 193 | 3 | 0 | 3 | 19 | 6.5 | 2 |
| 16 | Case Keenum | WAS | MIN | L 9-19 | 16 | 130 | 0 | 0 | 2 | 14 | 6.44 | 0 |
| 17 | Carson Wentz | PHI | BUF | W 31-13 | 24 | 172 | 1 | 0 | 3 | 19 | 6.41 | -1 |
| 18 | Jimmy Garoppolo | SFO | CAR | W 51-13 | 22 | 175 | 2 | 1 | 3 | 19 | 6.04 | -10 |
| 19 | Mason Rudolph | PIT | MIA | W 27-14 | 36 | 251 | 2 | 1 | 2 | 15 | 6.08 | -14 |
| 20 | Brett Hundley | ARI | NOR | L 9-31 | 1 | 0 | 0 | 0 | 1 | 4 | -2 | -17 |
| 21 | Philip Rivers | LAC | CHI | W 17-16 | 29 | 201 | 1 | 1 | 1 | 6 | 5.67 | -23 |
| 22 | Kyler Murray | ARI | NOR | L 9-31 | 33 | 220 | 0 | 0 | 3 | 19 | 5.58 | -31 |
| 23 | Josh Allen | BUF | PHI | L 13-31 | 34 | 169 | 2 | 0 | 4 | 14 | 5.13 | -50 |
| 24 | Andy Dalton | CIN | LAR | L 10-24 | 52 | 329 | 1 | 0 | 5 | 32 | 5.56 | -50 |
| 25 | Joe Flacco | DEN | IND | L 13-15 | 32 | 174 | 0 | 0 | 3 | 8 | 4.74 | -60 |
| 26 | Jameis Winston | TAM | TEN | L 23-27 | 43 | 301 | 2 | 2 | 3 | 18 | 5.07 | -63 |
| 27 | Mitchell Trubisky | CHI | LAC | L 16-17 | 35 | 253 | 0 | 1 | 4 | 27 | 4.64 | -70 |
| 28 | Dwayne Haskins | WAS | MIN | L 9-19 | 5 | 33 | 0 | 1 | 2 | 18 | -4.29 | -75 |
| 29 | Baker Mayfield | CLE | NWE | L 13-27 | 31 | 194 | 1 | 1 | 5 | 43 | 3.5 | -106 |
| 30 | Ryan Fitzpatrick | MIA | PIT | L 14-27 | 34 | 190 | 2 | 2 | 4 | 20 | 3.16 | -125 |
| 31 | Sam Darnold | NYJ | JAX | L 15-29 | 30 | 218 | 2 | 3 | 8 | 51 | 1.89 | -173 |
| 32 | Kyle Allen | CAR | SFO | L 13-51 | 37 | 158 | 0 | 3 | 7 | 58 | -0.8 | -319 |
| Total | 1005 | 7573 | 50 | 19 | 96 | 622 | 6.45 |
Typically, there is a very strong relationship between passing offense and team winning percentage. But over shorter samples, that doesn’t always hold up, and that’s been a noticeable trend so far this season.
The Patriots, 49ers, Falcons, and Chargers are all in the same tier of passing efficiency: not in the top ten, but slightly above league average. And yet New England and San Francisco are undefeated, while Atlanta and Los Angeles are 4-12. The graph below shows all 32 teams in the NFL and their statistics through 8 weeks (of course, this is prior to the Steelers/Dolphins MNF game tonight). The X-Axis shows each team’s offensive Adjusted Net Yards per Attempt average relative to league average. The Chiefs, Vikings, and Seahawks are the top three teams in this metric so far this season. The Y-Axis shows winning percentage.
One thing you’ll notice is that the teams looked bunched together. The X-Axis runs from -5.5 to 5.5, and you’ll see why in a moment. [continue reading…]
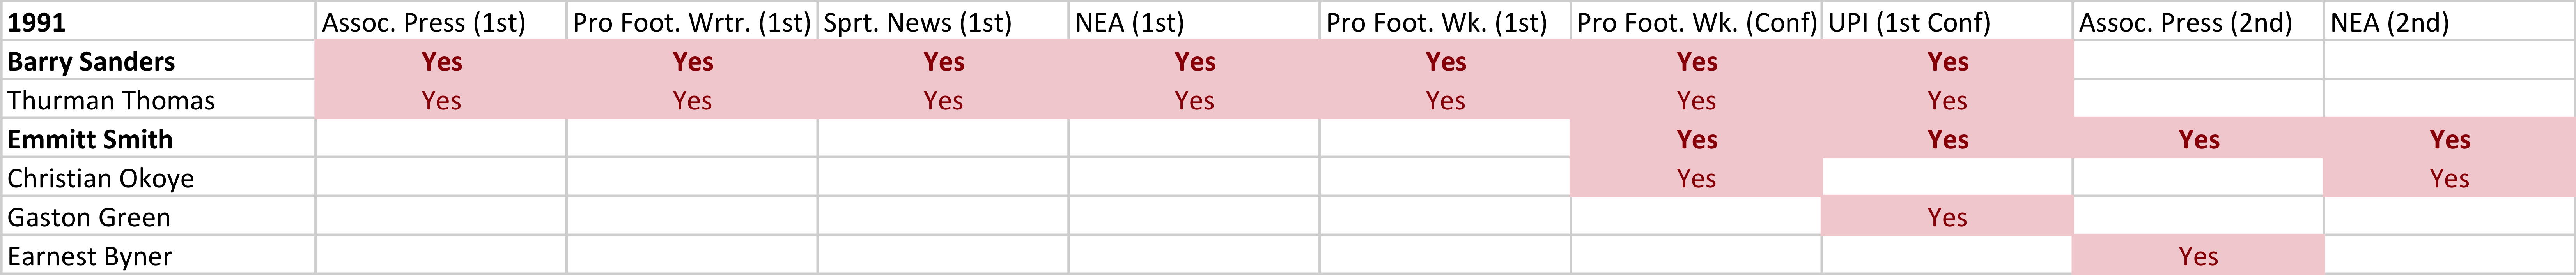
Barry Sanders and Emmitt Smith are two of the greatest running backs in NFL history. They also happened to be contemporaries, which let NFL fans and analysts compare them year after year. Today, I want to review how the media viewed these two players.
Sanders entered the NFL a year before Smith, and was an instant success. As a rookie, Sanders and Christian Okoye were the top running backs in the NFL, with Thurman Thomas, Neal Anderson, and Dalton Hilliard rounding out the top five. Here was the voting by the Associated Press, Pro Football Writers Association, Sporting News, Newspaper Enterprise Association, Pro Football Weekly, and the UPI. I have noted whether each award was a 1st-team All-Pro honor, a 1st-team All-Conference honor, or a 2nd-team All-Pro honor.
 In 1990, Smith entered the league, and while he earned the AP Offensive Rookie of the Year award, he couldn’t compete for honors on a larger scale. This was the start of a two-year period where the former Oklahoma State Cowboys, Sanders and Thomas, were the clear top two running backs in the NFL, with Anderson and Marion Butts also picking up some honors.

In 1991, Thurman Thomas was the MVP of the league according to the AP, PFWA, and the NEA, and he also picked up the AP Offensive Player of the Year award. Sanders, however, also won his first MVP this season, snagging the Bert Bell Award. Smith started to get some honors, and was the media’s choice as the third best running back in the NFL this season.
 In ’92, Steve Young was outstanding and won most of the major MVP awards, but Smith earned his first MVP honors this season, being selected by the NEA as the best player in the NFL. Barry Foster had a career season, and it was he — and not Sanders — who shared the first-team All-Pro awards. Pro Football Weekly also made All-Conference choices this season.

The next season, 1993, Smith swept all the major awards, winning the AP, NEA, PFWA, and Bert Bell MVP honors. Jerome Bettis (on the Rams) was probably the second-best RB this season, with Thomas the best running back in the AFC and fighting with Sanders for the title of third best running back in the NFL. [continue reading…]
Earlier this season, I looked at interceptions by win probability. Today I want to revisit that post and update the numbers through week 7 of the 2019 season.
All data comes from Ron Yurko’s scrapr github page (note: the win probability data is definitely a little bit buggy, with the win probability reversed on pick sixes. I manually fixed those, but I didn’t otherwise mess with the data. I won’t let the perfect be the enemy of the good, though, so let’s proceed).
The graph below shows how much each offense has lost on win probability on interceptions this year on the Y-Axis, and the amount of interceptions the offense has thrown on the X-Axis. The San Francisco 49ers stand out as a pretty interesting outlier here: [continue reading…]
Previously:
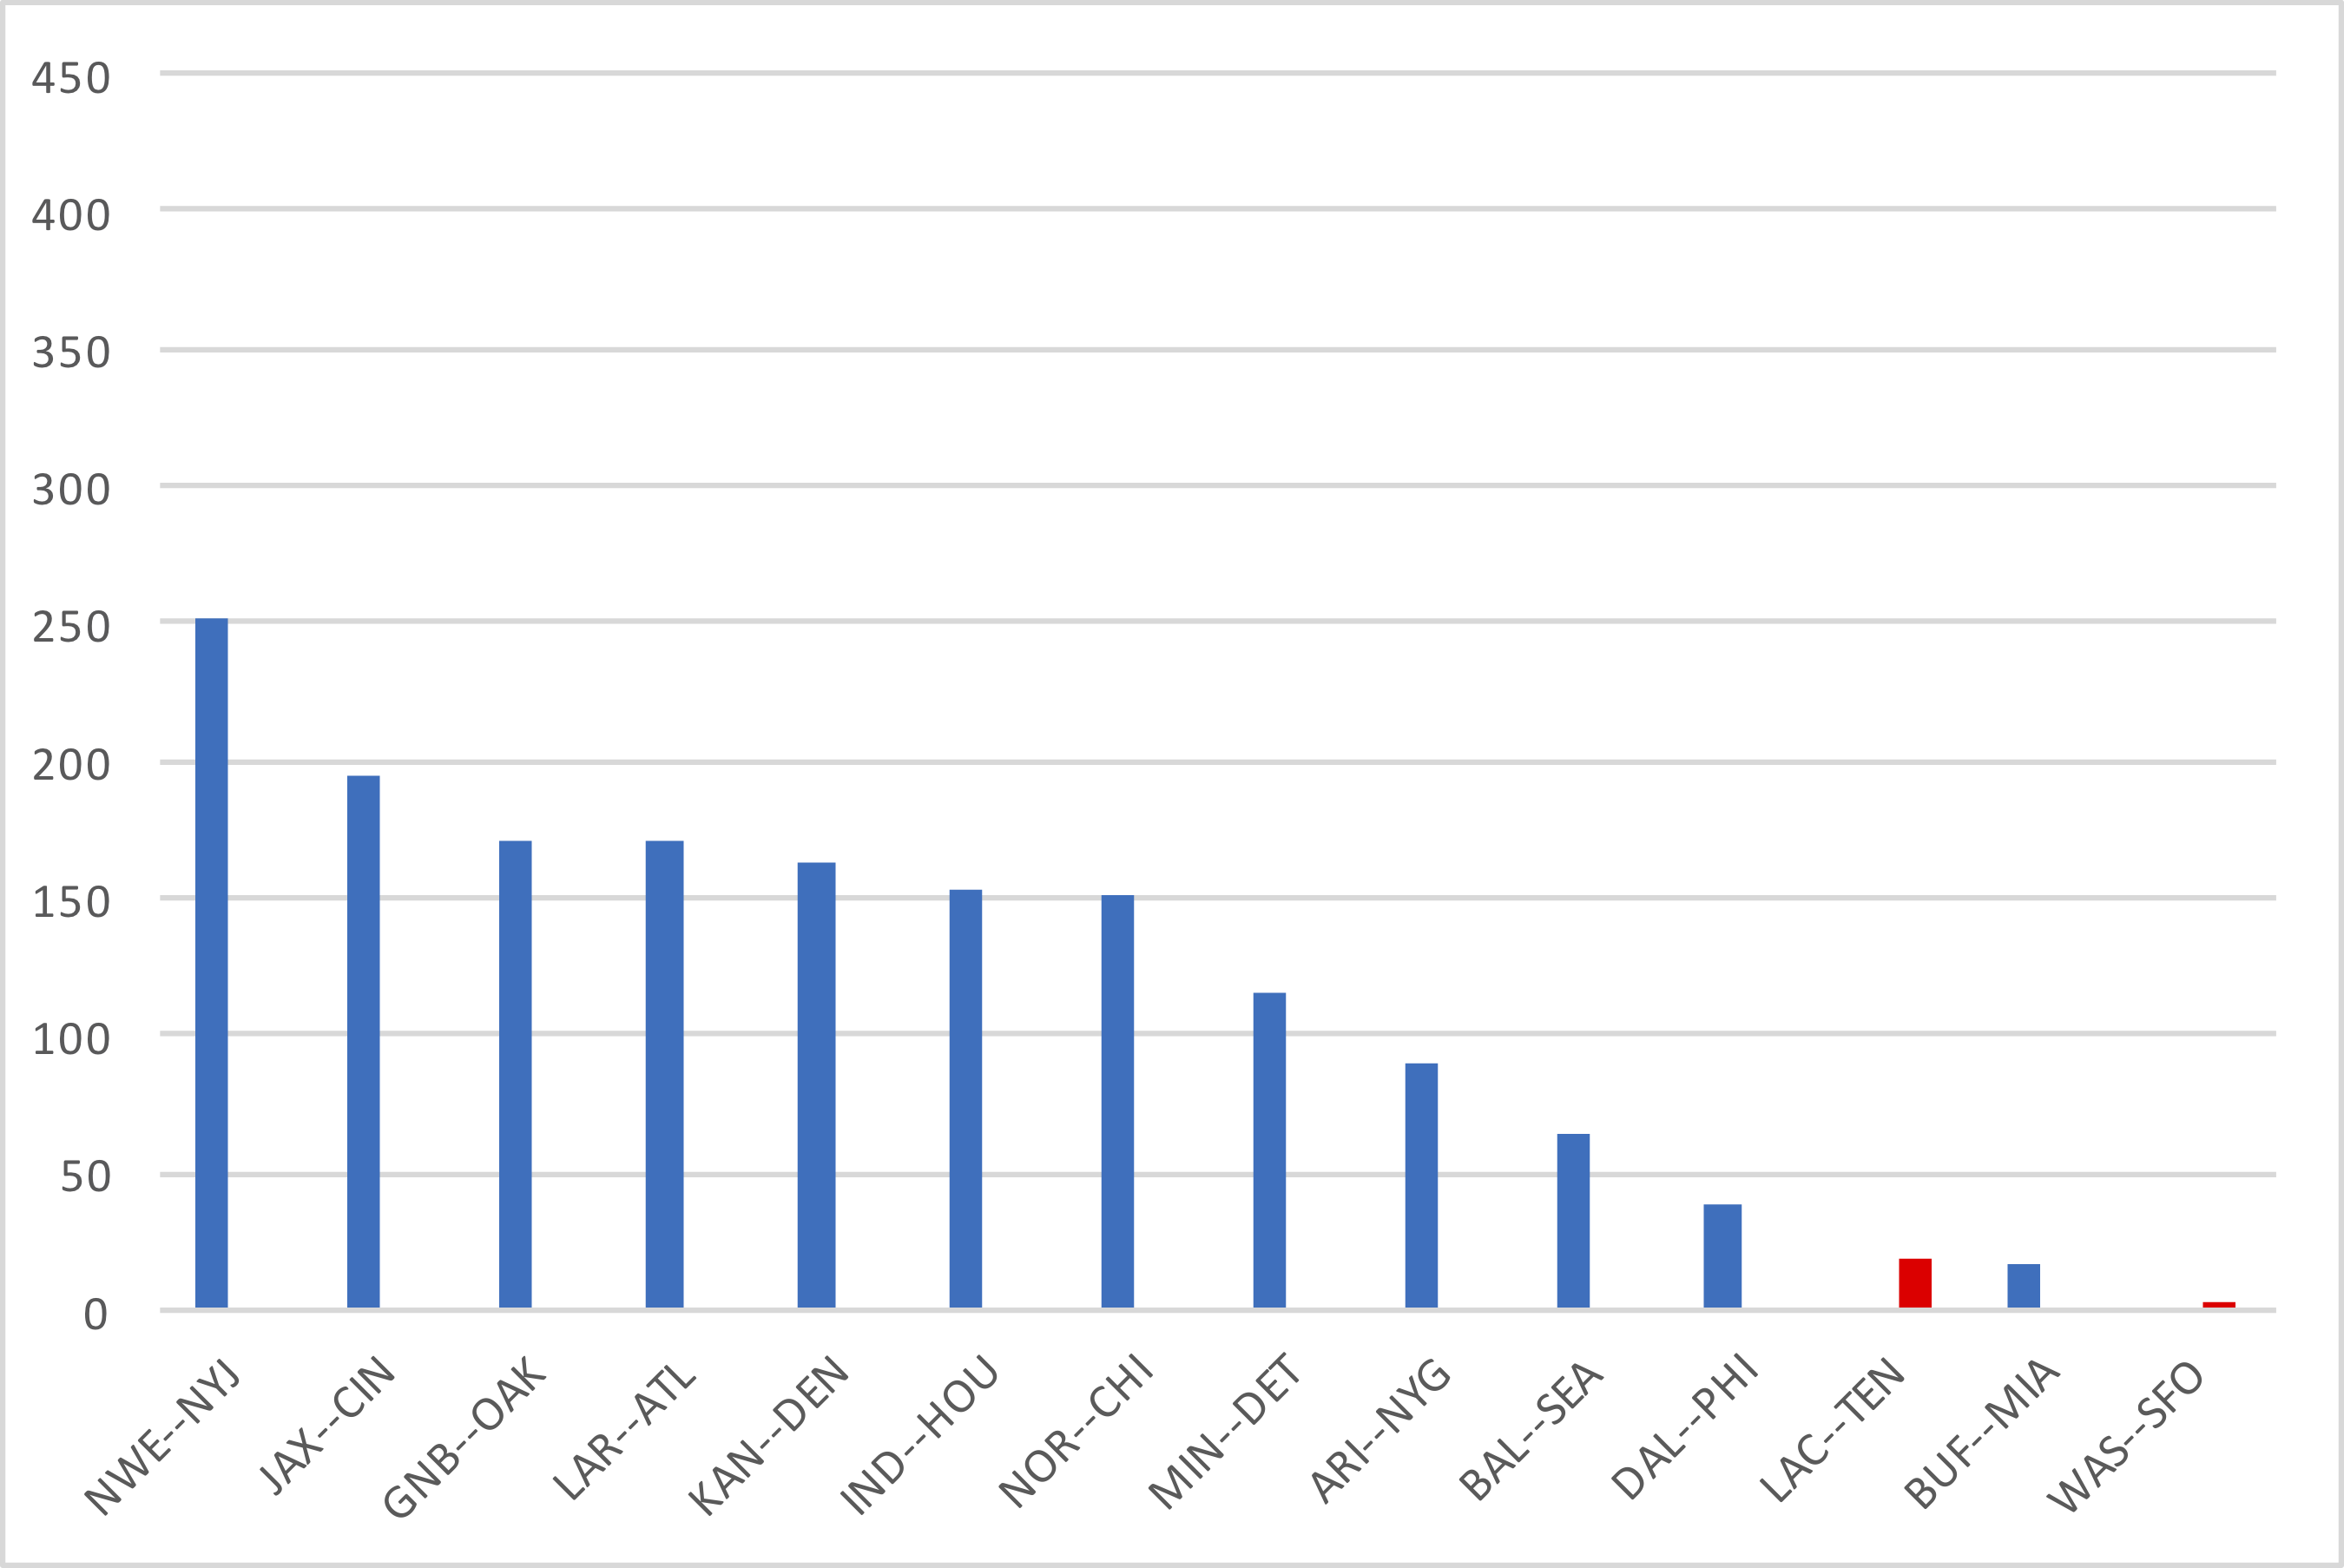
In week 7, the Bears lost by 11 points and the Dolphins lost by 10 points, but the games couldn’t have been more different. Game Scripts are useful in cases like this: the Saints beat Chicago 36-25 but had a Game Script of +7.7. New Orleans 26-10 after three quarters, and 36-10 with 4 minutes remaining before the Bears raced to score 15 meaningless points. Meanwhile, in Buffalo, the Bills won with a Game Script of just +0.5. Miami actually led 14-9 at halftime and at the end of the third quarter, and only led 24-21 with less than two minutes remaining. Buffalo scored a touchdown on Miami’s last minute onside kick attempt, giving Buffalo a 10-point win in a game that was very close throughout.
The table below shows the Game Scripts from week 7: [continue reading…]
Previously:
I had some bugs in my week 6 data that led to a lengthy delay when it comes to posting the week 6 Game Scripts. But better late than never, and for posterity’s sake, I am still posting the data.
This week feels like a long time ago, but a couple of the teams with the most extreme pass/run splits were off in week seven, so that makes this still somewhat topical. Tampa Bay went wildly pass-happy in a blowout loss to Carolina in London. Anytime a team throws 60+ times, or throws on over 80% of its plays, that’s going to be considered a very pass-heavy game, even in a blowout. Jameis Winston had a rough game with 5 interceptions and one lost fumble to go with 7 sacks, but it’s not as though the Tampa Bay ground game (14 for 42) was all that effective. Winston has been extremely boom or bust this year, with 0 games with a passer rating of between 50 and 100.
The Kansas City Chiefs have (or should I say, had) lots of reasons to be pass-happy. In game script-neutral situations, you can argue that Kansas City should be the most pass-happy team in the league. In week 6 against Houston, Patrick Mahomes played pretty well, even if below his own lofty standards. The Chiefs finished with just 11 rushing plays (including one kneel by Mahomes), the fewest in over five years by a team that actually led after three quarters! Of course, it didn’t help that Houston really bled the clock in the second half, limiting Kansas City to just three drives.
The most run-happy team of the week was the Pittsburgh Steelers, without accounting for Game Script, was the Steelers. With Mason Rudolph banged up, Pittsburgh turned to Devlin Hodges as the team’s starting quarterback. Pittsburgh ran an extremely ball-controlled offense: just two of Hodges’s completions were 6 or more yards down the field, and none were more than ten yards from the line of scrimmage. The ground game was moderately effective, picking up 9 first downs on 36 carries, but this was a game that swung on early turnovers. The final score does not reflect the Game Script very well in this one.
The full week 6 Game Scripts data, below: [continue reading…]
Aaron Rodgers had the best game of his career – by pure ANY/A standards – in week 7. Meanwhile, Sam Darnold had the worst game of his short career, an embarassing performance where the entire Jets team looked outmatched.
I’m short on time today, so here are the full passing results from week 7.
| Rk | Quarterback | Tm | Opp | Result | Att | Yds | TD | Int | Sk | Yds | ANY/A | VALUE |
|---|---|---|---|---|---|---|---|---|---|---|---|---|
| 1 | Aaron Rodgers | GNB | OAK | W 42-24 | 31 | 429 | 5 | 0 | 1 | 8 | 16.28 | 310 |
| 2 | Kirk Cousins | MIN | DET | W 42-30 | 34 | 337 | 4 | 0 | 0 | 0 | 12.26 | 193 |
| 3 | Jacoby Brissett | IND | HOU | W 30-23 | 39 | 326 | 4 | 0 | 1 | 5 | 10.03 | 137 |
| 4 | Philip Rivers | LAC | TEN | L 20-23 | 38 | 329 | 2 | 0 | 1 | 3 | 9.38 | 109 |
| 5 | Derek Carr | OAK | GNB | L 24-42 | 28 | 293 | 2 | 1 | 0 | 0 | 10.29 | 103 |
| 6 | Ryan Tannehill | TEN | LAC | W 23-20 | 29 | 312 | 2 | 1 | 2 | 17 | 9.35 | 86 |
| 7 | Matthew Stafford | DET | MIN | L 30-42 | 45 | 364 | 4 | 1 | 2 | 12 | 8.23 | 77 |
| 8 | Jared Goff | LAR | ATL | W 37-10 | 37 | 268 | 2 | 0 | 0 | 0 | 8.32 | 64 |
| 9 | Teddy Bridgewater | NOR | CHI | W 36-25 | 38 | 281 | 2 | 0 | 1 | 8 | 8.03 | 56 |
| 10 | Matt Schaub | ATL | LAR | L 10-37 | 6 | 65 | 1 | 0 | 0 | 0 | 14.17 | 45 |
| 11 | Josh Allen | BUF | MIA | W 31-21 | 26 | 202 | 2 | 0 | 2 | 14 | 8.14 | 43 |
| 12 | Gardner Minshew | JAX | CIN | W 27-17 | 32 | 255 | 1 | 0 | 2 | 11 | 7.76 | 40 |
| 13 | Mike Glennon | OAK | GNB | L 24-42 | 3 | 36 | 1 | 0 | 0 | 0 | 18.67 | 36 |
| 14 | Ryan Fitzpatrick | MIA | BUF | L 21-31 | 35 | 282 | 1 | 1 | 0 | 0 | 7.34 | 26 |
| 15 | Patrick Mahomes | KAN | DEN | W 30-6 | 11 | 76 | 1 | 0 | 0 | 0 | 8.73 | 24 |
| 16 | Johnny Hekker | LAR | ATL | W 37-10 | 1 | 23 | 0 | 0 | 0 | 0 | 23 | 16 |
| 17 | Brett Kern | TEN | LAC | W 23-20 | 1 | 11 | 0 | 0 | 0 | 0 | 11 | 4 |
| 18 | Matt Moore | KAN | DEN | W 30-6 | 19 | 117 | 1 | 0 | 1 | 2 | 6.75 | 3 |
| 19 | Lamar Jackson | BAL | SEA | W 30-16 | 20 | 143 | 0 | 0 | 1 | 2 | 6.71 | 3 |
| 20 | Zach Pascal | IND | HOU | W 30-23 | 1 | 0 | 0 | 0 | 0 | 0 | 0 | -7 |
| 21 | Dak Prescott | DAL | PHI | W 37-10 | 27 | 239 | 1 | 1 | 3 | 26 | 6.27 | -10 |
| 22 | Deshaun Watson | HOU | IND | L 23-30 | 34 | 308 | 1 | 2 | 3 | 17 | 5.97 | -23 |
| 23 | Carson Wentz | PHI | DAL | L 10-37 | 26 | 191 | 1 | 1 | 3 | 23 | 4.93 | -48 |
| 24 | Case Keenum | WAS | SFO | L 0-9 | 12 | 77 | 0 | 0 | 3 | 27 | 3.33 | -49 |
| 25 | Jimmy Garoppolo | SFO | WAS | W 9-0 | 21 | 151 | 0 | 1 | 2 | 5 | 4.39 | -51 |
| 26 | Russell Wilson | SEA | BAL | L 16-30 | 41 | 241 | 1 | 1 | 1 | 0 | 5.14 | -61 |
| 27 | Kyler Murray | ARI | NYG | W 27-21 | 21 | 104 | 0 | 0 | 2 | 15 | 3.87 | -63 |
| 28 | Tom Brady | NWE | NYJ | W 33-0 | 45 | 249 | 1 | 1 | 0 | 0 | 4.98 | -73 |
| 29 | Mitchell Trubisky | CHI | NOR | L 25-36 | 54 | 251 | 2 | 0 | 2 | 16 | 4.91 | -94 |
| 30 | Matt Ryan | ATL | LAR | L 10-37 | 27 | 159 | 0 | 1 | 5 | 38 | 2.38 | -135 |
| 31 | Joe Flacco | DEN | KAN | L 6-30 | 34 | 213 | 0 | 0 | 8 | 72 | 3.36 | -136 |
| 32 | Daniel Jones | NYG | ARI | L 21-27 | 35 | 223 | 1 | 1 | 8 | 67 | 3.05 | -152 |
| 33 | Andy Dalton | CIN | JAX | L 17-27 | 43 | 276 | 1 | 3 | 2 | 18 | 3.18 | -154 |
| 34 | Sam Darnold | NYJ | NWE | L 0-33 | 32 | 86 | 0 | 4 | 1 | 13 | -3.24 | -324 |
| Total | 926 | 6917 | 44 | 20 | 57 | 419 | 6.59 | 0 |
Like most weeks, the team with the passing edge won the game; if anything, this was a more extreme week in that regard.
We are never going to see this level of statistical dominance by a pass defense again.
That’s a pretty bold statement from a pretty conservative blog focused on football history. But 1 passing TD allowed and 18 interceptions in a 7-game stretch?
That will never happen again, and frankly, we may not ever see anything all that close to it happen again. In 2018, the NFL finally exceeded a 2-to-1 ratio of passing touchdowns to interceptions, and the long-term trend is clear: more touchdown passes, fewer interceptions. This season, the 31 pass defenses in the NFL outside of Foxboro have allowed 319 passing touchdowns and forced 155 interceptions, a 2.06-to-1.00 ratio. But the Patriots have forced opposing passers into a 1-to-18 ratio. Include New England’s pass defense, and the NFL’s TD/INT ratio drops to 1.85-to-1.00.
That. Is. Absurd.
Yes, the quarterbacks have been bad. Really bad in some cases (Luke Falk, Josh Rosen), but it also includes games from Ben Roethlisberger, Sam Darnold (coming off a dominant performance), and occasionally competent passers like Case Keenum, Josh Allen, Daniel Jones, and Ryan Fitzpatrick. But it doesn’t matter: if you would have asked me could the best defense in the NFL produce a 1-to-18 ratio against the worst quarterbacks in the NFL for a 7-game span, I would have said no.
This is obviously unsustainable but it is so far to the right tail of comprehensible that you just have to look at the stat line in awe. And know that something like this will never happen again. New England’s defense has posted a passer rating of 35.6; if you throw an incomplete pass on every plat, that’s a 39.6 passer rating! New England is allowing less than 1.0 ANY/A over 7 games! If a running back had 1,000 yards on his first 100 carries of the season, that would be unsustainable, too, but it wouldn’t make it any less remarkable. It might make it more remarkable, because this transcends any notion of what we would think possible.
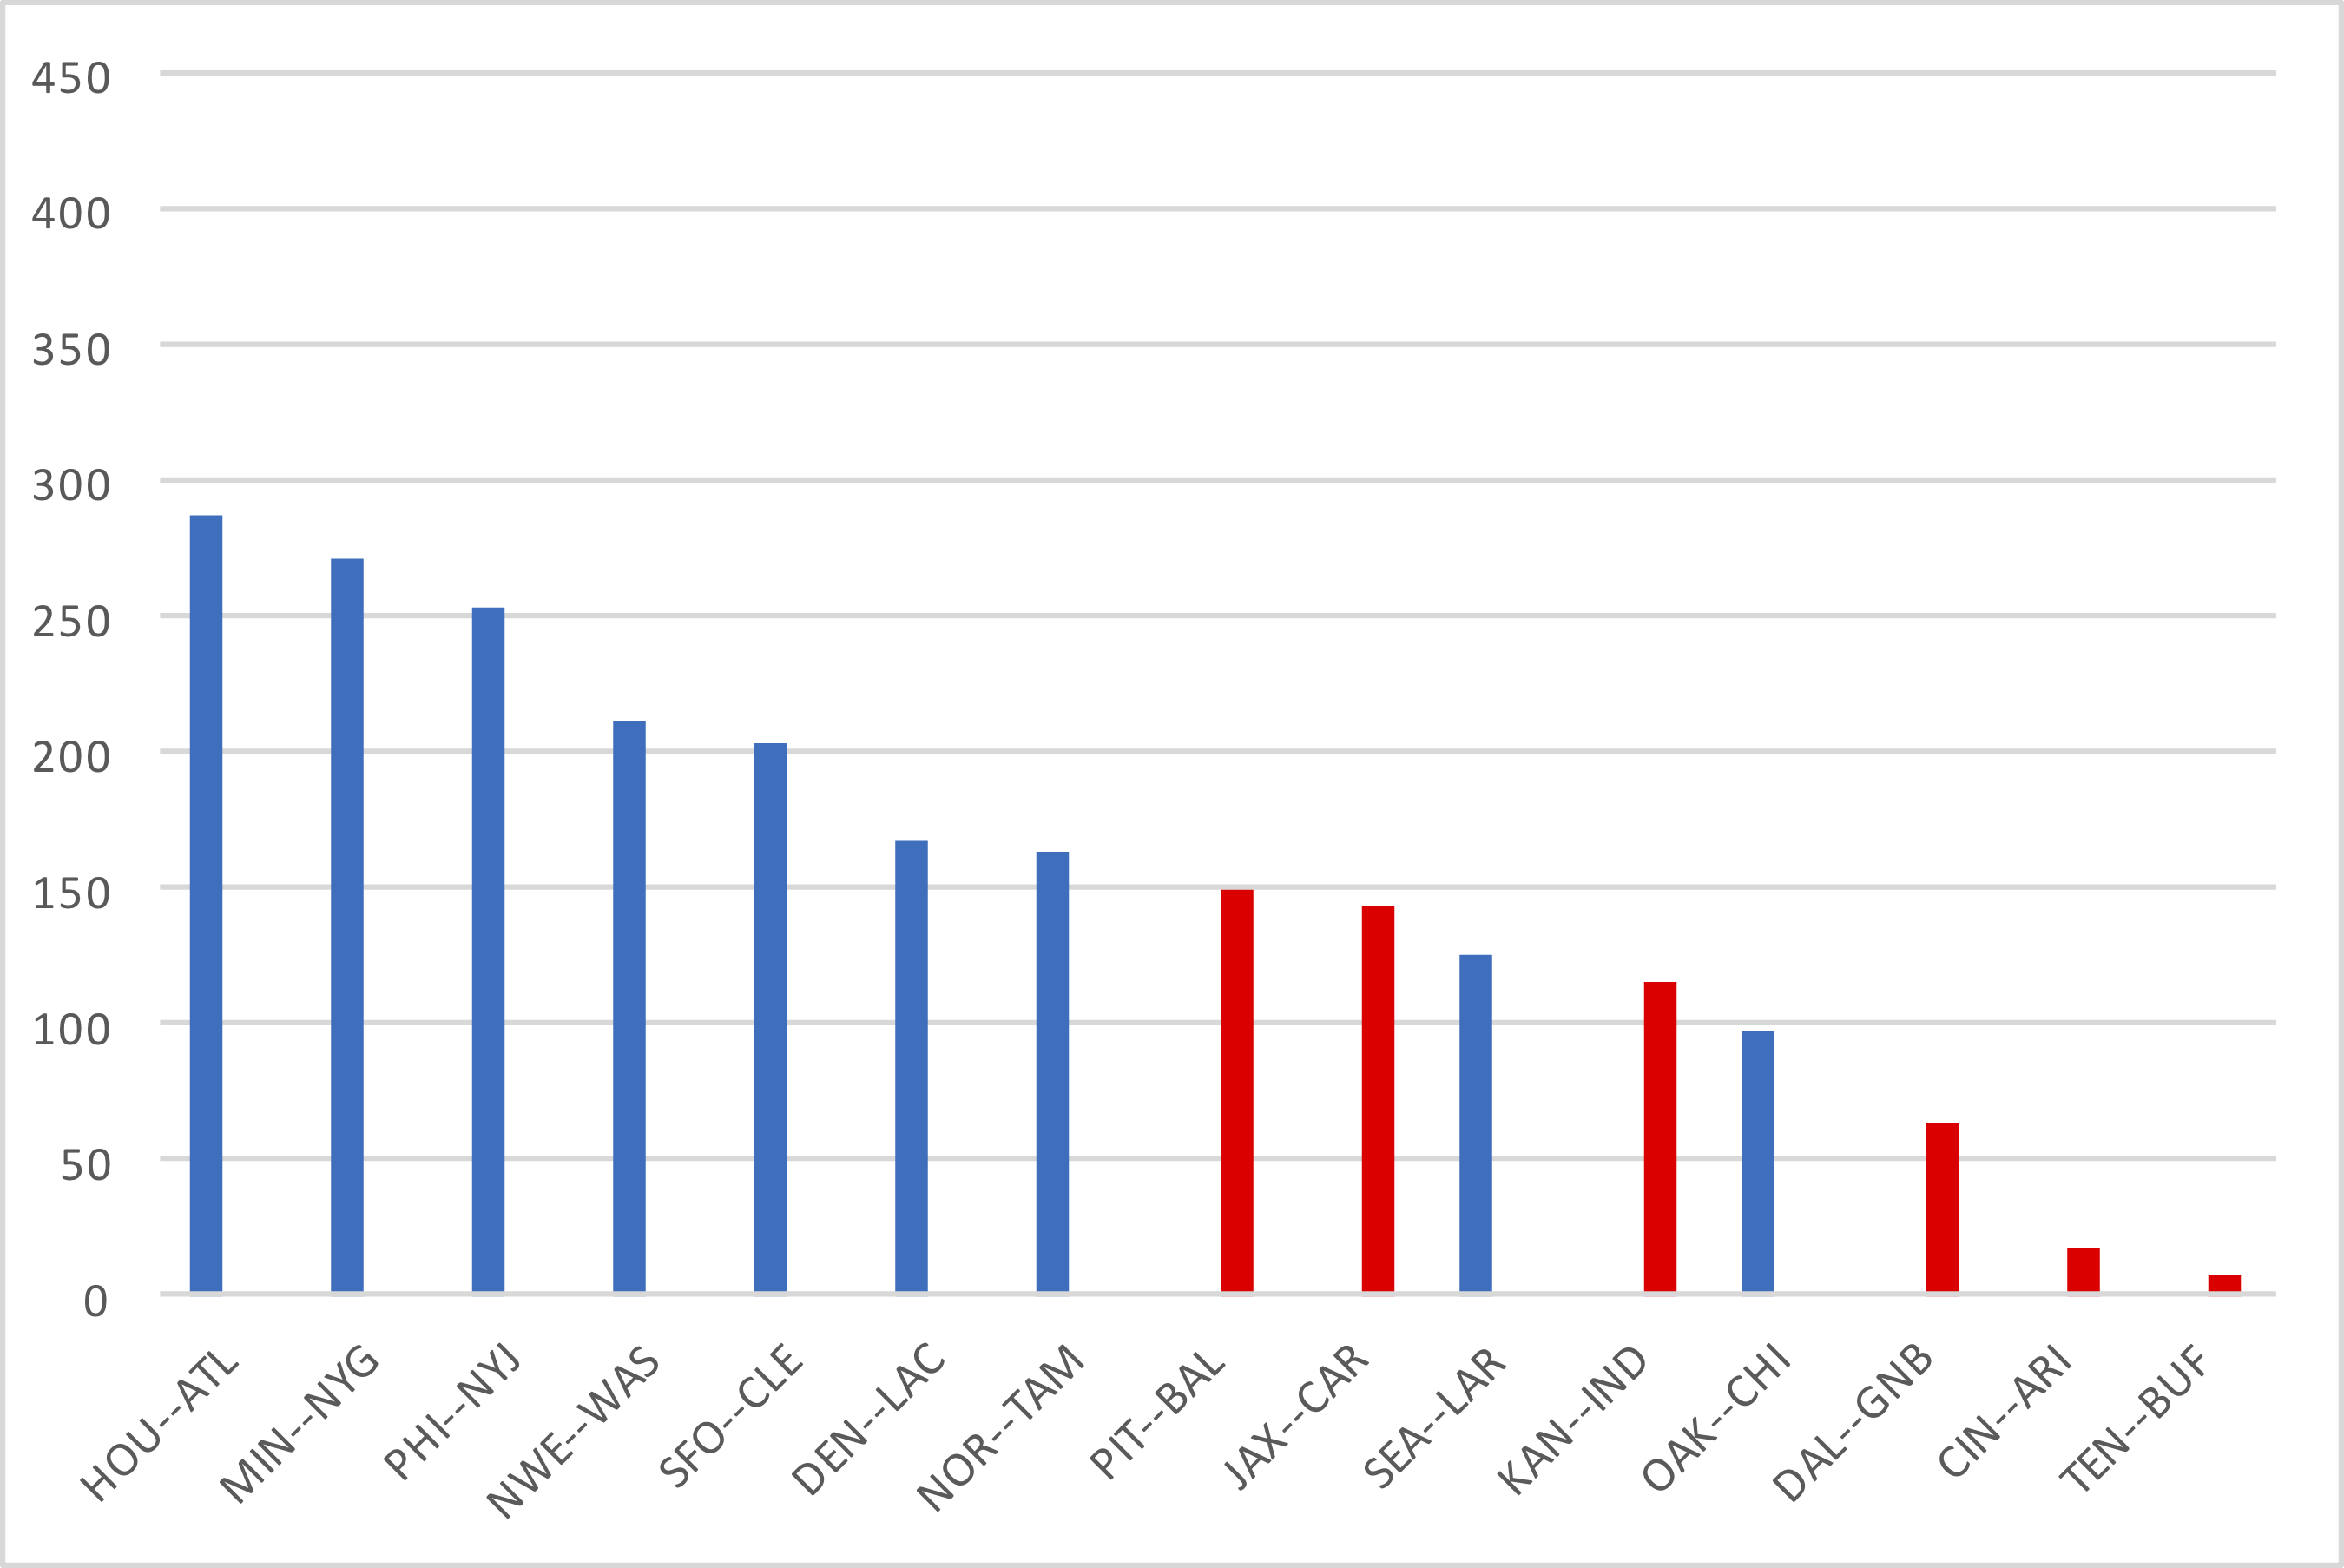
The graph below shows the TD% (on the X-Axis) and INT% (on the Y-Axis) for each pass defense this year. To make “up and to the right” the good part of the graph, I have plotted the TD% in reverse order. As you can see, the Patriots pass defense stands alone. [continue reading…]
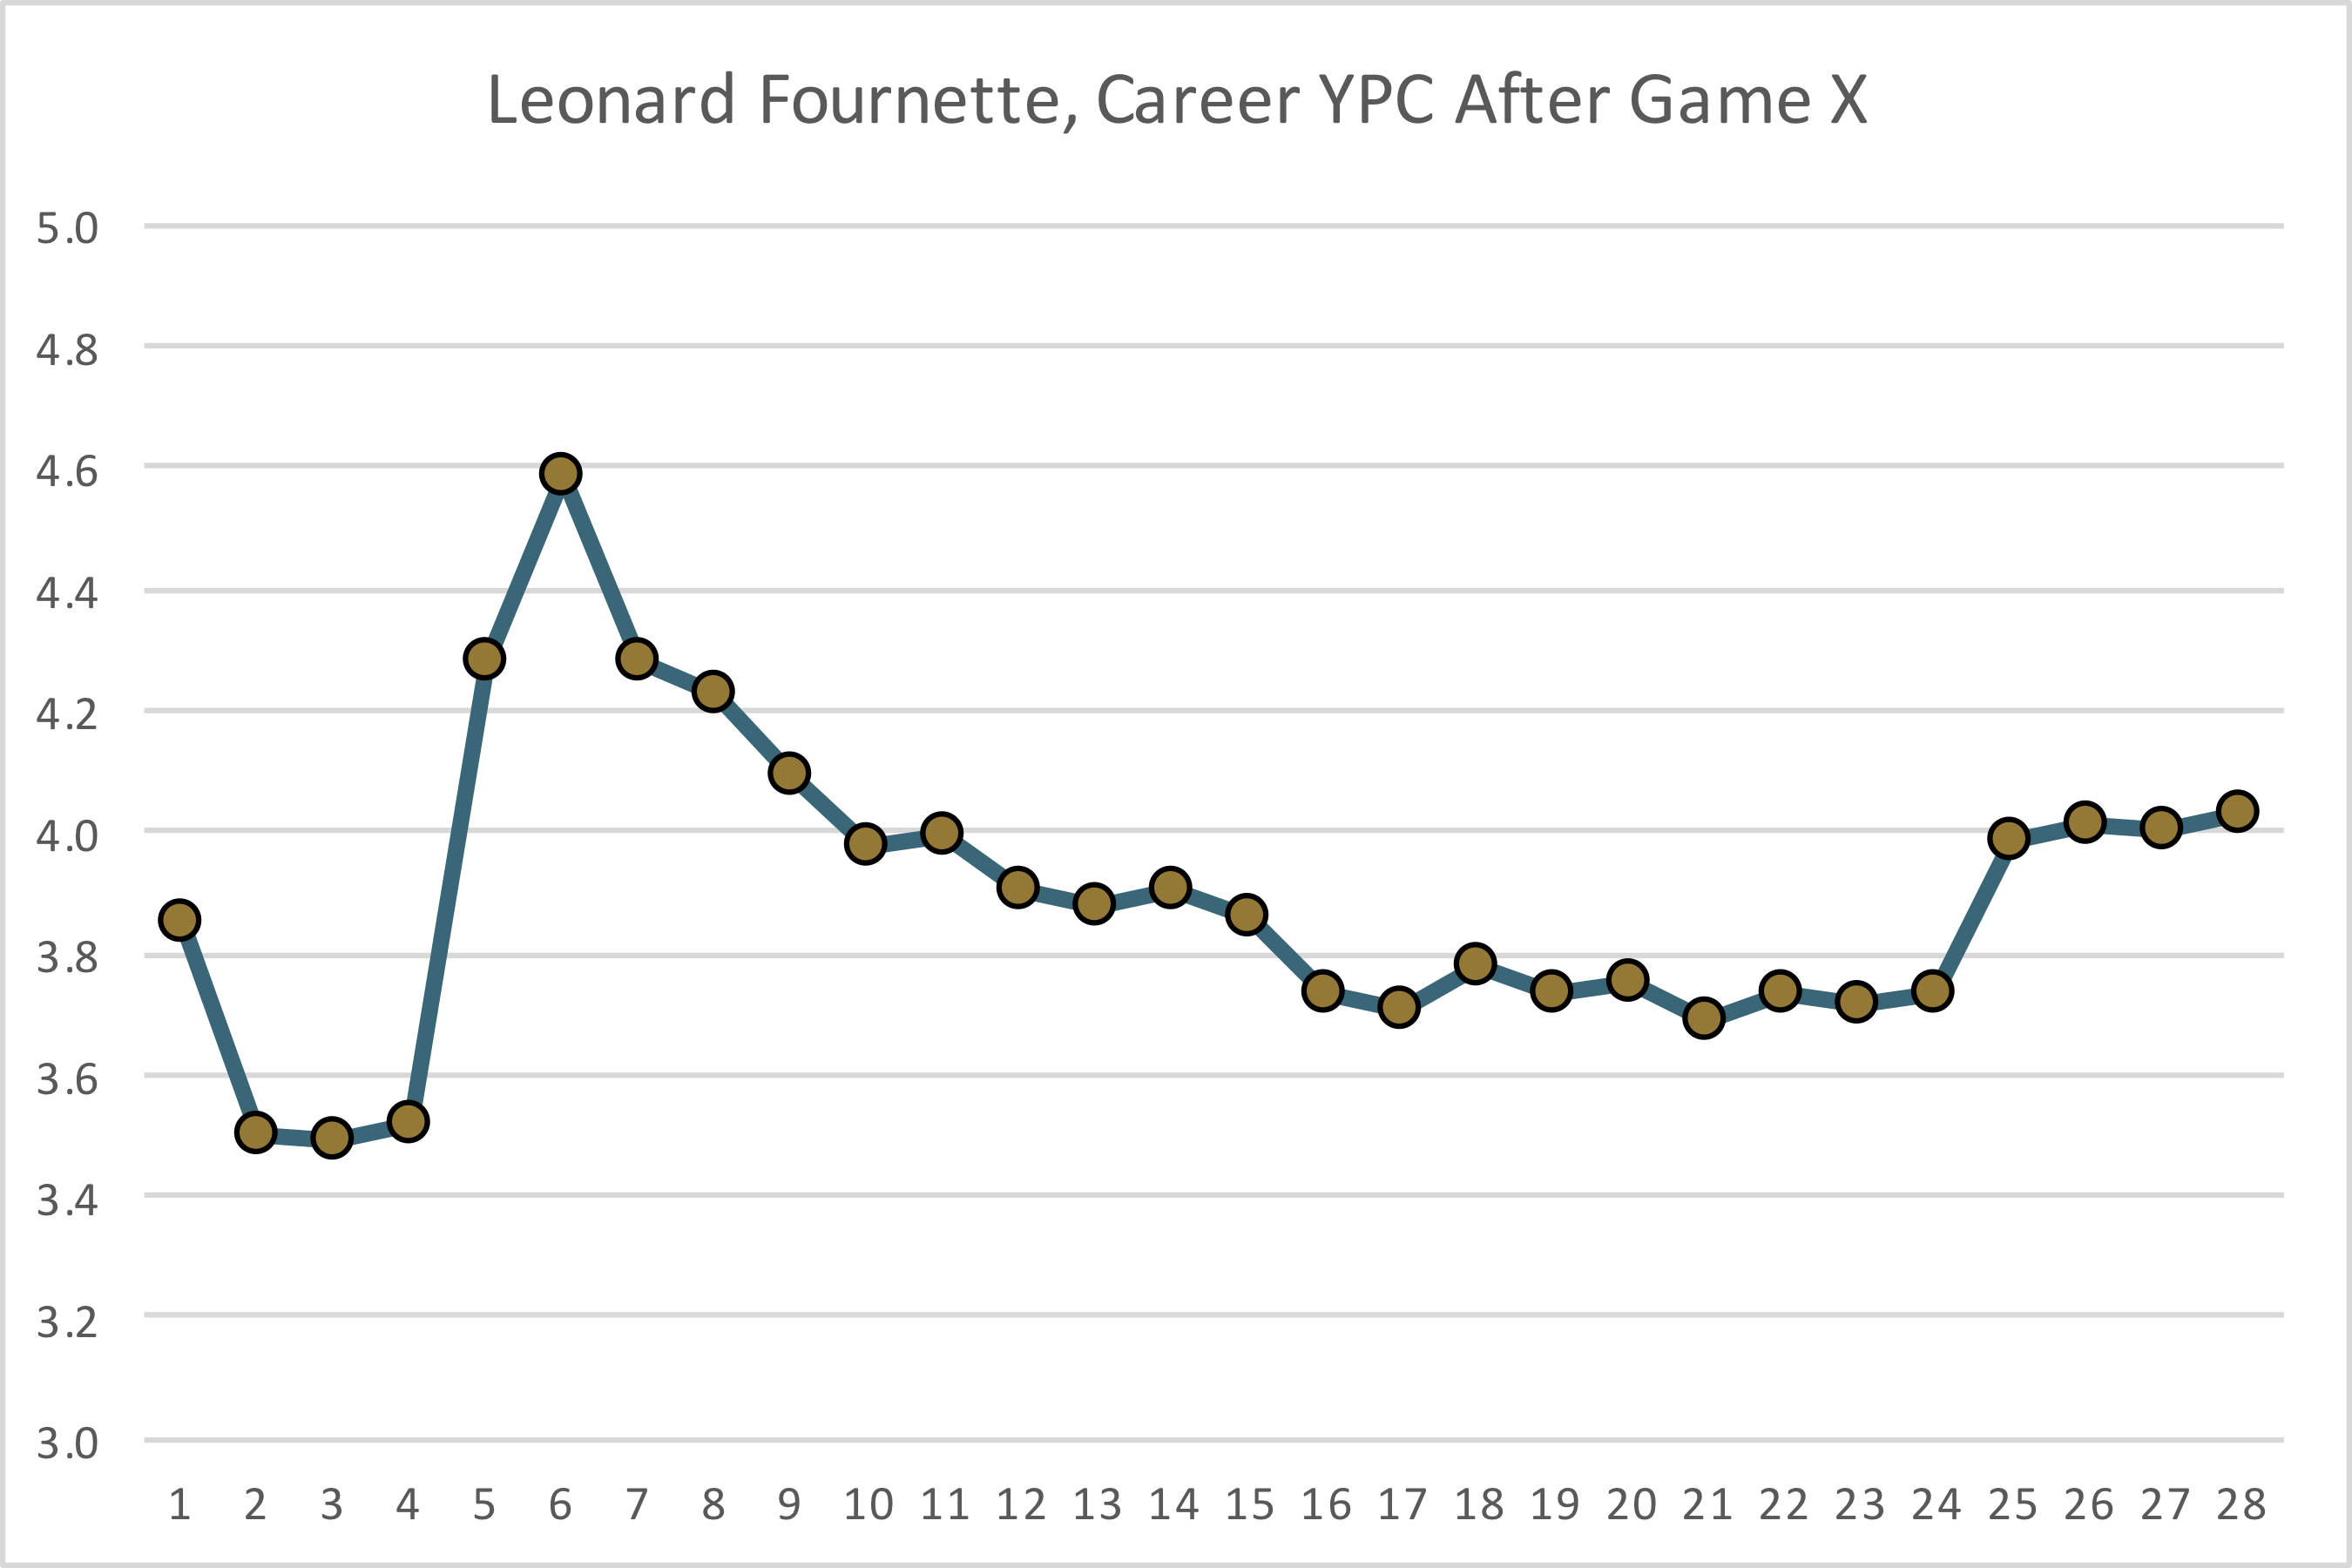
Leonard Fournette is averaging 5.0 yards per carry this season, a year after producing an anemic 3.3 average in 2018. After Fournette’s latest performance against the Bengals, his career average gain has once again bounced north of four yards. This prompted our friend Adam Harstad to note on Twitter that all those who were down Fournette because of his low yards per carry average could now rest easy since his YPC is once again above 4.0.
The graph below shows Fournette’s career yards per carry average after every game of his 28-game career.
Panthers running back Christian McCaffrey is having an outstanding season. Through 6 games, the former Stanford star has 923 yards from scrimmage, which represents 41% of Carolina’s 2,250 total yards. He has a huge lead in “percentage of team yards” over everyone else: Dalvin Cook, Le’Veon Bell, and Leonard Fournette all have just a hair over 1/3 of their team’s total yards.
Only two players in NFL history have picked up over 45% of their team’s total yards from scrimmage: O.J. Simpson in 1973 and Maurice Jones-Drew in 2011.
The table below shows the top 100 seasons in NFL history in percentage of team yards from scrimmage. [continue reading…]
Last year at this time, I looked at which teams were spreading it around the most in their passing offenses. And this time last year, the Indianapolis Colts had the most diverse passing offense in the NFL. This season, that honor …. again belongs to the Colts.
T.Y. Hilton is the team’s leading receiver and has “only” 22% of the team’s receiving yards; Eric Ebron and and Zach Pascal are next on the team and neither has more than 13% of the team’s receiving yards. Indianapolis is the only team in the NFL where its top three leaders in receiving yards have less than half of the team’s receiving yards. The table below shows the Colts receivers; the final column is the square of the percentage of team’s receiving yards, which is how we calculate the concentration index. [continue reading…]
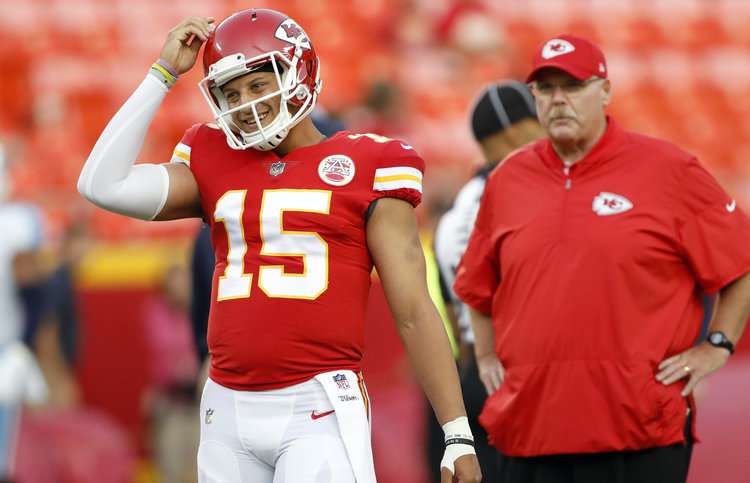
Can you spot the HOF QB?
You can listen here.
As always, please leave your thoughts in the comments.
In 2016, Matthew Stafford averaged just 5.8 air yards per attempt on completed passes.
In 2017, Stafford averaged 6.0 air yards per attempt on completions.
In 2018, the Lions franchise quarterback averaged an anemic 4.8 AYpAoCP.
But this season, through six weeks, Stafford leads the NFL in AYpAoCP, posting a whopping 8.1 average.
There are 23 quarterbacks who threw at least 100 passes last season and, as of today, have thrown at least 100 passes so far this season. This includes Joe Flacco (Baltimore in 2018, Denver in 2019), Case Keenum (Denver, Washington), and Josh Rosen (Arizona, Miami). The graph below shows the Air Yards per Attempt on Completed Passes for all 23 quarterbacks in both 2018 (X-Axis) and 2019 (Y-Axis). The NFL logo represents the quarterback on his 2019 team. Jameis Winston, unsurprisingly, stands out here: he ranks second in this metric in both seasons. Also unsurprising is Derek Carr ranking very low in both years. But Stafford (and Dak Prescott) stand out as big movers: [continue reading…]
The Rams just traded a 2020 first round pick, a 2021 first round pick, and a 2021 fourth round pick for Jaguars All-Pro cornerback Jalen Ramsey.
A few weeks ago, the Steelers traded a 2020 first round pick, a 2020 fifth round pick, and a 2021 sixth round pick to the Dolphins for Minkah Fitzpatrick and a 2020 fourth round pick, and a 2021 seventh round pick. In addition, the Texans traded for Laremy Tunsil and Kenny Stills, along with a 2020 fourth round pick and 2021 sixth round pick from Miami for a 2020 first round pick, a 2021 first round pick, a 2021 second round pick, and Johnson Bademosi and Julie’n Davenport.
This came after an offseason where the Browns traded with the Giants for Odell Beckham and sent back to New York Jabrill Peppers, a 2019 1st round pick (#17, used on Dexter Lawrence) and 2019 third round pick (#95, Oshane Ximines).
That was the second blockbuster trade for a wide receiver in less than six months, after the Cowboys sent a 2019 1st round pick (which turned out to be the 27th pick and was used on Johnathan Abram) to the Raiders for WR Amari Cooper.
And, of course, the Cooper trade followed the blockbuster Khalil Mack trade, where Chicago tradeda 2019 first round pick (which turned out to be #24 and used on Josh Jacobs), a 2019 sixth round pick, a 2020 first round pick, and a 2020 third round pick to the Raiders for Mack, a 2020 second round pick, and a 2020 conditional fifth round pick.
It is the Mack trade that appeared to open the floodgates: Mack was the runner-up for the 2018 AP Defensive Player of the Year award, and was the star of a Bears defense that was the best in the NFL. Similarly, the Cowboys trade for Cooper was widely (and rightly) panned at the time, but Cooper put on a dominant performance: in 10 games with Dallas, including the playoffs, he gained 838 receiving yards and 6 touchdowns.
The problem with the Mack and Cooper trades, however, wasn’t the player acquired but the cost. In addition to significant draft capital, Chicago had to hand Mack an enormous contract, and the Cowboys are paying Cooper over $13M this year and will soon have to sign Cooper to a large deal, too. Mack had played 4 years in Oakland, and Cooper 3, meaning their years on cheap, cost-controlled contracts were in Oakland.
The Browns/OBJ trade was a bit different: Cleveland will pay Beckham a little over $15M per year, but (1) there is no signing bonus, and therefore Cleveland can cut him at any time, and (2) he’s coming at a bit of a discount relative to his true value, since the Giants ate his signing bonus. It’s not a cheap contract by any means, but I suspect Cleveland will be happier with his contract than Dallas will be with whatever they hand Cooper.
The Tunsil and Fitzpatrick trades felt crazy at the time, and that’s how this Rams/Ramsey one does, too. Yes, Ramsey is young — he turns 25 years old next week — but he’s going to cost a lot of money. Los Angeles handed out a record-breaking contract to its running back, its quarterback, and its defensive tackle, and L.A. will have to do the same with Ramsey, too. If Ramsey was a free agent, and the Rams signed him to the richest contract in cornerback history, there are some who would criticize that move. To give up two first round draft picks for the honor to do that is extremely risky. [continue reading…]
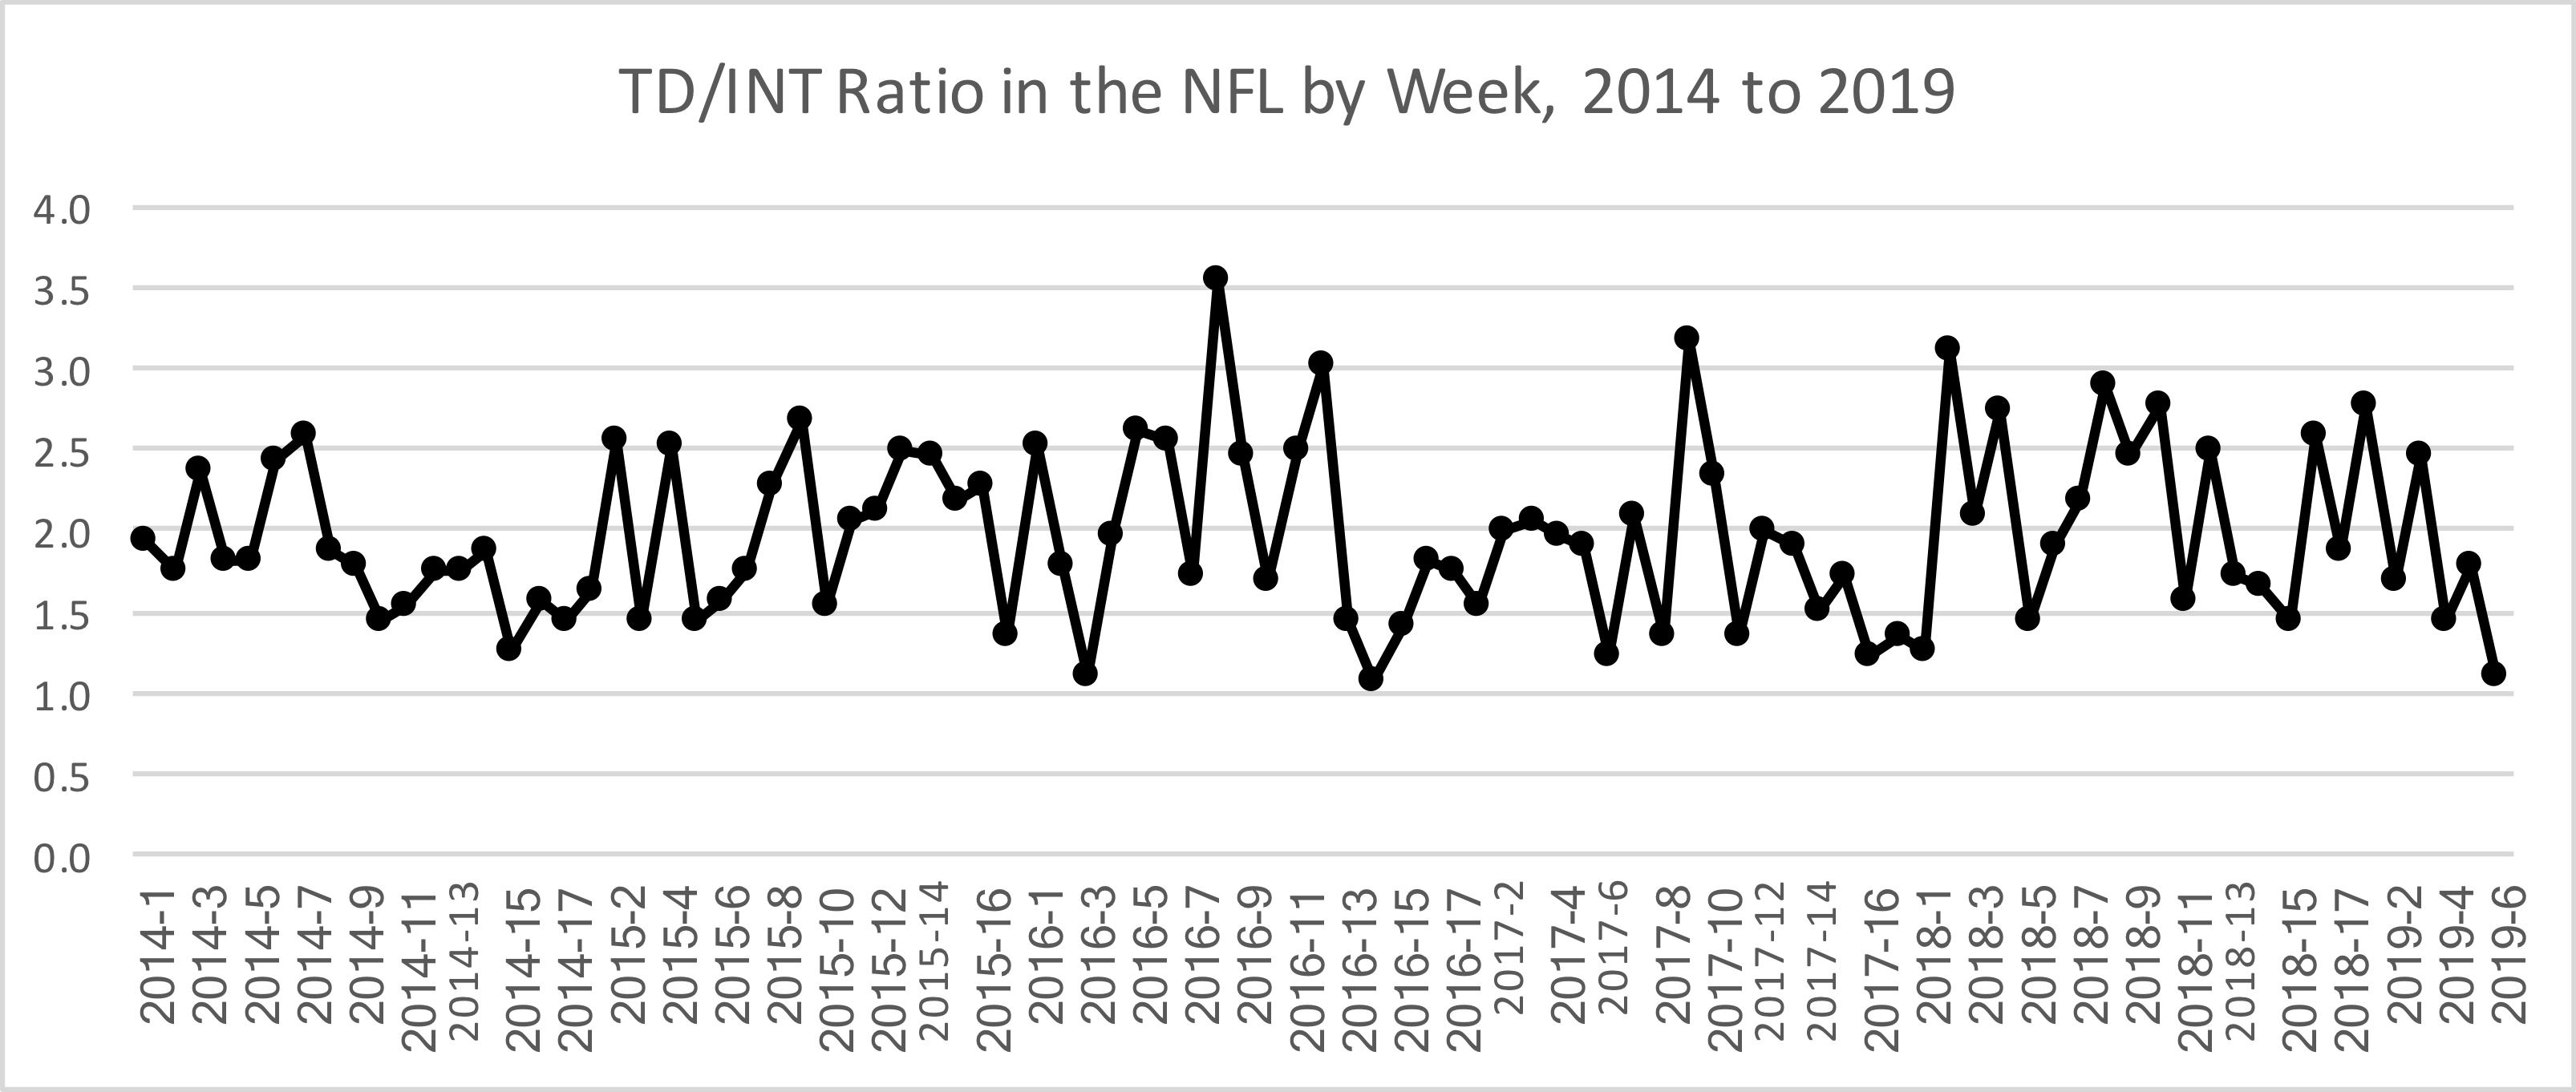
This was another rough week for passers, at least by 2019 standards. The most remarkable stat was the TD/INT ratio, which was just 35/32 in week six. The graph below shows the TD/INT ratio for each week since the start of the 2014 season; other than week 14 of 2016 (38 TDs, 36 INTs), this was the worst week of this period:
And if you weren’t watching the Falcons/Cardinals game, you probably thought week 6 was really ugly. Outside of that game, NFL teams threw for just 28 touchdowns across 26 teams, but the story of the week was in Arizona. Because once again, Matt Ryan in a losing effort is becoming a thing. Since the start of the 2018 season, Ryan has lost while averaging over 12.0 ANY/A and throwing for over 350 yards, lost while averaging over 11.0 ANY/A and throwing for over 400 yards, and now lost while averaging over 11.0 ANY/A and throwing for over 350 yards. Since the start of the 2018 season, there have been just 17 times when a quarterback has hit the 11.00 ANY/A and 350-yard thresholds; Ryan is 0-3 in these games, while the rest of the NFL is 14-0.
The reason Ryan lost, of course, was his defense, but some (much?) of the credit must go to Kyler Murray and the Cardinals, too (and some of the rest of the blame should go on the missed extra point at the end of the game). The number one overall pick had the best game of his young career on Sunday, and finished with the third best passing performance of the week. The full week 6 passing stats are below: [continue reading…]
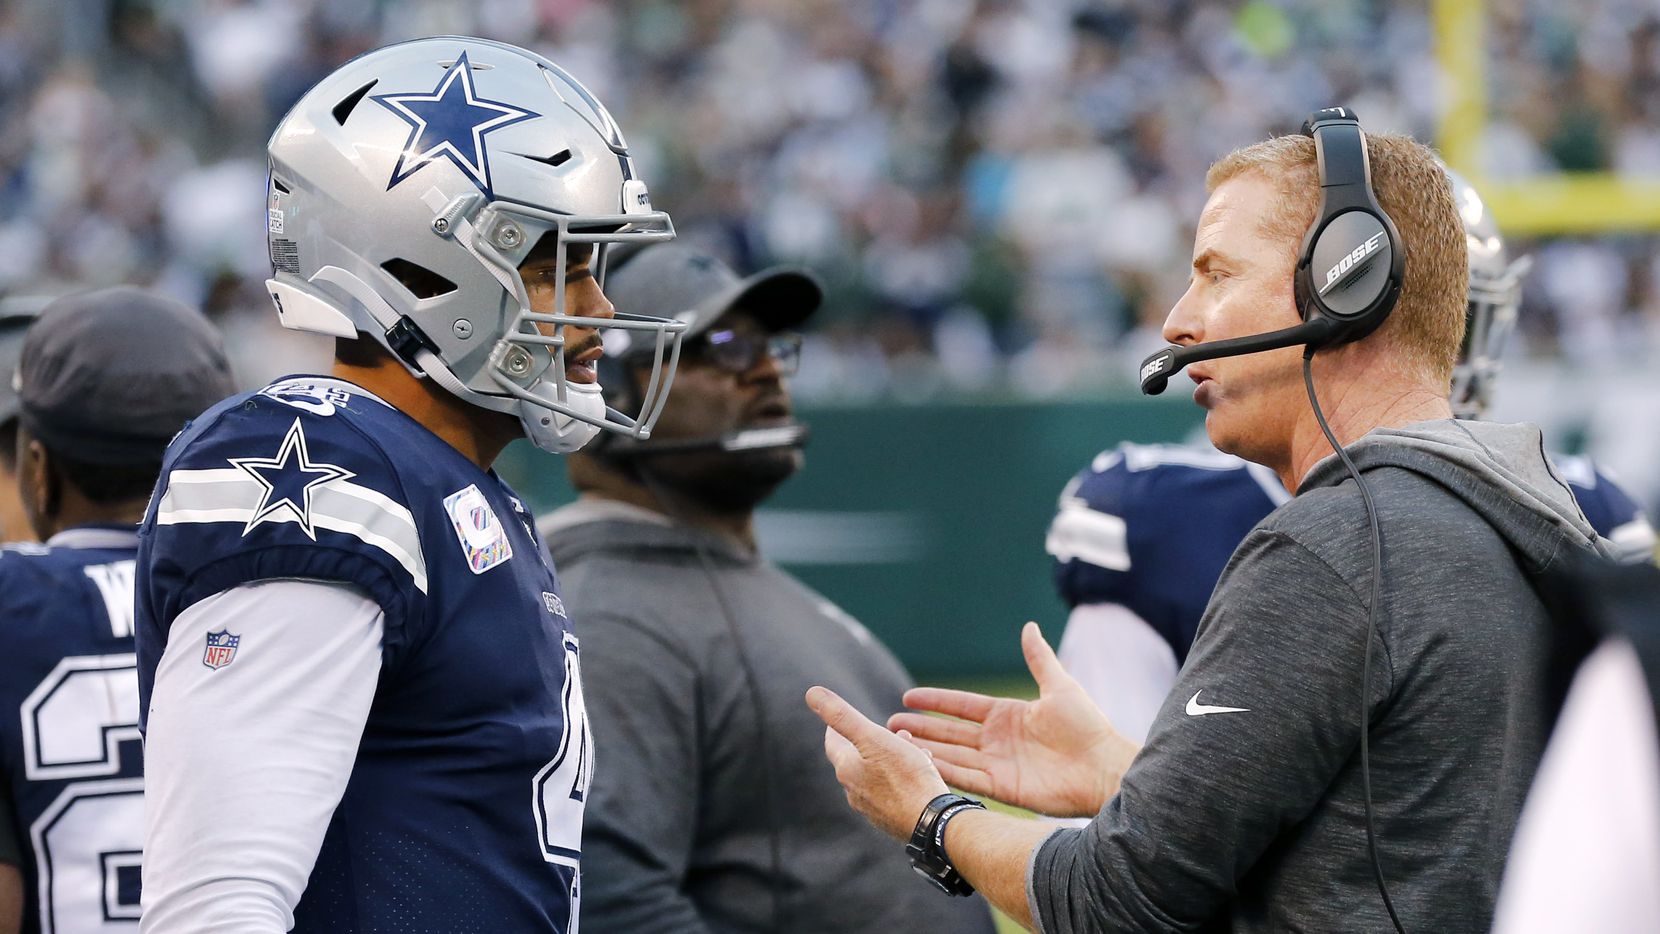
I’m telling you, Dak, Tom Landry never went for 2.
Seven years ago, I wrote that when trailing by 15 points midway through the fourth quarter, a team that scores a touchdown should go for two. Midway through the fourth quarter, Dallas trailed the Jets by 12 points — which, math experts may quickly realize, is a 15-point lead minus one field goal. Therefore, the same logic applies, and you’ll see why in a moment.
Ezekiel Elliott rushed for a touchdown with 6:36 remaining, and this is when the Cowboys should have gone for two. And this is not Monday morning quarterbacking: I tweeted as such in real time. Instead, Dallas sent out the kicker and cut the lead to 5 points. The Jets responded with a field goal, which highlighted the problem.
That made it a 8-point game, which is why it was a mistake to not go for two earlier. Just like when you score a touchdown down by 15, you want to go for two to make it either a 7-point game or a 9-point game. When trailing by 15, you need to score two touchdowns and convert a two-point conversion. If you convert the two-point conversion, it doesn’t matter whether you go for two after the first touchdown or the second touchdown (although, of course, only if you go for it the first time can you try to win the game with a 2-point attempt after the second touchdown). If you miss the two point conversion attempt, however, it makes a very big difference.
Dallas was ignorant of the situation: by going for 1, the Cowboys did not know that they would go on to fail on their two-point conversion attempt. Here’s what actually happened: after the Jets kicked a field goal, Dallas took over with 3:23 remaining, and casually drove down the field, scoring with 47 seconds left. The Cowboys then missed the 2-point conversion play, effectively ending the game (more on this in a minute). [continue reading…]
Adam Steele is back for another guest post. You can view all of Adam’s posts here. As always, we thank him for contributing.
When Does ANY/A Get It Wrong?
In Chase’s review of week one passing stats, I commented that the league’s passing efficiency was inflated by ANY/A in comparison to expected points added (EPA). Today’s post takes a deeper dive into the discrepancy between ANY/A and EPA and which quarterbacks look better in each metric.
While ANY/A is a good metric for quick and dirty analysis, it ignores a number of important variables for accurately measuring a quarterback’s passing efficiency. These variables include: first downs, failed completions, air yard / YAC splits, dropped passes, fumbles, the context of interceptions, and garbage time adjustments. My metric of choice to solve these issues is ESPN’s model of expected points (the primary component of Total QBR). I prefer ESPN’s version in particular because it attempts to isolate the quarterback’s share of credit for every play; the EPA numbers found at Pro Football Reference and Advanced Football Analytics hold the quarterback fully responsible for his team’s pass plays, which, in my opinion, is not much better than just using ANY/A.
In order to compare EPA to ANY/A, I divided pass EPA by dropbacks then converted EPA/A into an index stat using the same formula for ANY/A+. For those not familiar, index stats are scaled so a score of 100 is average and 15 points represents one standard deviation above or below that average. EPA data goes back to 2006 which gives us 439 qualifying seasons to compare. As you would suspect, these two variables are closely correlated (R^2 of 0.74) in the aggregate, but there will be many individual outliers. In the graph below, the X-Axis shows the ANY/A+ for each quarterback, while the Y-Axis shows the EPA/Attempt+ for that quarterback. [continue reading…]
Jacoby Brissett has a reputation as a guy who will take a lot of sacks. In fact, prior to 2019, he stood out as one of the most extreme examples of a quarterback who would rather take a sack than throw an interception. But among all starting quarterbacks in the NFL, it’s Brissett who has the longest active streak of pass attempts without a sack.
Earlier in the week, we looked at quarterbacks who had gone the longest without throwing an interception. Per reader Eric Drew’s suggestion, today we will look at the active streaks for all quarterbacks (through week 5, so excluding the Giants/Patriots TNF game) in terms of pass attempts without taking a sack. As you can see, Brissett has gone 85 pass attempts without a sack. During this stretch, he’s thrown two interceptions, while Deshaun Watson has the longest active streak of pass plays without a sack or an interception: [continue reading…]
Previously:
The Seahawks beat the Rams in week 5 by the smallest of margins, 30-29. Quarterback Russell Wilson was incredible, averaging 14.25 ANY/A against Los Angles on 24 dropbacks. Wilson also had 5 scrambles for 28 yards, two kneel downs, and one designed carry for six yards. The Seahawks also had 35 designed runs for players other than Wilson that picked up 135 yards.
That is, to put it bluntly, not the correct ratio. Giving Wilson 30 plays and running the ball 35 times with someone else is pretty silly, but it’s doubly bad in a close game where Wilson is playing like a Hall of Fame quarterback in his prime. Seattle trailed entering the 4th quarter, and while Wilson’s 8 carries make the stats a bit misleading, consider the following:
Seattle with 43 rush attempts on 67 plays, a 64% run ratio. That’s the second-highest run ratio of any game in the last 5 years where a team trailed entering the 4th quarter, behind a super run-heavy game by the Colts in the snow in Buffalo in 2017. Seattle finished with a negative Game Script and ran more than they passed — by a lot — in a game where Wilson was outstanding!
By way of reference, consider how the Colts had a super run-heavy game in week 5. Jacoby Brissett had 29 dropbacks and 6 runs (2 scrambles, 2 kneels, 2 designed runs), while Indianapolis runners besides Brissett had 39 rushes for 171 yards! That is a really run-heavy game, but keep in mind two things: Indianapolis had a slightly positive Game Script of +1.8, and Brissett wasn’t all that good, averaging 3.66 ANY/A! The Colts had the second most run-heavy game of the week, and were still less run-heavy than Seattle despite the better Game Script, the better rushing attack, and the much, much, much worse passing attack.
The full week 5 Game Scripts, below: [continue reading…]
Some fun with play by play data this morning. As you know, Patrick Mahomes, Russell Wilson, and Marcus Mariota are the only starting quarterbacks that have not thrown an interception so far this year. Going back to the 2019 regular season and playoffs, Mahomes has now gone 274 passes without throwing an interception, Wilson 201 passes, and Mariota 191 passes. The table below shows how long each quarterback in the NFL has gone without throwing an interception, as of week 5, 2019. I’ve also shown how many sacks that quarterback has taken during this streak, and their sack rate. [continue reading…]
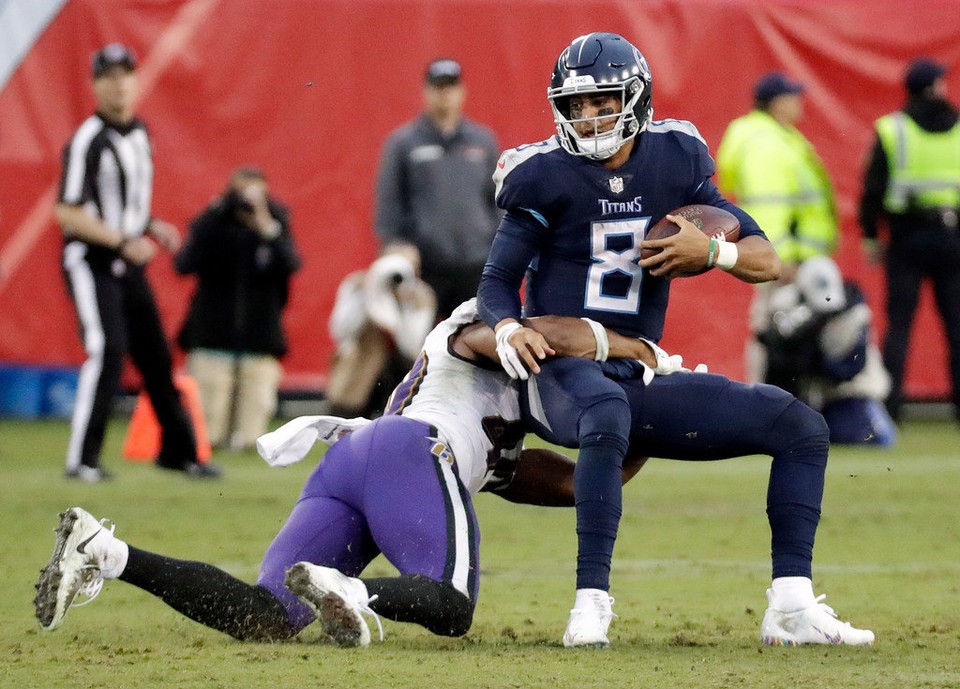
Mariota sacks and the leaves changing, a fall tradition like no other.
Mariota is a frustrating quarterback to analyze because he seems so afraid of making mistakes. Last year, that manifested itself by taking a sack rather than throwing an incomplete pass. This year, Mariota is taking sacks and not throwing interceptions. Dating back to last season, Mariota has now thrown 191 straight passes without throwing an interception. But during that time, he’s taken 26 sacks, a 12% sack rate.
This season, the Titans have taken a sack on 13.5% of pass plays, the second-worst rate behind the hapless Jets (who have been playing a third string quarterback). Meanwhile, Tennessee is one of just three teams (Seattle, Kansas City) that has yet to throw an interception. Tennessee has picked up a 1st down on just 28.2% of passing plays this season (46 passing first downs, 141 pass attempts, 22 sacks), which ranks 27th so far in 2019. Avoiding interceptions is great, but that should be the product of good quarterback play and not the primary goal.
Along with the Jets, the Titans are the only team this season to punt on over half of their drives. Tennessee is the only team this year without a turnover, while all other teams have at least four. But the objective of an offense is to score, and Tennessee is joined by the Redskins and the three stepsisters of the AFC East in the bottom five of the NFL in percentage of drives that end in a score.
I don’t know if Mariota is ever going to take the leap and become a top quarterback, and the evidence so far suggests he won’t. But I do know that if he is going to take that leap, it’s going to be because he starts leading touchdown drives, and not because he doesn’t make mistakes.
Houston Texans quarterback Deshaun Watson is pretty darn good when he isn’t being sacked. On Sunday against the Falcons, for just the second time in his career, Watson played a game without being sacked. And now both times, he has thrown 5 TDs in those games. He also has a 3-sack, 5 TD game, meaning he’s played more games where he’s thrown 5 TDs than he’s avoided any sacks.
Against Atlanta, the Texans punted on their opening drive. After that, Houston scored on its other 8 drives in the game, discarding end of half/game drives. And most of those drives were touchdowns, with all of them covering at least 59 yards. Houston went 10/13 on third down conversions, averaged nearly 9 yards per play, and looked dominant against an overmatched Falcons pass defense.
Watson stood out as by far the best passer of week 5, overshadowing strong performances from Russell Wilson and Teddy Bridgewater. On the other side of things, Luke Falk and Baker Mayfield turned in two of the sorriest performances you’ll witness this season. Both finished with negative ANY/A, and the Jets and Browns combined for only 11 passing first downs.
The full week 5 passing numbers below:
| Rk | Quarterback | Tm | Opp | Result | Att | Yds | TD | Int | Sk | Yds | ANY/A | VALUE |
|---|---|---|---|---|---|---|---|---|---|---|---|---|
| 1 | Deshaun Watson | HOU | ATL | W 53-32 | 33 | 426 | 5 | 0 | 0 | 0 | 15.94 | 323 |
| 2 | Russell Wilson | SEA | LAR | W 30-29 | 23 | 268 | 4 | 0 | 1 | 6 | 14.25 | 194 |
| 3 | Teddy Bridgewater | NOR | TAM | W 31-24 | 34 | 314 | 4 | 1 | 0 | 0 | 10.26 | 140 |
| 4 | Kirk Cousins | MIN | NYG | W 28-10 | 27 | 306 | 2 | 0 | 3 | 27 | 10.63 | 134 |
| 5 | Gardner Minshew | JAX | CAR | L 27-34 | 44 | 374 | 2 | 0 | 2 | 16 | 8.65 | 115 |
| 6 | Jared Goff | LAR | SEA | L 29-30 | 49 | 395 | 1 | 1 | 0 | 0 | 7.55 | 68 |
| 7 | Andy Dalton | CIN | ARI | L 23-26 | 38 | 262 | 2 | 0 | 1 | 0 | 7.74 | 62 |
| 8 | Dak Prescott | DAL | GNB | L 24-34 | 44 | 463 | 2 | 3 | 3 | 22 | 7.36 | 57 |
| 9 | Kyler Murray | ARI | CIN | W 26-23 | 32 | 253 | 0 | 0 | 1 | 5 | 7.52 | 45 |
| 10 | Tom Brady | NWE | WAS | W 33-7 | 42 | 348 | 3 | 1 | 4 | 36 | 7.11 | 44 |
| 11 | Patrick Mahomes | KAN | IND | L 13-19 | 39 | 321 | 1 | 0 | 4 | 33 | 7.16 | 43 |
| 12 | Matt Ryan | ATL | HOU | L 32-53 | 46 | 330 | 3 | 1 | 2 | 14 | 6.9 | 35 |
| 13 | Derek Carr | OAK | CHI | W 24-21 | 32 | 229 | 0 | 0 | 0 | 0 | 7.16 | 32 |
| 14 | Jimmy Garoppolo | SFO | CLE | W 31-3 | 29 | 181 | 2 | 0 | 2 | 10 | 6.81 | 20 |
| 15 | Carson Wentz | PHI | NYJ | W 31-6 | 29 | 189 | 1 | 0 | 1 | 8 | 6.7 | 16 |
| 16 | Odell Beckham | CLE | SFO | L 3-31 | 1 | 20 | 0 | 0 | 0 | 0 | 20 | 14 |
| 17 | Devlin Hodges | PIT | BAL | L 23-26 | 9 | 68 | 0 | 0 | 0 | 0 | 7.56 | 13 |
| 18 | Taysom Hill | NOR | TAM | W 31-24 | 1 | 18 | 0 | 0 | 0 | 0 | 18 | 12 |
| 19 | Mason Rudolph | PIT | BAL | L 23-26 | 20 | 131 | 1 | 0 | 1 | 11 | 6.67 | 11 |
| 20 | Alvin Kamara | NOR | TAM | W 31-24 | 1 | 13 | 0 | 0 | 0 | 0 | 13 | 7 |
| 21 | Jameis Winston | TAM | NOR | L 24-31 | 27 | 204 | 2 | 0 | 6 | 46 | 6 | -5 |
| 22 | Garrett Gilbert | CLE | SFO | L 3-31 | 1 | 0 | 0 | 0 | 0 | 0 | 0 | -6 |
| 22 | Christian McCaffrey | CAR | JAX | W 34-27 | 1 | 0 | 0 | 0 | 0 | 0 | 0 | -6 |
| 22 | Jarrett Stidham | NWE | WAS | W 33-7 | 1 | 0 | 0 | 0 | 0 | 0 | 0 | -6 |
| 25 | Aaron Rodgers | GNB | DAL | W 34-24 | 34 | 238 | 0 | 0 | 2 | 23 | 5.97 | -7 |
| 26 | Joe Flacco | DEN | LAC | W 20-13 | 20 | 182 | 1 | 1 | 3 | 23 | 5.83 | -8 |
| 27 | Marcus Mariota | TEN | BUF | L 7-14 | 22 | 183 | 0 | 0 | 5 | 33 | 5.56 | -16 |
| 28 | Josh Allen | BUF | TEN | W 14-7 | 32 | 219 | 2 | 1 | 4 | 15 | 5.53 | -23 |
| 29 | Kyle Allen | CAR | JAX | W 34-27 | 30 | 181 | 1 | 0 | 3 | 21 | 5.45 | -23 |
| 30 | Jaylen Samuels | PIT | BAL | L 23-26 | 2 | 4 | 0 | 1 | 0 | 0 | -20.5 | -53 |
| 31 | Chase Daniel | CHI | OAK | L 21-24 | 30 | 231 | 2 | 2 | 4 | 37 | 4.24 | -65 |
| 32 | Jacoby Brissett | IND | KAN | W 19-13 | 29 | 151 | 0 | 1 | 0 | 0 | 3.66 | -73 |
| 33 | Daniel Jones | NYG | MIN | L 10-28 | 38 | 182 | 1 | 1 | 4 | 35 | 2.9 | -137 |
| 34 | Colt McCoy | WAS | NWE | L 7-33 | 27 | 119 | 0 | 1 | 6 | 44 | 0.91 | -173 |
| 35 | Philip Rivers | LAC | DEN | L 13-20 | 48 | 211 | 0 | 2 | 0 | 0 | 2.52 | -175 |
| 36 | Lamar Jackson | BAL | PIT | W 26-23 | 28 | 161 | 1 | 3 | 5 | 22 | 0.73 | -179 |
| 37 | Baker Mayfield | CLE | SFO | L 3-31 | 22 | 100 | 0 | 2 | 4 | 42 | -1.23 | -192 |
| 38 | Luke Falk | NYJ | PHI | L 6-31 | 26 | 120 | 0 | 2 | 9 | 52 | -0.63 | -237 |
| Total | 991 | 7395 | 43 | 24 | 80 | 581 | 6.16 | 0 |
As usual, the teams that won the passing battle won the game. But there were three notable outliers in week 5: the Steelers pass defense was great, but Pittsburgh still lost in overtime to Baltimore. Jacksonville won the passing battle against Carolina, but didn’t have Christian McCaffrey. And the Colts had a run-heavy and very efficient offense against the Chiefs, shutting down Kansas City enough times to steal the win.
What stands out to you?
That’s it. That’s the article. The Jets are averaging 3.16 yards per play this year, which is embarrassing beyond belief.
Throug Since 1970, the Jets are just the 8th team to average under 3.2 yards per play of offense through four games, and the first since 1978.
The graph below shows the yards per play gained by each NFL offense since 1970. As you can see, the Jets stick out on the bottom right. The X-Axis shows teams by year, and the Y-Axis shows the yards per play gained by that offense. [continue reading…]
The Washington Redskins are 0-4, and are 15-point underdogs at home today against the Patriots. It is the largest spread the Redskins have ever faced in a home game, topping a 13-point margin against the 1995 Cowboys. A loss today means Washington will have lost 11 of its last 12 games, as the Redskins finished 2018 with a 1-6 mark in the team’s final 7 games once Alex Smith went down.
It certainly feels like a low point in franchise history. And over a long enough time horizon, that’s certainly true: since 1993, Washington has the fourth worst record in the NFL, below even the Cardinals.
The graph below shows the team’s trailing 16-game winning percentage over each 16-game period in franchise history.
Less than a year ago, Washington had a 9-7 record over its previous 16 games. But that was with Smith, and with a head coach who apparently didn’t want the team’s first round quarterback, the team seems as directionless now as it has in years. But take note, Redskins fans: it could be worse. As you can see from the graph above, Washington lost 16 straight games from ’60 to ’61, and went 22 straight games during this stretch without a win.
Tomorrow, the Patriots will be 15-point favorites to win on the road in Washington. This is the third time in four weeks that New England is favored to win by more than two touchdowns. The Patriots had been favored in 69 consecutive games until the 2018 AFC Championship Game, but the Patriots have quickly resumed their usual role as favorites.
The graph below shows the point spread in every Patriots game since 2001. The games are colored based on whether it was a regular season game, a playoff game, or a game without Tom Brady. [continue reading…]
Can this man go 12 more games without an interception?
Since the start of the 2015 season, 62% of all interceptions have come when a team was behind on the scoreboard, 14% in tie games, and the remaining 24% by the team in the lead. The easiest way to avoid throwing interceptions is to take a sack; the second-easiest way is to play with the lead. You might have noticed that since the Saints have become good again, Drew Brees has stopped throwing interceptions.
Wilson, of course, is therefore in a very good position. He takes a lot of sacks and often plays with the lead, which should help to minimize his chances of throwing an interception. He’s also one of the most accurate passers in the NFL, which helps quite a lot, too. Wilson is completing 73.1% of his passes so far in 2019, and he has a career interception rate under 2.0%. Can he go the next 11 games without throwing an interception? It’s been done before, but only once: Tom Brady, during the last 11 games of the 2010 season, is the only quarterback to go 11 straight games without throwing an interception (minimum 10 pass attempts in each game). The next time he took the field, he threw an interception on the first drive of the Patriots playoff game against the Jets, which New England lost. If Brady wasn’t so clutch, that would have looked like he choked in a playoff game. [continue reading…]
Previously:
If you drop back to pass 70 times, it doesn’t matter what the score is: that’s a very pass-heavy game! The Rams had one of the most pass-heavy games of the season on Sunday in a 55-40 loss to Tampa Bay. Los Angeles finished with 70 pass plays versus just 11 runs, an 86.4% pass ratio rarely see in the NFL.

Someone asked: should we hand the ball to Gurley?
Aaron Rodgers and the Packers also had a very pass-heavy game plan in week four. This was a perfectly even game: it was a back-and-forth contest where Green Bay finished with a -0.1 Game Script. Running back Aaron Jones rushed 13 times for only 21 yards, while Rodgers had 53 pass attempts, 1 sack, and 5 scrambles (with zero designed runs). That means the Packers called 59 pass plays and just 15 rushes, although Game Scripts data currently considers scrambles as rushing plays. That’s remarkably pass-heavy for an even game.
Finally, Joe Flacco and the Broncos stood out as pass-happy, too. Denver lost, but led the most of the game and finished with a +4.9 Game Script. Flacco played pretty well, taking no sacks and throwing for 15 first downs and 303 yards on 38 attempts. Perhaps this was a response to my article about how Denver was over-the-top run-heavy in week 3?
The full week 4 Game Script data below: [continue reading…]
There were 14 NFL teams back in 1962, and the starting quarterbacks for 11 of them averaged more yards per pass attempt than the starting quarterbacks for those same teams did in 2018. We learned that in Part I of this series. Today, in Part II, we will look at the evolution of passing efficiency in the NFL since 1940.
In 1962, the league as a whole averaged 7.9 yards per pass attempt. That’s a remarkable figure. So remarkable that it remains the record and is unlikely to be broken anytime soon. The graph below shows the NFL yards per attempt average in each season from 1940 to 2018.
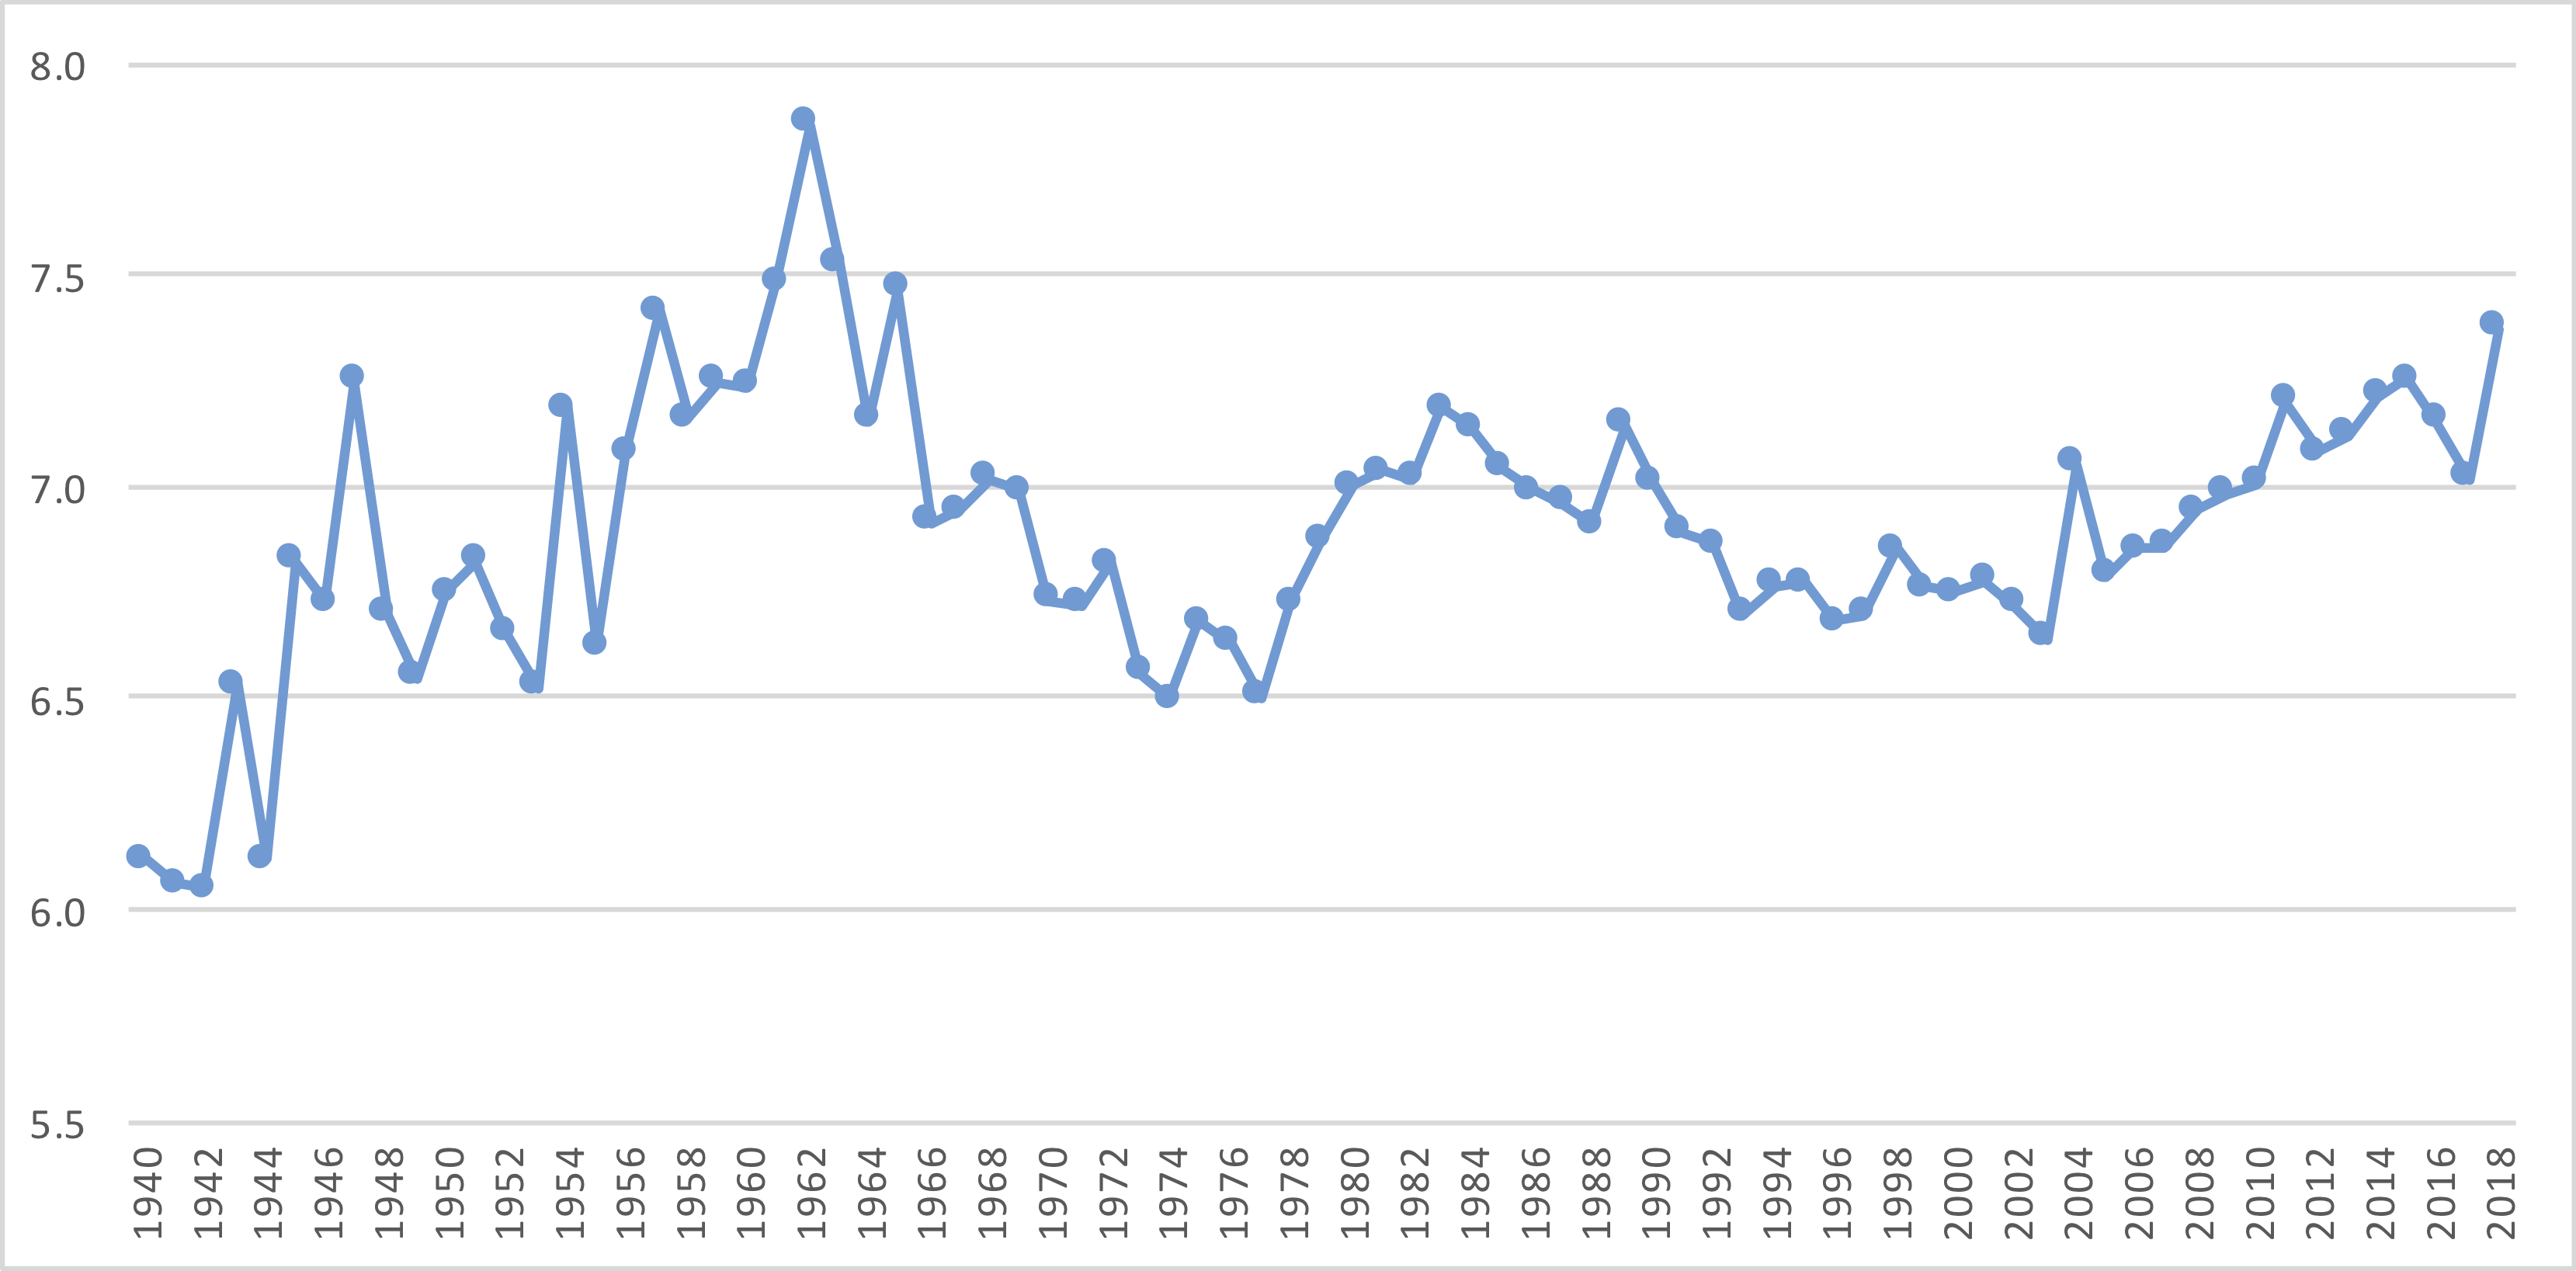 It doesn’t take a long examination to see that the 1962 season is a significant outlier. So what caused this? It helps to begin by breaking down yards per attempt into two components: Completions per Attempt and Yards per Completion; the product of these two statistics is, of course, yards per attempt.
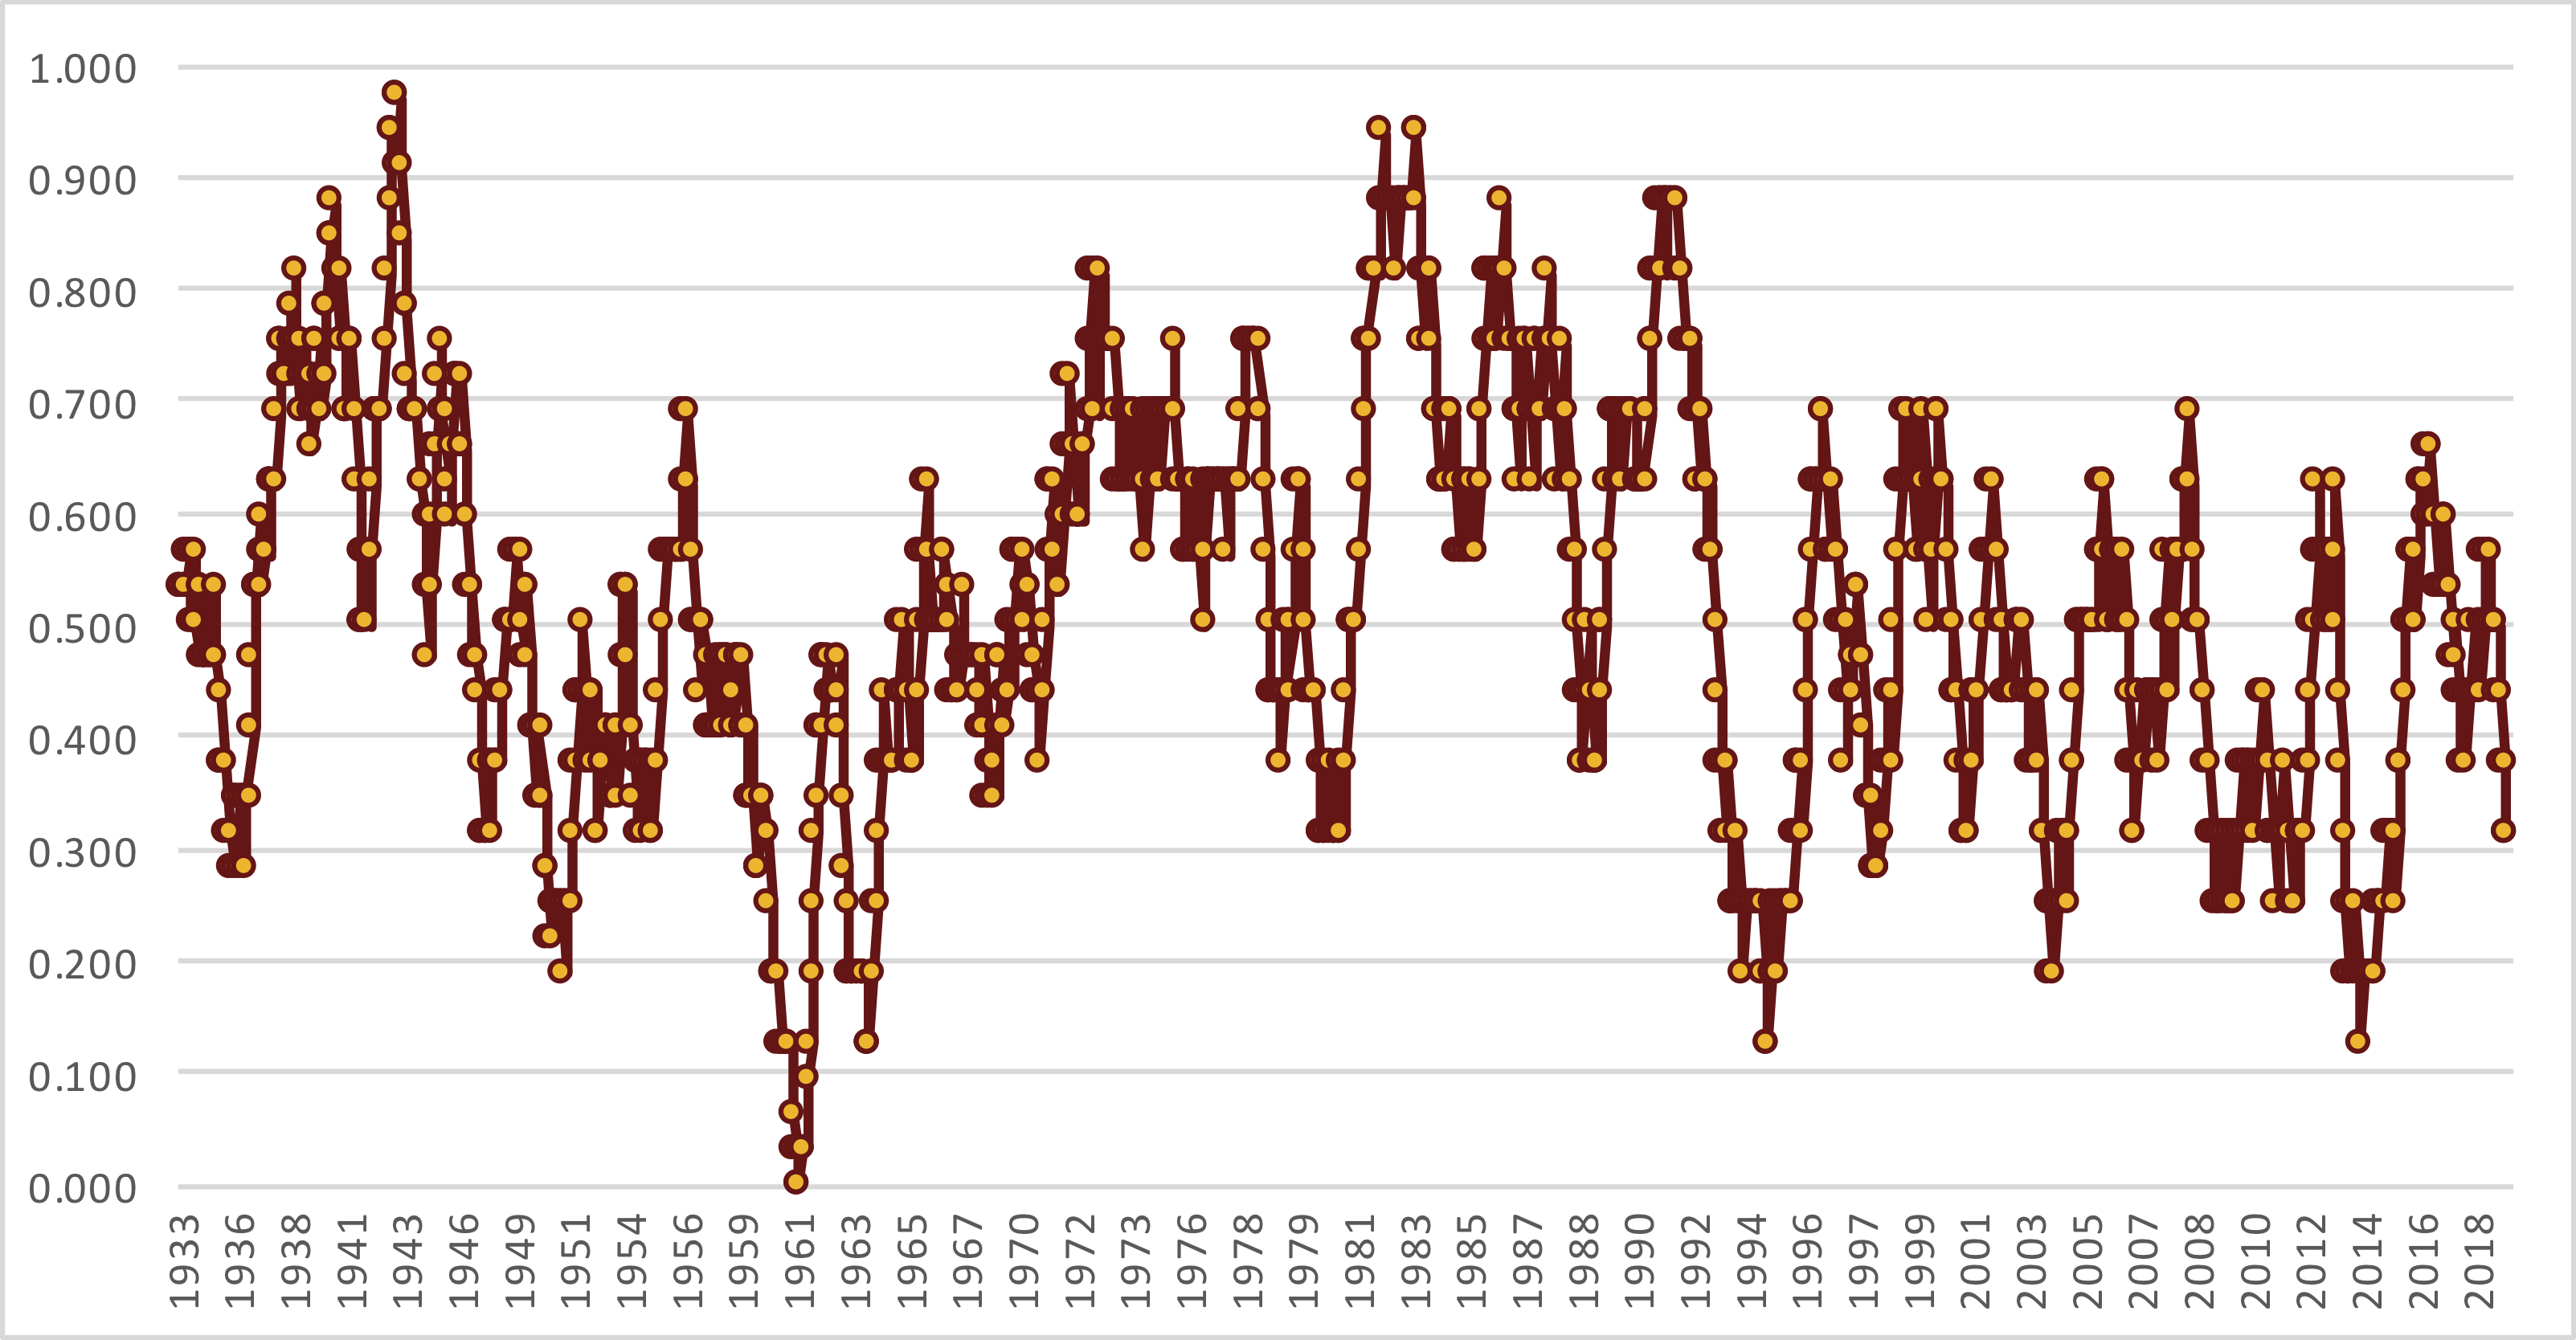
Over the last 80 years, completion percentages have been rising. This is well known, but less discussed is that the average gain on those completed passes — the statistic known as yards per completion — has been steadily falling. The graph below shows the NFL average completion percentage in blue and marked against the Left Y-Axis, and NFL yards per completion average in orange marked against the Right Y-Axis, for each year from 1940 to 2018. The graph forms a jagged X: yards per completion starts up and to the left and ends down and to the right, with completion percentage beginning in the lower left quadrant and ending on the upper right quadrant.
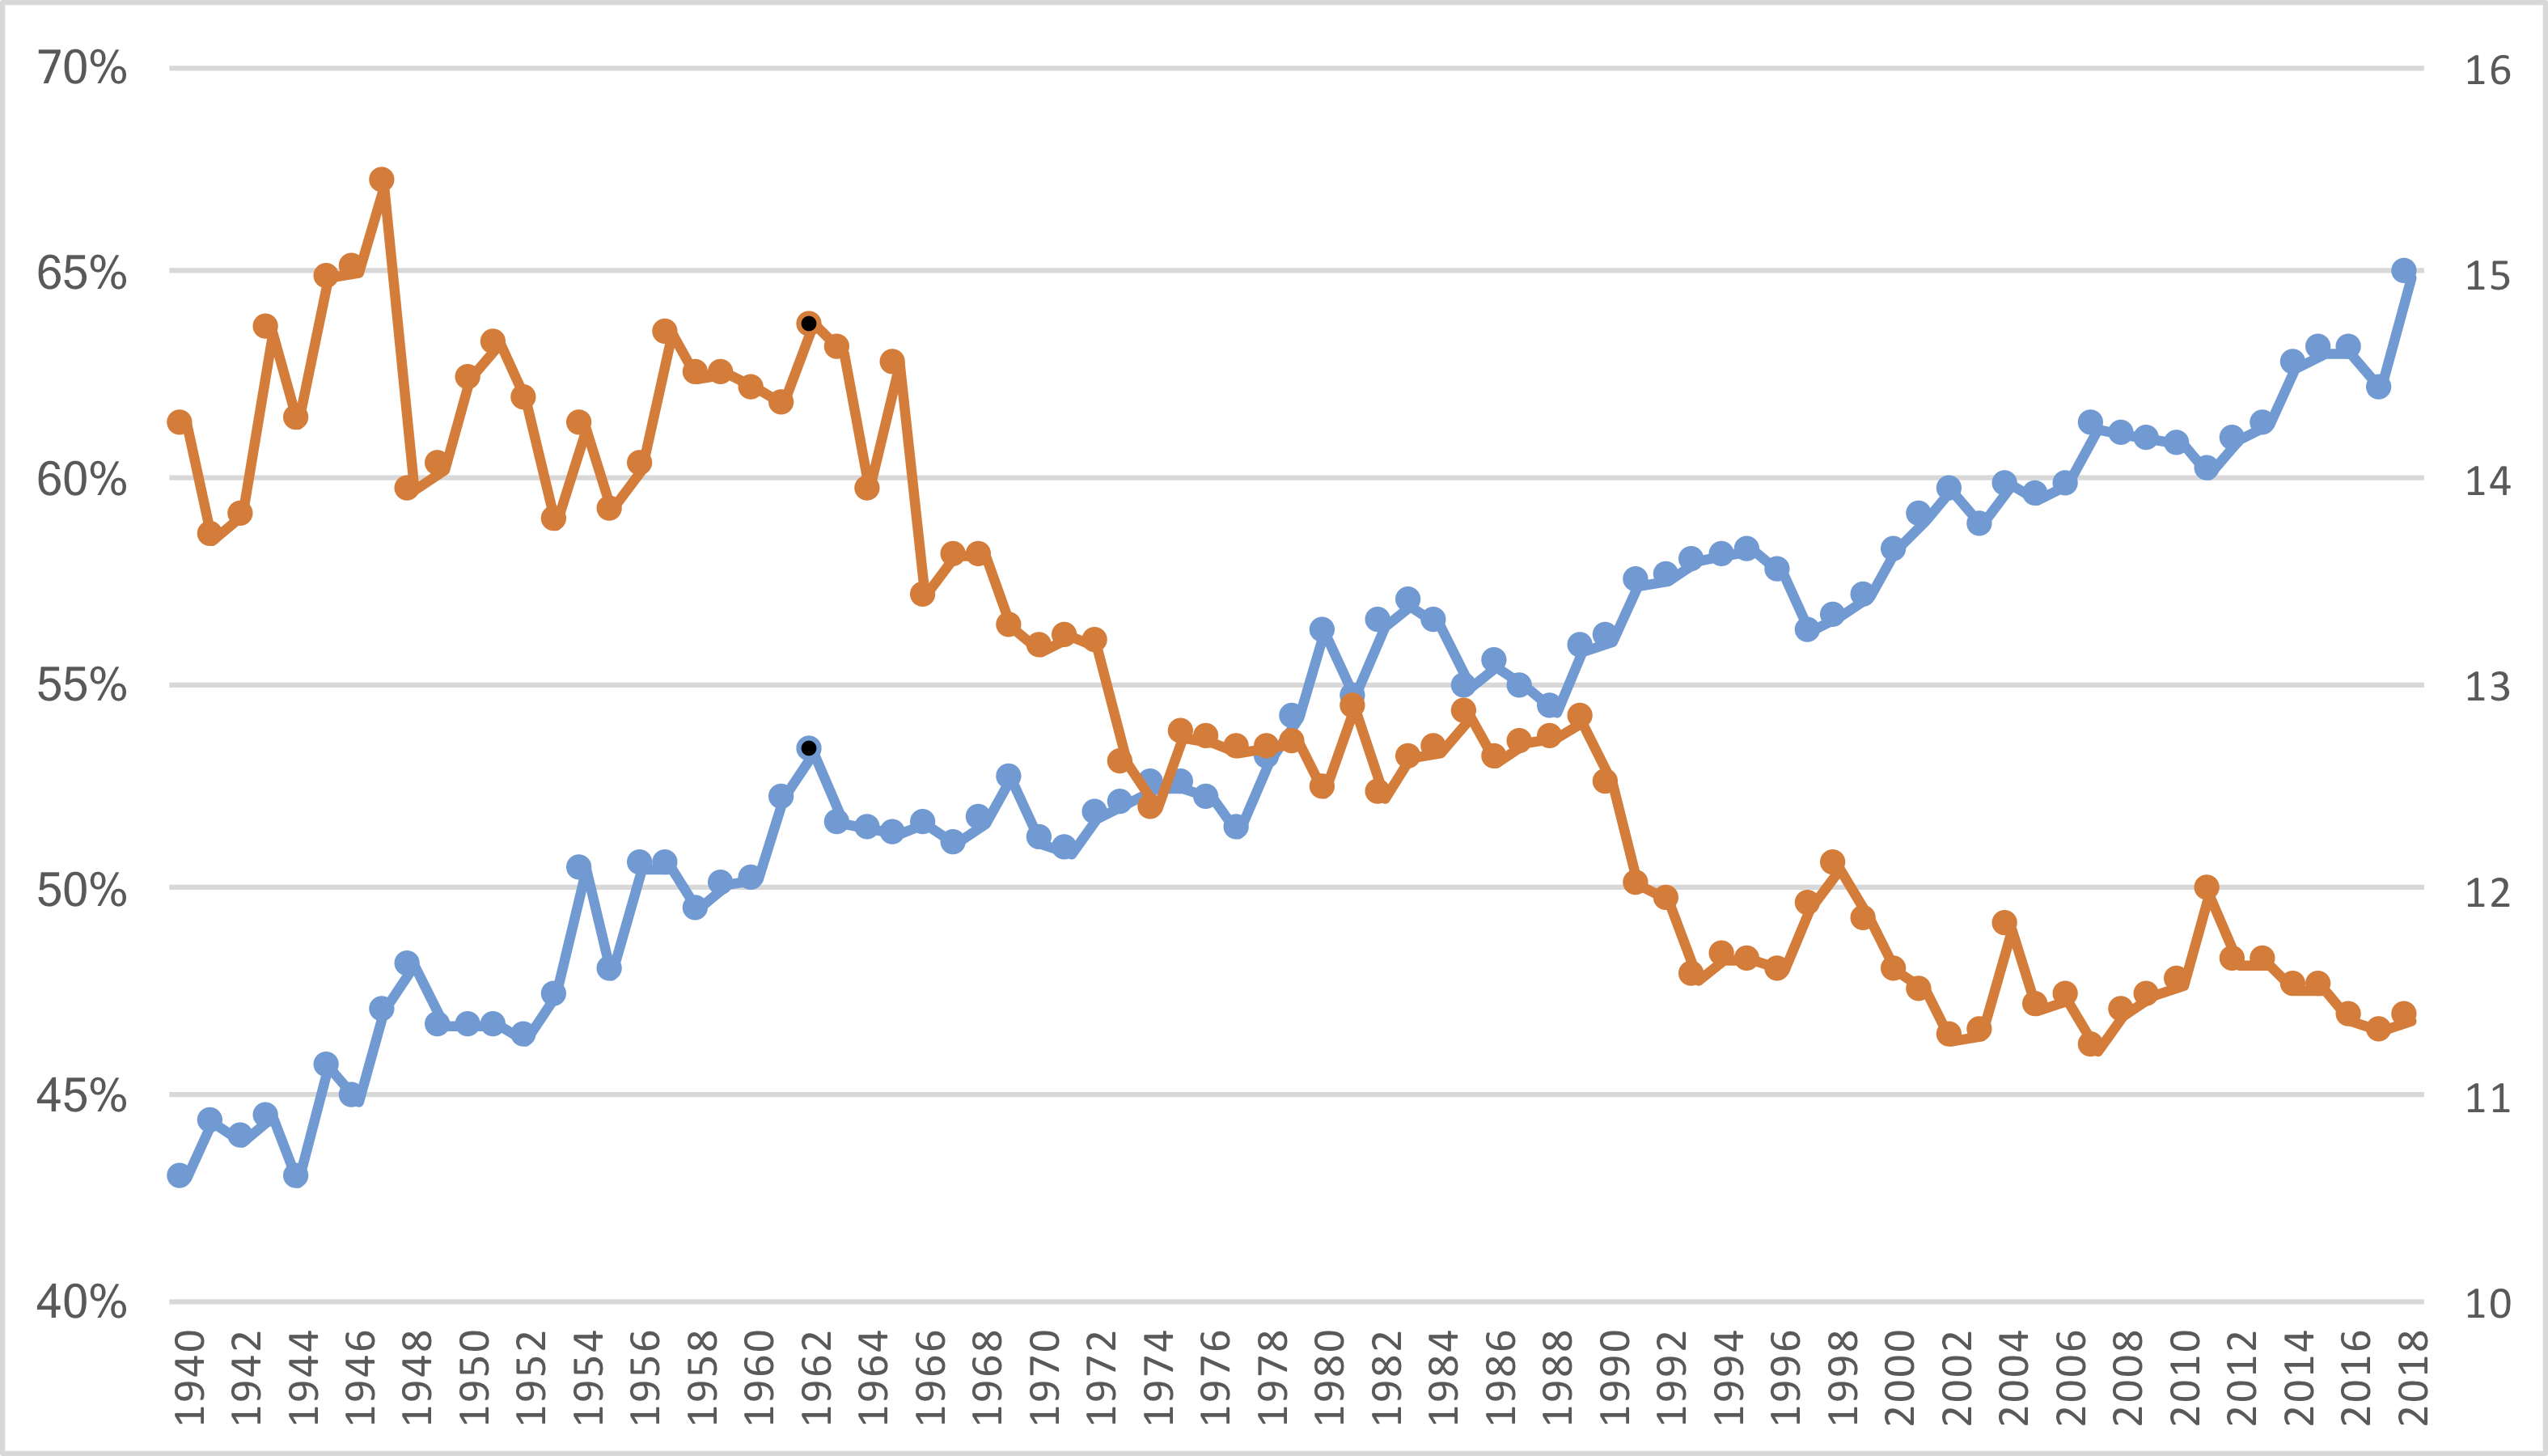 To make it easier for you to see, I shaded the 1962 season in black dots on both lines. There was a large jump in completion percentage in 1962 — in fact, ’62 set the new record for completion percentage in a season at 53%, and that mark wasn’t broken until 1979! On the other hand, this wasn’t shocking for the era: after all, 1961 also set a new record for completion percentage. The 53% rate was notably high and a bit of an outlier, but part of a (still) growing trend towards higher completion percentages year over year.
On the other hand, the 1962 season also represented a reversal of the trend in terms of yards per completion. Teams gained 14.74 yards per completed pass, the 4th-highest since 1940 both at the time and since. And the three higher seasons all had come well over a decade earlier, so this was a true change in the tides. Not only were teams completing more passes than ever, but they were doing so at a rate similar to what happened prior to 1950.
Of course, simple math tells us that if you have an extraordinarily high (for that era) completion percentage combined with an extraordinarily high yards per completion average, that you will wind up with a record-setting yards per attempt average. And that’s exactly what happened. The early 1960s were somewhat of an inflection point in this regard: the top three yards per attempt seasons in NFL history were in 1961, 1962, and 1963! And the 4th-best mark came in 1965.
In the early part of the ’60s, while the AFL was earning a reputation for being a pass-happy league, the NFL was quietly enjoying its most pass efficient seasons in history. And to be clear, all data in this post is NFL-only. But even among this era of rising completion percentages and still-high YPC averages, the ’62 season stands alone. If 1962 didn’t exist, we’d talk about how 1961 and 1963 were remarkably high yards/attempt seasons, but 1962 easily eclipses both of those marks.
Finally, here is the data from every year since 1940, presented in table form.
So what caused all of this? Stay tuned for Part III.