

Jonathan Taylor led the NFL in rushing touchdowns and rushing first downs in 2015.
It was 18 years ago that I first asked the question, why do teams run the ball? And then 11 years ago, I revisited that post. Seven years ago, I wrote Part III of this article bringing the data current through the end of the 2018 NFL season. Today, a further update.
We pondered the original question in 2008 during the nascent era of football analytics. Back then, it was not uncommon to see people comparing yards per pass attempt to yards per rush, noticing that yards per pass attempt was much higher, and then saying it was obvious that teams run way too often (which might have still been the correct conclusion). But that missed a lot. Passing plays come with sacks and interceptions; rushing plays come with rushing touchdowns; and once you account for the full package, the gap between passing and rushing shrunk pretty dramatically. Most interesting was the innate way the NFL evolved: despite NFL teams surely not performing the same data analysis, throughout NFL history (including the pre-merger era), there was a strong relationship between how often teams ran and how efficient running was relative to passing.
Then, in Part II, I updated the analysis with a better way of measuring both passing and rushing efficiency. In Part III, I extended that through the 2018 season. The conclusion then was pretty straightforward: passing had become more efficient than rushing, teams had responded by passing more often, and the relationship between the two was still highly correlated. At this time, it also seemed like passing efficiency was kind of like the housing mark in the early 2000s: it only went up.
So what happened next?
That’s what this post is about.
I’ve updated the four charts from Part III to capture all data through the 2025 season. The results don’t overturn the earlier conclusions, but what happened probably isn’t what I would have predicted seven years ago.
Let’s start with the most basic chart: rushing efficiency versus passing efficiency, by year. [1]To measure rush efficiency, I used Adjusted Yards per Carry, which is calculated as follows: (Rush Yards + 11 * Rush TDs + 9 * Rush First Downs) / (Rushes) For passing efficiency, I used a modified … Continue reading
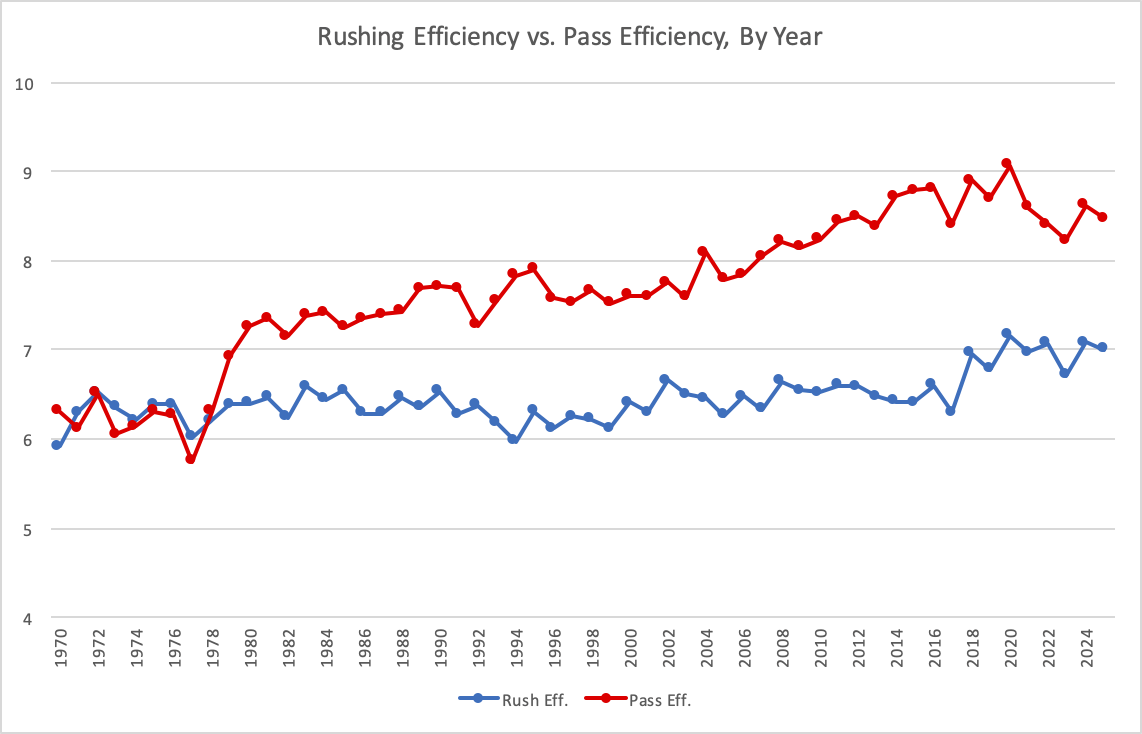
The first thing to note is that, unsurprisingly, passing remains much more efficient than rushing. That was true in 2018, and it’s true in 2025. But the more interesting point is that the gap is now going in the opposite direction. For a while, it felt like the league was moving in only one direction: passing was getting better and better relative to rushing, and teams were following the incentives. That was the story from the post-1978 era through much of the 2000s and 2010s. Passing efficiency kept climbing; rushing efficiency was pretty static, and the result was a league that became more pass-heavy almost every year.
That still describes the long-term picture. But it doesn’t really describe the last several seasons.
Passing efficiency has basically plateaued. Rushing efficiency, meanwhile, has become more efficient. The result is that passing is still better, but perhaps not by quite as much as the most pass-happy years of the modern NFL might have suggested.
That shows up more clearly in the second chart, which is a way to measure how passing efficiency relative to rushing efficiency. The orange line in the chart shows the passing efficiency each year divided by the sum of both rushing efficiency and passing efficiency for that year. For example, if the passing average was 4.0 and the rushing average was 5.0, then you would get 4/9 or 44.4%. If we keep the rushing average at 5.0, but raise the passing average to 5.0, you would get 50%; raise the passing average to 7.5, and you get 60%. So once we are over 50%, it means passing is more efficient than rushing. This is really just a way of asking: if you combine the two, how much of the total “quality” belongs to passing?
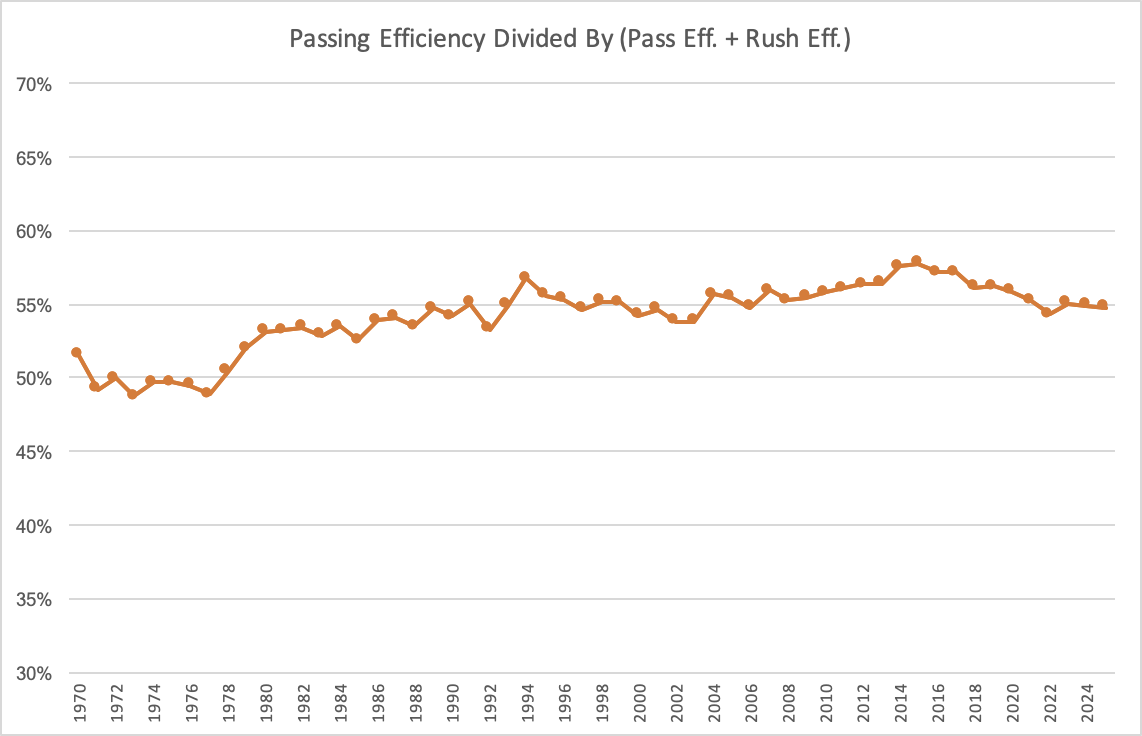
In the early 1970s, that number hovered around 50% (and was below 50% for most of the per-merger period). For most the ’70s, rushing was probably superior to passing once you properly accounted for sacks and interceptions. After the 1978 rule changes — as intended — passing became a much more attractive option. Over time, passing became responsible for more and more of total offensive efficiency.
By the mid-2010s, that ratio was bumping up near 58%, peaking in 2015. That year, teams averaged 8.78 adjusted passing yards per play and just 6.41 adjusted rushing yards per play; that translates to 57.8% by this formula (or a delta of +2.37), the high point in NFL history. This is what just about every analytics writer was saying 10 years ago: passing is way more important than running!
But the updated chart through 2025 shows that this line has not just flattened, but slipped a bit. It still sits in the mid-50s, so passing remains ahead. While the league still leans pass heavy, the dominance of the passing game relative to the rushing game has stopped growing. Said another way, the gap between passing and rushing over the last five years is equal to the gap between passing and rushing in the late 1990s. That would be a very surprising result to anyone who just woke up from a seven year coma, when it looked like there was no end to how large the gap would get between these two ways of moving the football.
Now let’s turn to quantity.
The third chart shows passing plays as a percentage of offensive plays. And if you had asked me after 2018 what I expected this chart to do, I probably would have guessed it would keep inching up. Maybe not every year, but generally. The league was already close to 60% passing, and the logic behind that trend was still sound: passing was more efficient, so why wouldn’t teams keep moving in that direction? Plus, teams had been using a very conservative style of passing — with a heavy emphasis on passes thrown behind the line of scrimmage — to repalce the running game.
Instead, what happened was something a bit different.
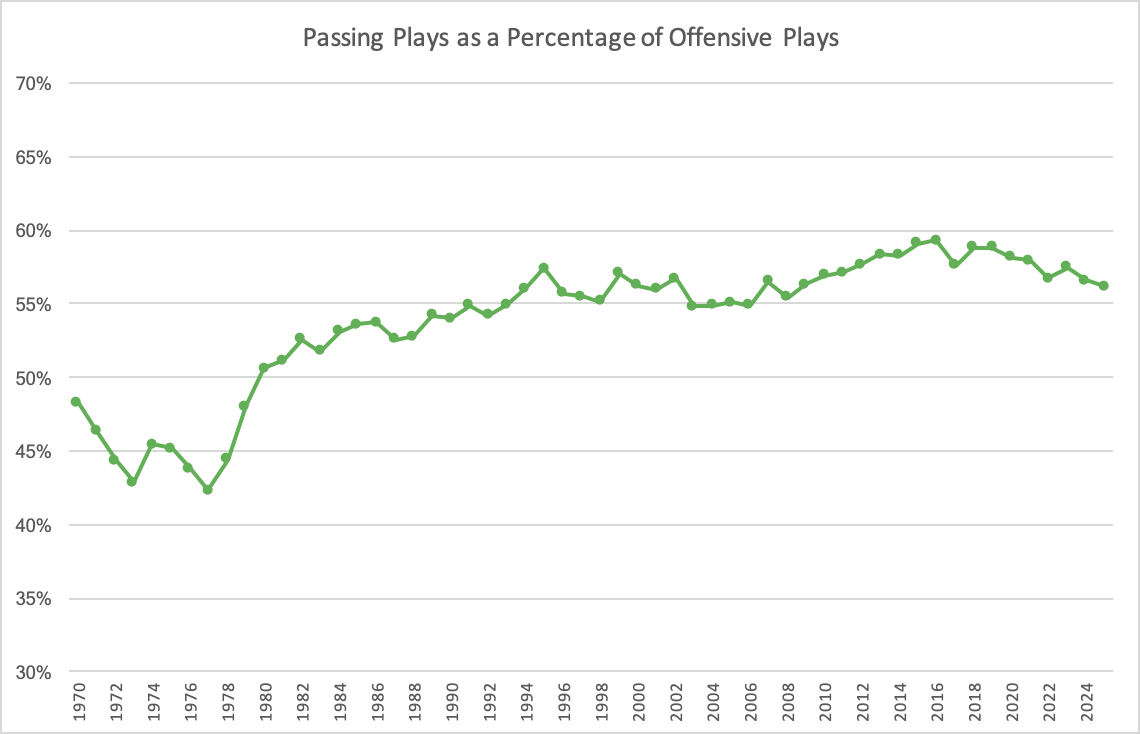
The league’s pass rate rose into the late 2010s, but then it stopped rising. In fact, it backed off. By 2025, teams are still passing more than they run, of course, but not at the highest rates we’ve seen. The peak appears to be behind us, at least for now. The 2016 season, which followed the historic 2015 year with the largest gap between passing and rushing efficiency, represented the high point of passing quantity: that year, NFL teams passed on 59.3% of plays. Consider this: from 2010 through 2025, the two most run-heavy seasons in the NFL have been 2024 (56.6% passing) and 2025 (56.2%). Or this: in 1995, teams passed more frequently than they did in 2025! [2]57.4% in 1995 vs. 56.2% last season.
As in Part III, the most interesting comparison is between the passing share of total efficiency and the passing share of total plays. For a long time, the two moved together. Passing became a bigger share of offensive value, and it became a bigger share of offensive volume. That was the league acting more or less as you’d expect.
And in the post-2018 period, when rushing suddenly became a more viable option, the league responded exactly how we would have predicted. To help isolate today’s update, I’ve included a vertical line to show you the 2018 season.
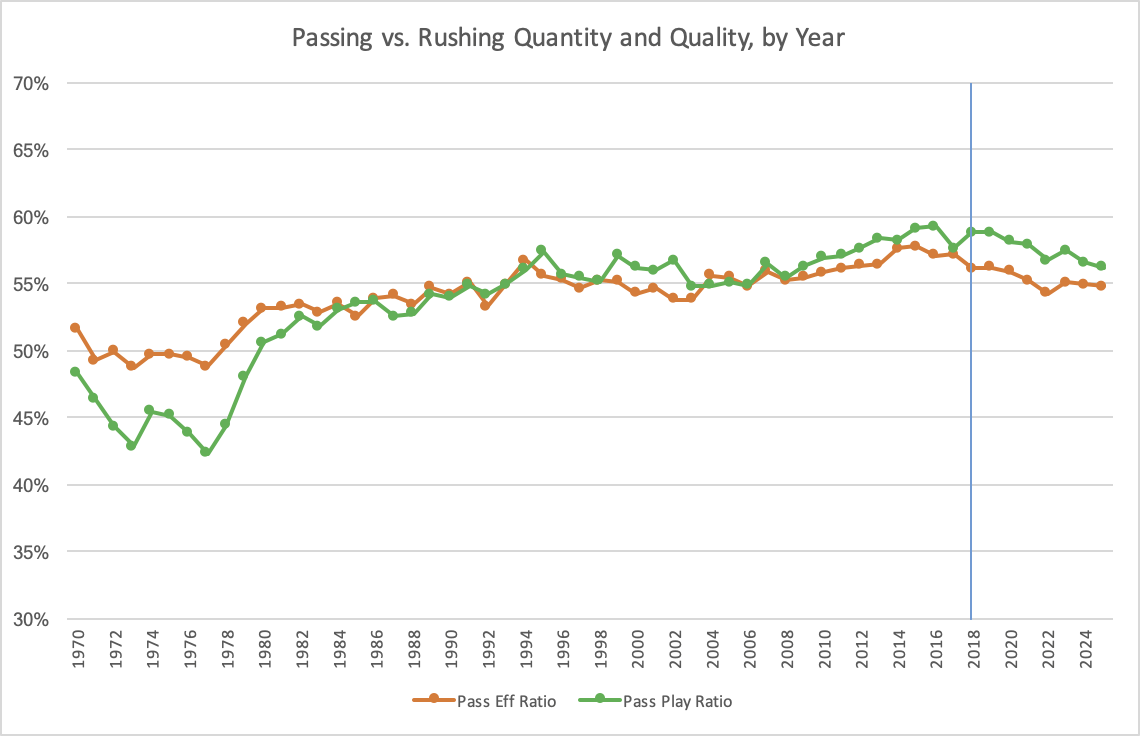
The green line — pass quantity — stays very close to the orange line — pass efficiency — for most of the period. From the 1978 rules changes through 2018, we saw a 40-year period where passing was consistently getting better and NFL teams consistently passed more often as a result. Then, running started to become more efficient, and teams have responded by running more often. And I think that’s the real takeaway from the updated data.
The NFL spent decades learning that passing was more valuable than rushing. Then it spent another couple of decades leaning into that lesson. But by the end of the 2010s, the league may have pushed close to the natural limit of that process.
Of course, a natural question to this is: why? That is outside the scope of this article. [3]One natural answer: NFL quarterbacks themselves are running more often. Another likely reason: If defenses are lighter, running becomes easier. If defenses live in two-high shells, explosive passes … Continue reading But regardless of the reason, what’s clear is once the NFL notices the change, the incentives quickly impact the decision-making.
It is probably a bridge too far to say that coaches are once again focused on “establishing the run” in some old-fashioned sense. We all know we are operating in a world where passing is still king, but it is no longer an unchecked one. If the 2008 version of this argument was “passing isn’t as much better than rushing as you think,” and the 2015 and 2019 versions were “teams pass more because passing really is more efficient,” then the 2025 update is something like this:
Passing is still better. But the league may have already extracted most of the easy gains from passing more.
References
| ↑1 | To measure rush efficiency, I used Adjusted Yards per Carry, which is calculated as follows:
(Rush Yards + 11 * Rush TDs + 9 * Rush First Downs) / (Rushes) For passing efficiency, I used a modified version of ANY/A by also giving credit for first downs. Here’s the formula: (Gross Pass Yards – SackYardsLost + 11 * Pass TDs + 9 * Pass First Downs – 45 * INTs) / (Pass Attempts + Sacks) As a reminder, all touchdowns are recorded as first downs, so this formula actually provides a 20-yard bonus per touchdown on top of however many yards were gained on that scoring play. |
|---|---|
| ↑2 | 57.4% in 1995 vs. 56.2% last season. |
| ↑3 | One natural answer: NFL quarterbacks themselves are running more often. Another likely reason: If defenses are lighter, running becomes easier. If defenses live in two-high shells, explosive passes become harder to find and teams are incentivized to take the easy rushing yards. |