≡ Menu

New York Times, Post Week-4 (2014): Statistical Superlatives

This week at the New York Times, I look at the best players from the first month of the season.

Most Valuable Player: Philip Rivers, San Diego Chargers

The best marriage in football occurred one year ago in San Diego, uniting a coach and a quarterback. In 2012, Philip Rivers had the worst season of his career, prompting the team to fire Norv Turner and replace him with Mike McCoy. In 2013, Rivers was named the comeback player of the year by The Associated Press. He has been exceptional since McCoy arrived.

This year, Rivers leads the N.F.L. in passer rating despite facing Arizona, Seattle and Buffalo, three of the top pass defenses in football. Rivers is completing 70.1 percent of his passes, averaging 8.4 yards per attempt, and sports a sparkling 9-to-1 touchdown-to-interception ratio. Rivers was not only the best quarterback in the N.F.L. in September; he was also the most valuable one.

You can read the full article here.

{ 0 comments }

Worst Coaching Regimes

With another ugly loss, Dennis Allen’s record as head coach of the Raiders has dropped to 8-28. But does this mean Allen’s tenure as Oakland head coach has been one of the worst 10 coaching regimes since the merger?

Not exactly. For starters, we should remember that Allen was dealt a terrible hand. The year before Allen’s arrival, 2011, Oakland didn’t have a first round pick. He inherited one of the worst rosters in the NFL, and didn’t have a first or a second round pick in his first year. In 2013, the Raiders spent only $67M on the players on their roster, courtesy of $50M of dead money on the team’s salary cap. So an 8-28 record, while perhaps not even good considering the circumstances, is hardly all Allen’s fault.

That said, I thought it would be fun to just compare Allen’s record to that of other regimes since the merger, regardless of circumstances. The most common way to do this would be to use straight winning percentage, but that would put Allen behind say, Cam Cameron, who went 1-15 as the Dolphins head coach.

Another method could be to use games under .500 — Cameron would therefore be 14 games below .500, while Allen would be 20 games below. But Jim Schwartz finished 22 games below .500 with the Lions, courtesy of a 29-51 record.  Your mileage may vary, but to me, an 8-28 record is worse than 1-15 and 29-51; the former could be disregarded as just one terrible year, while the latter was much better on a per-game basis. [continue reading…]

{ 19 comments }

The past couple of weeks, I was using a quasi-Elo style rating system to produce college football team ratings. And while after five weeks it is still far too early to put much faith in any computer ratings, we can at least begin framing the discussion of which are the most impressive teams in college football. So, as we did last year, the first edition of the college football SRS ratings are coming out at the end of September. As a reminder, here is the methodology:

1) For each game not played at a neutral site, 3 points are given to the road team. After that adjustment, all wins and losses of between 7 and 24 points are recorded exactly as such. This means that a 24-10 road win goes down as +17 for the road team, -17 for the home team.

2) With one exception, wins of 7 or fewer points are scored as 7-point wins and losses of 7 or fewer points are scored as 7 point losses. So a 4-point home win goes down as +7 (and not a 1) and a 1-point home loss is a -7 (and not a -4). The one exception is that road losses of 3 or fewer (and home wins of 3 or fewer) are graded as ties. So a 21-20 home victory goes down as a 0 for both teams.

3) Wins/Losses of more than 24 points are scored as the average between the actual number and 24. This is to avoid giving undue credit to teams that run up the score. So a 75-point home win goes down as a 48-point win.

Once we have a rating for each team in each game, we then adjust each result for strength of schedule. This is an iterative process, where we adjust the ratings hundreds of times (to adjust for SOS, you have to adjust for the SOS of each opponent, and the SOS of each opponent’s opponent, and so on.) in Excel. Then we produce final ratings, where the SRS rating is the sum of the Margin of Victory and Strength of Schedule in every week.

After five weeks, what are the results? As usual, the table is fully searchable (type “-0″, for example, to see a list of undefeated teams, or SEC to see all SEC teams.) Right now, the number one team is Oklahoma, with an average (adjusted) Margin of Victory of 24.6 points per game against an average opponent that is 43.3 points better than average (average includes all football teams at all levels, so all FBS teams will have a positive grade). Among undefeated teams, the only teams with tougher to-date schedules than Oklahoma are Auburn and UCLA. Below shows the ratings for all 128 FBS teams.

As always thanks to Dr. Peter R. Wolfe for providing the weekly game logs. [continue reading…]

{ 2 comments }

Analyzing NFL SRS Ratings Through 3.0625 Weeks

I thought it would be fun to create NFL SRS ratings through three weeks and one Thursday Night football game. After just 3.0625 weeks, all data are heavily influenced by events that are unlikely to be repeated.  Remember Neil’s old post that showed how for teams with any record, to determine their “true winning percentage”, we need to add 5.5 wins and 5.5 losses. That means through three weeks, a team’s actual record should still be regressed to league average by nearly 80%; in other words, take all these ratings with a big grain of salt.  But there’s no reason not to run the numbers, so here are the customary parameters:

  • Home wins of less than 3 points are treated as ties;
  • For all other games, give the road team 3 points.  From there, wins of fewer than 7 points are treated as 7-point wins;
  • Wins of between 7 and 24 points (after adjusting for home field) are treated as they are.  So a 14-point home win is a 11-point MOV, and a 17-point road win is a 20-point MOV;
  • Wins of greater than 24 points convert to a Margin of Victory that is the average of 24 and the HFA-adjusted MOV.  So the Falcons get a 31.5 for beating Tampa Bay by 42 at home, while the Giants get a MOV of 29 for winning in Washington by 31.

From there, we simple use the typical SRS iteration process to produce a set a season ratings. Those are presented below: [continue reading…]

{ 3 comments }

I am getting some well-deserved crap from people about just how bad my predictions have been so far. The Arizona Cardinals have already somehow outperformed the number of wins I gave them. The Jacksonville Jaguars, my pick to win the AFC South at 8-8, at one point in the game against the Colts had been outscored 112-13 over a stretch of about nine quarters. And my pick to win the NFC North at 14-2 could be 0-3 if Marty Mornhinweg let his head coach call the timeouts. [1]We are talking about the Jets here so they probably would have blown that game, anyway.

But I did win my first Stone-Cold Mega-Lock of the Week with my very comfortable tease of the Bengals and Falcons. So things are looking up and I’m taking that as license to check out some historical betting data for anything that might seem appealing after three weeks.

Last year’s Carolina Panthers are the inspiration for the analysis here. After three weeks, they were a 1-2 team with a big positive point differential. The Panthers last year lost 12-7 to Seattle and 24-23 to Buffalo before annihilating the Giants 38-0. Despite VOA liking the Panthers even after just three games, the betting market came around later in at least one way. The Panthers were at 3/1 to make the playoffs last year after three weeks, even though Football Outsiders had their playoff odds at over 50% at that time.

Is it possible that teams like the 2013 Panthers have historically been undervalued? It seems likely that Carolina was a little undervalued last year after three weeks. By looking at point spread data, we can see if teams that have likely been better than their records have been good bets in the early part of the season. Specifically, I’m going to look at whether betting on early-season underachievers (teams with deceptively poor records) or against overachievers has been profitable now and in the past.

Data and Methods

Feel free to skip this part, but here’s the background for those interested. I have put together Pro Football Reference’s point spread data for all games from 1979 to 2012. This sample is good enough for the tests of long-term and recent betting strategies that I want to do.

I’m going to look at betting outcomes in games 4-8 for teams that are either losing teams (winning percentage below 0.5) with strong Pythagorean records or winning teams with weak Pythagorean records. I will keep things simple and define Pythagorean wins here as:

Pythagorean Wins = (Previous Points Scored ^2.53)/(Previous Points Scored^2.53 + Previous Points Allowed^2.53)

In a continuing effort to avoid unnecessary complications, I’m just going to split the data up over time, looking separately at results before and after 2000.

Betting On and Against Pythagorean Outliers

Below is how you would have done over time if you bet on or against two kinds of teams:

  • Overachievers: Teams with winning records with bad point differentials for their records
  • Underachievers: Teams with losing records with good point differentials for their records

An overachiever is more specifically a team with a winning record that has a Pythagorean winning percentage at least 25 percentage points worse than their actual winning percentage. An underachiever has a Pythagorean winning percentage at least 25 percentage points better than actual.

YearsOverachieving TeamsUnderachieving Teams
1979-1999174-142-11 (55.1%)141-146-5 (50.9%)
2000-2012109-99-4 (52.4%)108-100-8 (52.0%)

The results show that, before 2000, you would have won most of the time betting on overachieving teams, teams that were not as good as their records would suggest. I was surprised by that and it even made me wonder if I made a coding mistake. I certainly expected that any tendency away from an even split would have been in favor of betting against teams with good records and relatively poor point differentials. Note that the even split occurred in the past for the underachievers, the teams with good point differentials and poor records.

More recently, the data come pretty close to an even split for betting both on the overachievers and the underachievers. Betting on the overachievers and the underachievers has been successful about 52% of the time since 1999.

So the overall message is that there is little value now or in the past in identifying Pythagorean outliers and either riding the teams with deceptively poor records or fading the teams with misleadingly good ones. In fact, the only pattern from the past suggested it was a good idea to ride the teams with misleadingly good records. I tried to check this out a bit to just see if it was just betting on teams with good records that was profitable, but betting on all teams with winning percentages over .750 has gone almost exactly dead even over time. It would be great to hear any thoughts you might have in the comments for this pattern. I feel like I’m missing something.

Overall, the message here is the one that we get most of the time if we try to find patterns that might lead to a consistently profitable and simple betting strategy. It just ain’t there. That doesn’t make this a bad post, though: as Chase once noted, an answer of “not useful” is often just as meaningful as any other answers.

The Stone-Cold (I Think There May Be a 60% Chance This Bet Will Win) Mega-Lock of the Week

So I am now 33% on my Stone-Cold Mega Locks of the Week. If I get the next two, I will be at 60%. If I get the next two after that, I’ll be at 71%. I kind of think I should be able to claim extra points already, Chris Berman-style, for my tease last week, since the Falcons and Bengals won by a combined 89-21 score that wasn’t that close. But I will instead put my faith in the always reliable larger sample size that will bear out these predictions living up to their title. [2]Note that no mega-lock promises were made on the season predictions.

Two-team teaser: Pittsburgh down to -1.5 and Indianapolis down to -1.5

This week, I like another two-team teaser of two home teams, this time down to 1.5 points. I particularly like the Steelers down to 1.5 points. I do not understand how they could be the same offense for quarters 3-8 of this season as they were for the other high-efficiency ones. Still, I like the Steelers (#10 in DVOA) at home against the Buccaneers (#32).

I’m a little less sure about the other side of the tease, where I have Indianapolis (#21) over Tennessee (#25). In fact, I mainly just wanted to get the Pittsburgh end of the tease. I may be getting that queasy-knees feeling come Sunday. It’s hard to feel that way about Andrew Luck, but I didn’t imagine I’d ever be going into the water tethered to a Ryan Grigson-led team.

Season record: 1-2

References

References
1 We are talking about the Jets here so they probably would have blown that game, anyway.
2 Note that no mega-lock promises were made on the season predictions.
{ 7 comments }

Are Kickers Faring Worse In 2014?

Does it feel like kicking accuracy is down so far in 2014? Detroit rookie Nate Freese was just 3/7 before the Lions cut him on Monday, with all four misses coming in the 40-to-49 range. Bengals kicker Mike Nugent has also missed four attempts so far this year; for him, a 38-yarder balances out his 55-yard miss, to go along with a pair of unsuccessful tries in the 40-to-49 range.

Tampa Bay placekicker Patrick Murray had a 24-yard attempt blocked in a game Tampa Bay lost by two points. Randy Bullock, the Texans kicker who was Freese before Nate Freese existed, saw his 27-yard attempt blocked by Justin Tuck. [1]Who is not to be confused with the near-automatic Justin Tucker. The Ravens kicker did miss once this year, but we’ll give him a pass since it was a 55-yarder. Eight more kicks were missed in the 30-to-39 range, too, so if you feel like you’ve seen a bunch of missed field goals, well, I won’t tell you how to feel.

But are kickers actually faring worse this year? I broke down field goal attempts in three yard increments (18 to 20, 21 to 23, 24 to 26, etc.) for the first three weeks of each year beginning in 2002. The blue line shows the data from 2002 to 2005, the red line represents kicking from 2006 to 2009, and the green line covers the last four years. Since the data can be choppy, I included larger, smoothed lines, for each four-year period. [continue reading…]

References

References
1 Who is not to be confused with the near-automatic Justin Tucker. The Ravens kicker did miss once this year, but we’ll give him a pass since it was a 55-yarder.
{ 13 comments }

Ryan posted his 2nd monster game in three weeks on TNF.

Ryan posted his 2nd monster game in three weeks on TNF.

In 2013, the largest Game Script was 23.8, courtesy of the Chiefs 45-10 blowout in Washington. But that game was child’s play compared to the NSFW game that was Atlanta/Tampa Bay on Thursday Night.

The Falcons finished with a Game Script of +32.5, the sixth highest in NFL history. Matt Ryan finished the day 21 of 24 for 286 yards and 3 touchdowns. Incredibly, Atlanta turned it over 4 times, although that didn’t stop the Falcons from finishing +1 in the turnover margin.

In a normal week, Indianapolis would stand out for its thrashing of the Jaguars: the Colts posted a Game Script of 19.8, which is even large by Indianapolis/Jacksonville standards. Last year, the Colts finished with Game Scripts of 15.5 and 17.8 against the Jags. What’s weird, though, is that Indianapolis — which has a tendency to get very conservative at times — has thrown on about 60% of its plays in the team’s last three games against the Jaguars, despite monster leads. Andrew Luck fantasy owners, take note, although I’m not quite sure what this says about the Colts mindset.

The Bengals continued their dominant ways in week 3, holding an average margin of victory of 14.8 points against the Titans. Cincinnati had a Game Script of +8.5 in week 2, while the Titans had -8.5 Game Script in week 2, so I guess 8.5 + -8.5 = 14.8? Leave the math to the professional bloggers, folks.

The table below shows the Game Scripts data from each team in Week 3: [continue reading…]

{ 1 comment }

New York Times, Post Week-3 (2014): Arizona Magic

This week at the New York Times, I take a look at the most underrated GM/HC combo in the league: Steve Keim and Bruce Arians. Keim probably should have been the GM of the Year in 2013, while Arians has been dominant against the spread.

In 2012, the Arizona Cardinals won only five games, prompting the organization to make significant changes. Steve Keim was promoted to general manager on Jan. 8, 2013; nine days later, Bruce Arians was hired as Arizona’s next coach. Keim and Arians immediately helped turn around the Cardinals: Despite being in the N.F.L.’s toughest division, Arizona surprisingly won 10 games in 2013. And with a 3-0 start this season, Keim and Arians are again exceeding expectations.

Entering this season, the focus in the N.F.C. West was on the defending Super Bowl champion Seattle Seahawks and the San Francisco 49ers, a team that has played in the N.F.C. championship game in each of the past three years. Las Vegas set Arizona’s projected wins total at only 7.5, a result of a difficult schedule and the significant roster turnover experienced by the team in the off-season. The Cardinals were replacing four of the team’s defensive starters from 2013 — Karlos Dansby, Darnell Dockett, Daryl Washington and Yeremiah Bell — while a fifth, Tyrann Mathieu, is still limited as he recovers from anterior cruciate ligament surgery. A sixth defender and the team’s best pass rusher, John Abraham, is already lost for the season after playing only one game.

You can read the full article here.

{ 0 comments }

Fourth Down Conservatism Rules Week 3

The top-scorer on Harbaugh's fantasy team

The top-scorer on Harbaugh's fantasy team.

It’s become trendy in this space and many others for stats folks to rail against bad 4th down decisions. It’s even trendier to do it when those conservative decisions backfire, leading to losses. But analyzing any decision — and especially decisions about whether to go for it or kick on 4th down — should not be done with the benefit of hindsight. So today, I’m going to rail against John Harbaugh, Bill Belichick, and Mike McCoy, who made some awfully timid 4th down decisions but won on Sunday. And while one could argue that they won because of those decisions, the better argument, I believe, is that they won in spite of them.

Trailing by 4 with 5:03 remaining, the Ravens kick a Field Goal on the 3-yard line

Harbaugh is no stranger to meek 4th down decision making; in fact, he’s no stranger to this particular brand of conservative coaching. Last year, he sent out the kicker when, trailing by 6 points with just over four minutes remaining in the game, the Ravens faced a 4th and 5 from the 6 yard line. Both Jason Lisk and I wrote about the silliness of this decision, which resulted in a Buffalo 23-20 victory.

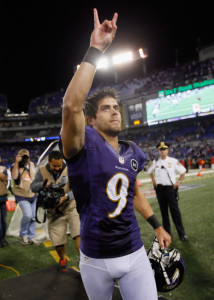
Facing similar circumstances — a 4-point lead and an extra minute remaining makes it less objectionable to kick the field goal, but being on the 3-yard line makes it even worse — Harbaugh again sent out Justin Tucker to take the points.  That decision cost the Ravens 0.22 expected wins; according to Advanced Football Analytics, the decision to kick a field goal instead of going for it dropped Baltimore’s win probability from 54% to 32%.

As Mike Tanier facetiously wrote, this just set up the ultimate Ravens end game: one bomb from Joe Flacco and one kick by Tucker is all the team would need to win.  Sure enough, Flacco hit Steve Smith for a 32-yard catch, and Tucker kicked the chip shot for the win.  The Ravens wound up having two additional possessions: after Tucker made it a 1-point game, the Browns and Ravens traded 3-and-outs, and the Browns went 3-and-out again before giving Baltimore one final possession with 1:58 remaining.

At the time of the decision to send Tucker out for a field goal, Brian Hoyer was 19 of 22 for 290 yards and a touchdown. He wound up throwing incomplete on his last three passes of the day. But if not for two Cleveland three-and-outs — the only two of the day — Harbaugh’s decision to cost his team 22 points of win probability would be generating much more backlash today. [continue reading…]

{ 9 comments }

The Eagles Are 3-0 But In Unusual Fashion

Why are we surprised that the Eagles are winning ugly?

Why are we surprised that the Eagles are winning ugly?

Last week, Neil Paine wrote that while the Eagles were 2-0, it was not all sunshine and rainbows in Philadelphia. The Eagles posted Game Scripts of -7.1 against Jacksonville and -4.8 against Indianapolis; based on Neil’s research, the Eagles had the worst Game Scripts of any team to start 0-2 since at least 1978.

Against Washington in week 3, the Eagles fell behind 17-7 before coming from behind and again emerging victorious. As a result — and after trailing the Jags 17-0 and the Colts 20-6 — Philadelphia became the first team since at least 1940 to start a season 3-0 despite trailing by at least 10 points in each game.

In fact, only three teams had ever overcome a deficit of a touchdown or greater in each of their first three games: the 2000 Rams, the 2000 Jets, and the 1960 Giants. Those teams finished the season 10-6, 9-7, and 6-4-2 respectively, which means they went just 16-17-2 the rest of the season after starting 9-0.

In general, teams that have started 3-0 despite constantly falling behind have not been as successful over the rest of the season as other 3-0 teams. In fact, if you add up the worst margin for each 3-0 team in each game, 25 teams have trailed by an “aggregate” of 21+ points in those three games. On average, those teams won just 53.5% of the remainder of their games. [continue reading…]

{ 3 comments }

Week Four College Football Ratings (2014)

Last week, I unveiled some ELO-style college football ratings. Next week, with five weeks of data, I plan to run the first edition of the traditional SRS ratings. But for one more week, let’s stick with the current format.

Step 1) Twenty-five FBS teams were off in week 3, leaving 103 teams to analyze.

Step 2) In 25 of those matchups, one team had an SRS rating at least 15 points higher than its opponent. In 22 of those games, the favorite one; as a result, there is no change in either team’s rating following that game, so Oregon does not get downgraded for only beating Washington by 7 points on the road. But the three “upsets” include the big surprise of the week: Indiana going into Columbia and upsetting Missouri, 31-27. For those games, we’ll include them in Step 4.

Step 3) After eliminating the 22 heavy favorites who were victorious, there are 81 teams remaining. While some of those games were against FCS schools, 16 of the heavy underdogs in those games were against FBS schools. Since those teams will not have their ratings change, that leaves 65 teams to analyze.

Step 4) For all other teams, I modified each team’s rating following the result of that game, with 85% of the new rating coming from the old rating, and 15% coming from that single game.

Below are the ratings through four weeks. As always thanks to Dr. Peter R. Wolfe for providing the weekly game logs. [continue reading…]

{ 0 comments }

The Historical Archive Page is back!

Easily the best football news of the day:

http://www.footballperspective.com/historical-archive/

There have been 964 posts at Football Perspective. You can now view all of them at the (going forward) always-up-to-date historical archive page. For new readers, there’s a link at the very top of every page to the Historical Archive.

Yes, I am unreasonably happy about its return.

{ 3 comments }

Thoughts on the value of a fumble vs. an interception

In the late ’80s, The Hidden Game of Football determined that an interception was worth -45 yards and a lost fumble was worth -50 yards. Why was a fumble five yards worse than a pick? That’s because Carroll, Thorn, and Palmer found that, on average, the team gained possession via the turnover was five yards closer to their opponent’s end zone when that turnover was a fumble.

Makes sense, but is that still true? Courtesy of Mike Kania of Pro-Football-Reference, here are some data on turnovers since 1999:

  • Ignoring interceptions returned for touchdowns, the team recording the interception loses about 4.41 yards of field position, on average, on each interception. So let’s assume the Patriots are playing the Jets, the Patriots have the ball at their own 40, and New England throws an interception. On average, the Jets will (ignoring pick sixes) have 1st and 10 at the Patriots 44.4-yard line on the next play.
  • If, instead, the Jets gained possession via a fumble, New York would, on average, start on the Patriots 39.2-yard line. That’s because following a fumble by an offense that is not returned for a touchdown, the line of scrimmage moves about 0.8 yards closer to the offense’s end zone.
  • In other words, teams gain about 5.2 yards of field position when recovering a fumble rather than an interception. That’s kind of remarkable, considering it matches the results found from researchers in the ’80s. However…
  • We still have to consider turnovers that are returned for touchdowns.  Roughly 10.7% of interceptions were returned for touchdowns during this period, compared to only 7.9% of recovered fumbles. Remember, interceptions are now much more likely to be returned for touchdowns than they were in the mid-’80s.

Thirty years ago, the penalty was 45 yards for an interception and 50 yards for a lost fumble.  We haven’t shown today whether those numbers in the abstract were correct, but the five yard relative difference still seems supported by current data, with one notable exception.  But as more interceptions are returned for touchdowns [1]I’ll note that fumbles are also being returned for touchdowns at higher rates — that’s probably worth its own post — but it is not increasing at the same rate., interceptions are becoming about as bad for offenses as lost fumbles.

References

References
1 I’ll note that fumbles are also being returned for touchdowns at higher rates — that’s probably worth its own post — but it is not increasing at the same rate.
{ 5 comments }

Guest Post: Introducing Equivalency Rating

Just above these words, it says “posted by Chase.” And it was literally posted by Chase, but the words below the line belong to Bryan Frye, a longtime reader and commenter who has agreed to write this guest post for us. And I thank him for it. Bryan lives in Yorktown, Virginia, and operates his own great site at http://www.thegridfe.com/, where he focuses on NFL stats and history.


In August, I introduced a concept on my site to better adjust the NFL’s passer rating for the league passing environment. I love Pro Football Reference’s use of the Advanced Passing Index for passer rating (Rate+), but it still bothered me that the internal math of the NFL’s formula remained the same.

The NFL’s official passer rating formula is based on four variables: completion percentage, yards per attempt, touchdown percentage, and interception rate. Each of those variables are then used to determine four different variables, as seen below:

A = (Cmp% – .3) * 5
B = (Y/A – 3) * .25
C = TD% * 20
D = 2.375 – Int% * 25

Passer rating is then calculated as follows, provided that each variable is capped at 2.375 and has a floor of zero:

(A + B + C + D)/(0.06)

For each component, a score of 1 represents the ideal average passer. Because the formula is based on a league average completion rate of 50%, modern passers significantly exceed that; pre-modern passers rarely reached it. Similarly, the NFL’s model is based on a 5.5% interception rate and a 5% touchdown rate. Thanks to a Greg Cook injury (and Bill Walsh’s genius reaction to it), those numbers have also changed significantly. Last year, the league interception and touchdown rates were 2.8% and 4.4%, respectively. [continue reading…]

{ 11 comments }

Here is graphic video of a famous football player performing an act of cowardly violence against a defenseless victim. The offender did not receive any penalty for his actions. After committing that crime, the assailant showed no remorse at the condition of the victim, who lay prostrate on the ground. Not disciplined for earlier acts of violence, that player struck again, this time paralyzing his defenseless victim. That victim would eventually die far too young, in part as a consequence of that attack.

For this perpetrator, the response was much worse than insufficient punishment or radio silence. Jack Tatum was celebrated for many of his hits, perhaps most notably the one on Sammy White in Super Bowl XI. The Ray Rice punch makes all of us cringe, but the hit on White―and even more so the one on Darryl Stingley ― should also make us cringe. [continue reading…]

{ 21 comments }

Marshall wonders why the Bears Game Script was so poor.

Marshall wonders why the Bears Game Script was so poor.

It was a week for comebacks in the NFL. Chicago trailed San Francisco 17-0 with just 30 seconds left in the first half, but won 28-20. With 20 minutes left, the Eagles trailed the Colts 20-6, but came back to win 30-27. Midway through the 2nd quarter, the Jets led the Packers 21-3, but Green Bay came back to win, 31-24.

All three games produced Game Scripts by the winning team of between -4 and -7 points. Game Scripts, regular readers know, measure the average points differential over the course of the entire game. Week 2 brought a pair of games with very large game scripts, with Oakland (Game Script of -15.9) and Jacksonville (-15.3) failing to look competitive in losses to houston and Washington, respectively. Minnesota (-11.7) wasn’t much better. Not surprisingly, the Raiders, Jaguars, and Vikings all passed significantly more often than their opponents. [continue reading…]

{ 2 comments }

This week at the New York Times, I take a look at how Andy Dalton and Ryan Fitzpatrick are relying on yards after the catch to produce great efficiency numbers.

Two 2-0 teams have ridden the short-passing game to success. For the Cincinnati Bengals and the Houston Texans, the best players in their passing attacks are not the quarterbacks. As a result, both teams have constructed offenses that focus on high-percentage passes and getting the ball into the hands of their best playmakers.

Bengals quarterback Andy Dalton is averaging 9.1 yards per attempt through two weeks and 13.8 yards per completion; both marks are the highest in the league. But Cincinnati players have averaged 9.2 yards gained after the catch per reception, easily the highest mark in the N.F.L. Running back Giovani Bernard is responsible for 25 percent of Dalton’s passing yards, but most of the credit there goes to Bernard. On his 11 receptions, he has gained 141 yards, with 158 yards coming after the catch (Bernard’s average reception came 1.6 yards behind the line of scrimmage). For wide receiver Mohamed Sanu, 90 of his 120 receiving yards have come after the catch, with the majority of those coming on his long touchdown against Atlanta.

As a result of the efforts of players like Bernard and Sanu, 67 percent of Dalton’s passing yards this season have come after the catch. That is the second highest percentage in the league behind Minnesota’s Matt Cassel. While it is easy to be impressed by Dalton’s gaudy numbers, it is fair to wonder how much of the credit belongs to Dalton and how much belongs to his talented teammates.

You can read the full article here.

{ 3 comments }

Quick Thoughts on the Saints 0-2 Start

No team wants to start the season 0-2. By now you’ve heard the statistic that since 1990, only 12% of teams to start 0-2 have made the playoffs. While that’s true, that’s just one way — and not the only way — to examine the Saints start. That analysis is based on the following idea:

Look at group of teams with the same start –> see how they finish the year

But there’s another way to consider New Orleans’ early season woes. The Saints lost both games on the road. So while New Orleans is 0-2, the team still has 8 home games remaining. Based on the Saints history under Sean Payton, projecting a a 7-1 home record doesn’t seem unreasonable. And while the team lost both games so far, note that Saints opponents have already kicked three game-winning or game-tying field goals at the end of regulation or overtime already. [1]Matt Bryant forced overtime with a 51-yard field goal as time ran out in the 4th quarter, and then won the game for Atlanta in week 1 with a 52-yarder. That’s an amazing feat to have occurred after just two games; from a predictive standpoint, the Saints could just as easily be 2-0. And from a predictive standpoint, a 3-3 finish in road games the rest of the way doesn’t seem unreasonable, either. That would give the team a 10-6 record, and probably a playoff berth. [continue reading…]

References

References
1 Matt Bryant forced overtime with a 51-yard field goal as time ran out in the 4th quarter, and then won the game for Atlanta in week 1 with a 52-yarder.
{ 10 comments }

Checkdowns: Quarterback-Receiver Touchdown Pairings

A good article today from our pal Neil Paine, who asks whether Antonio Gates is the second best tight end in NFL history. I won’t weigh in on that subject, but after catching three touchdowns against the Seahawks on Sunday, Philip Rivers and Antonio Gates have now connected on 63 touchdown passes.

That’s the 10th most in NFL history, and the most by any quarterback/tight end pairing. The table below shows all quarterback-receiver combinations that scored at least 50 touchdown passes, including playoffs (and the AAFC). The final column shows the last year in which the duo scored a touchdown; as you can see, one other active combination is on the list, although Drew Brees and Marques Colston have not connected for a touchdown yet this year. [continue reading…]

{ 15 comments }

Quick Reactions From Week 2 Sunday’s Games

After a really dark week for the NFL, I don’t blame you if you were less excited than usual about this weekend’s games. But there were 14 games to watch on Sunday, and I at least watched a little bit of each game. Here are some quick thoughts, in chronological order.

Buffalo 29, Miami 10

  • Last December, Ryan Tannehill went to Buffalo and proceeded to have one of the worst passing games you could ever have without throwing an interception.  He gained 36 net yards on 34 dropbacks.  In the first half on Sunday, he had… 13 net yards on 14 dropbacks. In the second half, he dropped back to pass 40 times (!) and gained 197 yards. Okay, not the stuff Pro Bowls are built on, but hey, it’s an improvement.
  • EJ Manuel looks to be playing the role of game manager: as long as the Buffalo defense (this week) and running game (last week) play well, that can be a winning formula.  Manuel’s numbers looked good this week, but that was more Sammy Watkins than Manuel.  From what I watched, Watkins (8/117/1) could have had an even bigger game had Manuel been more accurate. Buffalo had just 13 first downs.
  • Plays You Need To Know About: Mike Wallace had a ridiculous catch for a touchdown. C.J. Spiller had a great kickoff return touchdown. Any play involving Sammy Watkins.

[continue reading…]

{ 21 comments }

Week Three College Football Ratings (2014)

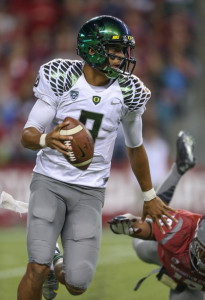
Mariota and the Ducks look as good as any team in the country

Mariota and the Ducks look as good as any team in the country.

Regular readers know that I publish weekly college football ratings using the Simple Rating System. The catch is that the SRS isn’t a viable option in the first few weeks of the season; until we have more interaction among the top teams, we can’t really generate computer ratings.  Frankly, running an SRS program today would be pretty useless.

Consider that a team like Arizona State has played Weber State, New Mexico, and Colorado. Auburn has played Arkansas (the Razorbacks are not very good) and San Jose State. Oklahoma has played Louisiana Tech, Tulsa, and Tennessee (the Vols are not very good). So what can we do?

One thing we could do is to use the concept of Elo Ratings. But calculating Elo ratings in this context is no simple task, and there’s a good chance my buddy Neil is going to do that, anyway, so I thought I would try simpler process. I’ll give a high-level overview of the process here, then present the rankings, and then provide all the nuts and bolts for those interested at the bottom of the post. [continue reading…]

{ 3 comments }

Where Does The NFL Go From Here?

One of the darkest weeks in NFL history continued on Friday; judging by the details of the report of what Adrian Peterson did to his four-year old son, perhaps escalated is a better description.

Peterson. Ray Rice. Greg Hardy. Ray McDonald. The biggest stories of the 2014 season have been about domestic violence. This, after the Richie Incognito-led bullying effort in Miami dominated parts of the 2013 season. And it’s not as though the Jovan Belcher and Aaron Hernandez stories are in the distant past, either.

I don’t know exactly how many fans are questioning what the hell is going on with the NFL. I know I am. Here’s what Mike Tanier had to say earlier this week, identifying exactly why Rice was indefinitely suspended from the league. [continue reading…]

{ 6 comments }

RG3 and Failed Completions

Since 1940, there have been 616 times where a team rushed for at least 125 yards and completed at least 75% of its passes. On Sunday, when Washington pulled off that feat against the Texans, they became the first team to fail to score double digit points in the process.

In the second half, both RG3 and Niles Paul lost fumbles inside the Houston 10-yard line; that obviously contributed to the team failing to score more than 6 points. But Griffin’s 78.4% completion percentage was also pretty misleading. Griffin’s average throw went just 5.8 yards in the air, and his average completion covered just 3.9 yards before including his receiver’s yards gained after the catch. Both of those averages put ranked 30th among 32 qualifying passers. But while short throws can be part of an effective offense, on Sunday, that wasn’t the case for Washington. Consider:

  • A 4th and 10 completion to Roy Helu for 6 yards
  • A 3rd and 16 completion (on the Washington 15) to Helu for 9 yards
  • A 3rd and 13 completion to DeSean Jackson for 0 yards
  • A 2nd and 25 completion to Jackson for 0 yards
  • A 2nd and 19 completion to Pierre Garcon for 3 yards
  • A 2nd and 14 completion to Logal Paulsen for -3 yards
  • A 2nd and 8 completion to Garcon for 3 yards
  • A 2nd and 1 completion to Jackson for 0 yards
  • Four 1st and 10 completions to Jordan Reed, Paulsen, Paul, and Darrel Young for 4, 3, 2, and 1 yard(s), respectively.

Sure, Griffin completed 29 of his 37 passes, but 12 of his completions did little or nothing to help his offense.  He also was sacked three times.  As a result, just 17 of his 40 dropbacks — or 42.5% — were successful completions.

To be fair, this isn’t as much a knock of Griffin as the Washington offense as a whole, or perhaps just a counter to those who like to rely on completion percentage or its brother, passer rating.  If Griffin’s targets could have gained more yards after the catch, things would have looked a lot different.  And against the frightening pass rush of J.J. Watt and company, [1]While Jadeveon Clowney went out early, Whitney Mercilus, Brooks Reed, and Brian Cushing all got to Griffin several times. short passes make some sense.  But looking at Griffin’s completion percentage and concluding he had a good game is kind of silly. Again, more a knock on the misuse of statistics than the player.

Football Outsiders considers a completion that fails to gain a first down on 3rd or 4th down, a completion that fails to gain at least 60% of the distance needed on 2nd down, or a completion that fails to gain at least 45% of the needed yards on 1st down to all be failed completions. Those cut-offs seem reasonable enough to use for theses purposes. Looking at the numbers, Griffin led the NFL in failed completions in week one.

Here’s how to read the table below. In week 1, Griffin completed 29 of 37 passes, producing a completion percentage of 78.4%. However, 12 of his completions were failed completions, as identified above. That means 41.4% of his completions were failed completions. He also took 3 sacks; as a result, just 42.5% of his dropbacks were successful completions. The difference between his raw completion percentage and his SCmp/DB average was 35.9%. [continue reading…]

References

References
1 While Jadeveon Clowney went out early, Whitney Mercilus, Brooks Reed, and Brian Cushing all got to Griffin several times.
{ 6 comments }

Betting Bad: Thinking About Uncertainty in Prediction

Barack Obama was not the only winner in the 2012 presidential election. Nate Silver, now founder and editor in chief of Five Thirty Eight, and other stats-y election forecasters basked in the praise that came when the returns matched their predictions.

But part of the praise was overstated. At the very end, Silver’s models essentially called Florida a toss-up, with the probability of an Obama win going just a few tenths of a percentage point above 50%. But because his model gave Obama the slightest of edges in Florida, his forecast in most of the media essentially became a predicted Obama win there. In addition to accurately forecasting the national popular vote, Silver then received credit for predicting all fifty states correctly.

I am all in favor of stats winning, but the flip side of this is the problem. If Obama had not won Florida, Silver’s prediction―which, like that of other forecasters such as Sam Wang of the Princeton Election Consortium, was excellent―would have been no less good. [1]This is a column about football, but you might want to check out some of the stuff through that link on the differences between Silver and Wang on the upcoming midterm elections. They both know way … Continue reading And if stats folks bask too much in the glow when everything comes up on the side where the probabilities leaned, what happens the next time when people see a 25% event happening and say that it invalidates the model? [2]Of course, maybe Football Outsiders has already run into that with the 2007 Super Bowl prediction. Perhaps sports people are ahead of politics on this stuff.

Lots of people have made this point before — heck, Silver wrote about this in his launch post at the new 538 — but it is really useful to think carefully about the uncertainty in our predictions. Neil has done that with his graphs depicting the distribution of team win totals at 538, and Chase did so in this post last Saturday. Football Outsiders does this in its Almanac every year, with probabilities on different ranges of win totals. [continue reading…]

References

References
1 This is a column about football, but you might want to check out some of the stuff through that link on the differences between Silver and Wang on the upcoming midterm elections. They both know way more than I do, but for the small amount that it is worth, I lean more towards Wang on this one.
2 Of course, maybe Football Outsiders has already run into that with the 2007 Super Bowl prediction. Perhaps sports people are ahead of politics on this stuff.
{ 12 comments }

Week 1 Quarterback Comparison

Am I going to update my stock Fitzpatrick photo now that he's on Houston? What do you think?

Am I going to update my stock Fitzpatrick photo now that he's on Houston? What do you think?

Ryan Fitzpatrick averaged 9.61 Adjusted Net Yards per Attempt in week 1, good enough for the 4th best grade of the week. But the Houston signal caller — who went 14/22 for 206 yards with 1 touchdown, no interceptions, and 1 sack — was not a very good fantasy quarterback. Using the Footballguys.com standard scoring system of 1 point per 20 yards passing, 1 point per 10 yards rushing, 4 points per touchdown pass, and -1 point per interception, Fitzpatrick had just 15.3 fantasy points (he rushed for 10 yards). That tied him for only the 25th best performance by a quarterback in week one.

Obviously there’s a big difference between ANY/A and fantasy points.  But while we use ANY/A as our main metric for lots of reasons, it’s always helpful to compare it to other statistics.  For example, RG3 ranked 17th in ANY/A in week 1, but only 27th in ESPN’s Total QBR. Why is that? Well, Griffin fumbled twice (losing one), and he completed a lot of very short throws (he had the third lowest air yards per throw and air yards per completion).  But another factor is that his third down performance was a bit misleading using conventional metrics, which is something Total QBR is good at identifying.

Griffin gained 75 net yards on 10 third down dropbacks in the game: that’s pretty good, but he only picked up first downs on 3 of 10 opportunities.   He had a 48-yard completion on a 3rd-and-7, which is great, but it also inflates his average gain; he also had a pair of 9 yard completions on third and very long that added little value.

We can also look at Football Outsiders’ main efficiency metric, DVOA, and compare that to other statistics.  Matt Cassel is an interesting player to analyze.  In DVOA, he ranked 5th.  In ANY/A, he ranked 10th.  In Total QBR, he was 15th, and in fantasy points, he was 21st!   So what gives?

As noted by Vince Verhei, Cassel’s “average pass traveled just 4.8 yards past the line of scrimmage, nearly a full yard shorter than the next shortest quarterback (Derek Carr, 5.6).” That would explain why QBR would be less high on Cassel than other statistics.  And since Cassel threw just 25 passes for only 170 yards, his fantasy value won’t be very high. Football Outsiders, on the other hand, gives Cassel credit for things like his a 9-yard pass on third-and-10 that created better field goal range.  Overall, comparing what Cassel did to the baseline, he looks really good according to FO, and just pretty good according to QBR.  As for ANY/A, it’s impressed by his 2 TD/0 INT ratio, but it’s hard to get a great ANY/A grade when you are averaging just 10.0 yards per completion.

The table below shows each quarterback’s stats in each metric.  For example, Matthew Stafford averaged 11.55 ANY/A in week 1, scored 31.5 fantasy points, had a Total QBR of 97.5, and a DVOA of 90.3%.  Those ratings, among the 33 quarterbacks in week 1 (curses, Rams!), ranked him 1st in ANY/A, 3rd in fantasy points, 1st in QBR, and 1st in DVOA, for an average rank of 1.5. [continue reading…]

{ 37 comments }

Advanced Football Analytics Podcast: Appearance #3

I was invited back for a third visit over at the Advanced Football Analytics (formerly Advanced NFL Stats) podcast. You can click here to listen to me and Dave Collins discuss the Jets, Game Scripts, some week three predictions, and more. Give it a listen; the AFA podcast is great, and I’d recommend listening to it every week (you can click the following links to subscribe for free to the AFA Podcast on iTunes or Stitcher.)

{ 2 comments }

Regular readers are familiar with the concept of Game Scripts, the term I’ve used to represent the average margin of lead or deficit over the course of every second of a game. Let’s use the Washington/Houston game (since it featured just four scoring plays) to explain how to calculate the Game Script score.

The first score of the game came with 6:11 left in the second quarter, when Darrel Young rushed for a touchdown (the extra point was blocked, of course, by J.J. Watt).  This means for the first 23 minutes and 49 seconds, the score was tied.  On Houston’s ensuing drive, Ryan Fitzpatrick hit DeAndre Hopkins for a 76-yard touchdown with 4:28 left in the half.  That means Washington held a 6 point lead for only one minute and 43 seconds.

After a three-and-out, Washington’s punt was blocked, and Alfred Blue recovered, giving Houston a 14-6 lead with 2:09 left in the half.  This means that Houston held a 1-point lead for two minutes and 19 seconds.

Then, the Texans held that 8-point lead for just over 30 minutes: Houston kicked a field goal right at the two minute warning, and ultimately won, 17-6.

Now, to calculate the Game Script, all you need to do is average the Texans’ margin over the course of the 3600 seconds in the game. As you can see in the table below, that number is 4.3. [continue reading…]

{ 7 comments }

The weekly New York Times posts are back! This week, I look at how unusual it is for the Patriots to occupy the AFC East cellar.

After seven months without meaningful football, it is easy to overreact over the first week of the N.F.L. season. This does not mean Week 1 is unimportant; it is as important as any other week.

Still, what happened Sunday, at least in the American Football Conference East, was not any less extraordinary. For only the third time in a single week since 2001, the Patriots lost while the Jets, the Dolphins and the Bills won. The other times that happened were Week 6 in 2012 and Week 15 in 2004. New England ran away with the division title in both of those years, so do not declare the king dead just yet. But to put that statistic in perspective, consider that there have been 17 weeks since 2001 when the Patriots won while the Jets, the Dolphins and the Bills lost.

To understand the A.F.C. East is to understand its history. New York, Buffalo and Miami finished with a better record than New England in 2000. Since then, none of them has. Recent history shows this to be a remarkably stable division: in fact, the 2013 A.F.C. East had the fewest changes in wins of any division from one year to the next since the N.F.L. realigned divisions in 2002. The Patriots have long been the overlord of the division; most expected more of the same in 2014, but it may be time to re-examine that narrative.

You can read the full article here.

{ 3 comments }

Temporary Archive Page

As regular readers know, the site is currently in somewhat of a transition period, at least from a tech standpoint. Rest assured, content will continue to flow on a daily basis (at a minimum) while we fix things on the back end.

One of the current casualties is the archive page, which is one of the favorite pages on the site both for me and many readers. The archive page provides a simple listing of every post ever published on the site. Well, I’ve created this temporary archive page, which includes every post (except this one) through September 9, 2014. Hopefully, this helps you folks out in the short-term, and thank you for sticking around during this maintenance period. [continue reading…]

{ 0 comments }

Hurns was part of a big Jaguars first quarter

Hurns was part of a big Jaguars first quarter

Jacksonville’s Allen Hurns led all players in the preseason with 232 receiving yards. The 6’3, 195 receiver had a breakout senior year with Miami(FL) — in fact, he set a school record for receiving yards in a season — but that was not enough to get him selected in May’s draft.

We know that the Jaguars spent some time watching tape of the Miami offense, since Jacksonville used a third round pick on Hurricanes guard Brandon Linder. Perhaps that tipped them off to Hurns, who provided immediate returns in week one. What sort of returns?

  • Hurns caught four passes for 110 yards and two touchdowns against the Eagles in week one. Prior to the Calvin Johnson explosion on Monday night, those numbers put Hurns tied for fifth in the league in receiving yards, and tied for second in receiving touchdowns.
  • Hurns became just the 5th player since 1970 to hit the 100-yard receiving mark and catch two touchdowns in week one of his rookie season.
  • Hurns produced the 2nd best performance by an undrafted rookie wide receiver in a season opener since the merger.

[continue reading…]

{ 9 comments }
Previous Posts