
Good bit of trivia from my buddy Scott Kacsmar: there were 71 interceptions returned for touchdowns in 2012, the highest number in NFL history. Another interesting fact about the 2012 season: just 2.6 interceptions were thrown per 100 attempts, the lowest figure in NFL history.
We already know that the league-wide interception rate has been rapidly decreasing for years, but the significant increase in interceptions returned for touchdowns per interception is an under-reported story. Last year was the year of the Pick Six, but the Pick Six rate (INTs returned for touchdowns per interception) has been on the rise for several years. The graph below shows both the interception rate (100*INTs/Att) in blue (and measured against the left vertical axis) and the Pick Six rate (100*INT TDs/INT) in red (and measured against the right vertical axis):
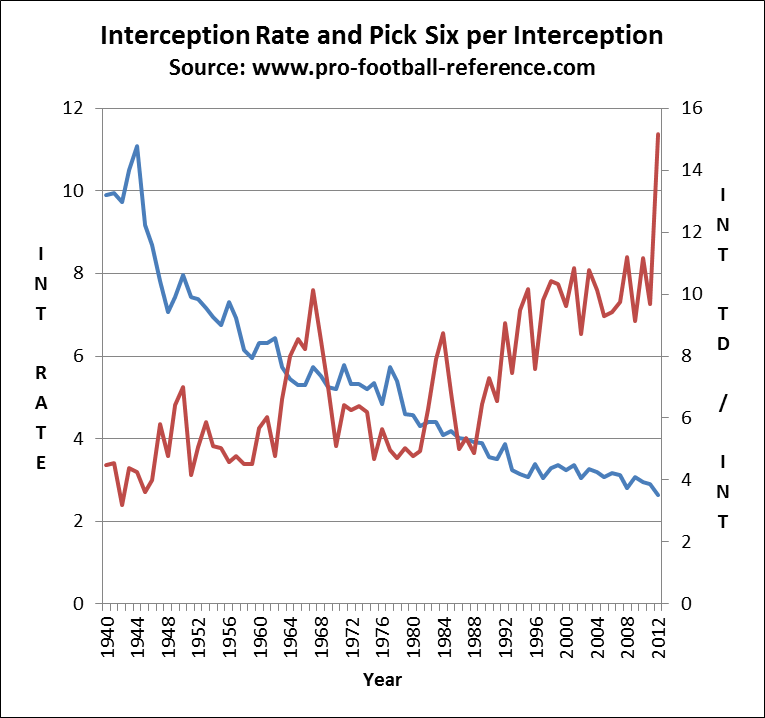
As to “why” the Pick Six rate has risen, I don’t think it’s all that hard to figure out. It isn’t a coincidence that interception rate is decreasing while Pick Six rate is increasing; both metrics are influenced, I suspect, by the increase in the prevalence of the short passing game in the NFL. When Daryle Lamonica and Joe Namath were throwing deep every other pass, the likelihood of a pick-six was pretty low; the defensive back who would intercept the pass would be far from the offense’s end zone and likely to catch the ball while falling down or in a crowd. Now, though, defensive backs can jump on shorter pass routes and have literally nobody between them and the end zone on some interceptions.
Andy Dalton and Matthew Stafford led the way with four pick sixes last year, although eight other quarterbacks threw three interceptions that were returned for touchdowns. And before you blame Mark Sanchez, he only threw one last year! [1]Although he had three in 2011 and two more fumbles returned for TDs that year. The 15% Pick Six rate in 2012 is likely unsustainable, but the steady climb isn’t a fluke. The short passing game is driving the increase – at least, in my opinion. But there are probably other factors at play, so I’ll open this up to the crowd: Why do you think the Pick Six rate is rising?
I’ll close with the data from the graph in table form:
| Year | INT TD | INT | G | INT/G | ATT | INT RT | PK 6 RT |
|---|---|---|---|---|---|---|---|
| 2012 | 71 | 468 | 512 | 0.91 | 17788 | 2.6% | 15.2% |
| 2011 | 49 | 506 | 512 | 0.99 | 17410 | 2.9% | 9.7% |
| 2010 | 57 | 511 | 512 | 1 | 17269 | 3% | 11.2% |
| 2009 | 48 | 525 | 512 | 1.03 | 17033 | 3.1% | 9.1% |
| 2008 | 52 | 465 | 512 | 0.91 | 16526 | 2.8% | 11.2% |
| 2007 | 52 | 534 | 512 | 1.04 | 17045 | 3.1% | 9.7% |
| 2006 | 49 | 520 | 512 | 1.02 | 16389 | 3.2% | 9.4% |
| 2005 | 47 | 506 | 512 | 0.99 | 16464 | 3.1% | 9.3% |
| 2004 | 53 | 524 | 512 | 1.02 | 16354 | 3.2% | 10.1% |
| 2003 | 58 | 538 | 512 | 1.05 | 16493 | 3.3% | 10.8% |
| 2002 | 46 | 528 | 512 | 1.03 | 17292 | 3.1% | 8.7% |
| 2001 | 59 | 545 | 496 | 1.1 | 16181 | 3.4% | 10.8% |
| 2000 | 51 | 531 | 496 | 1.07 | 16322 | 3.3% | 9.6% |
| 1999 | 58 | 562 | 496 | 1.13 | 16760 | 3.4% | 10.3% |
| 1998 | 53 | 509 | 480 | 1.06 | 15489 | 3.3% | 10.4% |
| 1997 | 47 | 479 | 480 | 1 | 15729 | 3% | 9.8% |
| 1996 | 41 | 542 | 480 | 1.13 | 15966 | 3.4% | 7.6% |
| 1995 | 52 | 512 | 480 | 1.07 | 16699 | 3.1% | 10.2% |
| 1994 | 45 | 474 | 448 | 1.06 | 15056 | 3.1% | 9.5% |
| 1993 | 35 | 469 | 448 | 1.05 | 14414 | 3.3% | 7.5% |
| 1992 | 47 | 519 | 448 | 1.16 | 13408 | 3.9% | 9.1% |
| 1991 | 32 | 488 | 448 | 1.09 | 13950 | 3.5% | 6.6% |
| 1990 | 35 | 480 | 448 | 1.07 | 13516 | 3.6% | 7.3% |
| 1989 | 36 | 559 | 448 | 1.25 | 14338 | 3.9% | 6.4% |
| 1988 | 27 | 553 | 448 | 1.23 | 14131 | 3.9% | 4.9% |
| 1987 | 29 | 540 | 420 | 1.29 | 13491 | 4% | 5.4% |
| 1986 | 29 | 581 | 448 | 1.3 | 14469 | 4% | 5% |
| 1985 | 41 | 602 | 448 | 1.34 | 14423 | 4.2% | 6.8% |
| 1984 | 51 | 584 | 448 | 1.3 | 14325 | 4.1% | 8.7% |
| 1983 | 49 | 620 | 448 | 1.38 | 14047 | 4.4% | 7.9% |
| 1982 | 22 | 349 | 252 | 1.38 | 7933 | 4.4% | 6.3% |
| 1981 | 30 | 609 | 448 | 1.36 | 14180 | 4.3% | 4.9% |
| 1980 | 30 | 627 | 448 | 1.4 | 13705 | 4.6% | 4.8% |
| 1979 | 30 | 597 | 448 | 1.33 | 12979 | 4.6% | 5% |
| 1978 | 30 | 639 | 448 | 1.43 | 11829 | 5.4% | 4.7% |
| 1977 | 28 | 562 | 392 | 1.43 | 9786 | 5.7% | 5% |
| 1976 | 28 | 497 | 392 | 1.27 | 10260 | 4.8% | 5.6% |
| 1975 | 25 | 533 | 364 | 1.46 | 9973 | 5.3% | 4.7% |
| 1974 | 31 | 500 | 364 | 1.37 | 9609 | 5.2% | 6.2% |
| 1973 | 30 | 470 | 364 | 1.29 | 8845 | 5.3% | 6.4% |
| 1972 | 30 | 480 | 364 | 1.32 | 9011 | 5.3% | 6.3% |
| 1971 | 35 | 544 | 364 | 1.49 | 9412 | 5.8% | 6.4% |
| 1970 | 26 | 510 | 364 | 1.4 | 9796 | 5.2% | 5.1% |
| 1969 | 38 | 544 | 364 | 1.49 | 10377 | 5.2% | 7% |
| 1968 | 47 | 554 | 364 | 1.52 | 10034 | 5.5% | 8.5% |
| 1967 | 60 | 593 | 350 | 1.69 | 10329 | 5.7% | 10.1% |
| 1966 | 44 | 535 | 336 | 1.59 | 10090 | 5.3% | 8.2% |
| 1965 | 41 | 480 | 308 | 1.56 | 9059 | 5.3% | 8.5% |
| 1964 | 40 | 501 | 308 | 1.63 | 9187 | 5.5% | 8% |
| 1963 | 34 | 514 | 308 | 1.67 | 8954 | 5.7% | 6.6% |
| 1962 | 27 | 567 | 308 | 1.84 | 8812 | 6.4% | 4.8% |
| 1961 | 34 | 564 | 308 | 1.83 | 8922 | 6.3% | 6% |
| 1960 | 28 | 493 | 268 | 1.84 | 7813 | 6.3% | 5.7% |
| 1959 | 10 | 221 | 144 | 1.53 | 3714 | 6% | 4.5% |
| 1958 | 11 | 243 | 144 | 1.69 | 3951 | 6.2% | 4.5% |
| 1957 | 11 | 231 | 144 | 1.6 | 3339 | 6.9% | 4.8% |
| 1956 | 11 | 240 | 144 | 1.67 | 3282 | 7.3% | 4.6% |
| 1955 | 13 | 258 | 144 | 1.79 | 3820 | 6.8% | 5% |
| 1954 | 15 | 294 | 144 | 2.04 | 4232 | 6.9% | 5.1% |
| 1953 | 18 | 306 | 144 | 2.13 | 4267 | 7.2% | 5.9% |
| 1952 | 15 | 297 | 144 | 2.06 | 4024 | 7.4% | 5.1% |
| 1951 | 12 | 288 | 144 | 2 | 3881 | 7.4% | 4.2% |
| 1950 | 24 | 343 | 156 | 2.2 | 4307 | 8% | 7% |
| 1949 | 25 | 389 | 204 | 1.91 | 5238 | 7.4% | 6.4% |
| 1948 | 20 | 419 | 232 | 1.81 | 5921 | 7.1% | 4.8% |
| 1947 | 24 | 414 | 232 | 1.78 | 5292 | 7.8% | 5.8% |
| 1946 | 16 | 399 | 222 | 1.8 | 4596 | 8.7% | 4% |
| 1945 | 7 | 193 | 100 | 1.93 | 2107 | 9.2% | 3.6% |
| 1944 | 10 | 234 | 100 | 2.34 | 2114 | 11.1% | 4.3% |
| 1943 | 8 | 182 | 80 | 2.28 | 1732 | 10.5% | 4.4% |
| 1942 | 7 | 219 | 110 | 1.99 | 2249 | 9.7% | 3.2% |
| 1941 | 10 | 220 | 110 | 2 | 2210 | 10% | 4.5% |
| 1940 | 10 | 223 | 110 | 2.03 | 2254 | 9.9% | 4.5% |
References
| ↑1 | Although he had three in 2011 and two more fumbles returned for TDs that year. |
|---|