≡ Menu

Lowery, Anderson, Andersen, and Stenerud In Four Charts

A couple of years ago, I wrote about the best field goal kickers in NFL history. That was a threepart series where I measured how accurate each field goal kicker has been after adjusting for era and distance. The result? Nick Lowery was, by a clear margin, the most valuable field goal kicker in NFL history. He made kicks at a rate nearly 10% higher than league average after adjusting for era and distance, an astonishing level of success considering his reputation hasn’t quite matched his production.

Today, I wanted to update that post and also provide a comparison of the four men generally considered in contention for the title of top field goal kicker in history: Jan Stenerud, the first pure placekicker to make the Hall of Fame, Morten Andersen, who became the second such Hall of Famer this year, Nick Lowery, my choice for the best kicker ever, and Gary Anderson, who had a long and distinguished career.

I used a simple methodology this time around to compare the four kickers: I catalogued all field goal attempts in NFL history into five yard ranges (i.e., 40-44, 45-49, 50-54, etc.). Then, I looked at the league average success rate that season and calculated the expected number of field goals an average kicker would be expected to make from that range. So if the league average rate on kicks from 40-44 yards was 75%, a kicker with 8 field goal attempts from that rage would be “expected” to make 6 of those attempts. Finally, I calculated how many field goals each kicker made above expectation, and then created the following four charts. So if a kicker made 7 out of 8, he would be at +1.0. I have coded particularly good outcomes in blue, and bad outcomes in red. Let’s get to it.

Jan Stenerud [continue reading…]

{ 30 comments }

Unsustainable (But Fun!) Stats Through Three Games

Three games is an extremely small sample size, so let’s consider today Freaky Friday. What stats are great to look at but have no chance of being sustainable?

Jared Goff is currently averaging 10.14 ANY/A; no player has ever reached double-digit ANY/A over the course of a full season. If Goff were to miss the rest of the season, he would actually break the record for most attempts in a season with double digit ANY/A.

Alex Smith has a 132.7 passer rating over 84 attempts; no player has reached such lofty passer rating levels over a season with even 34 attempts.  Smith is also completing over 77% of his pass attempts: no player has done that in a season with even 40 attempts.

Another Chief, rookie RB Kareem Hunt, is having a remarkable season, too.  He’s averaging 133.7 rushing yards per game, which would rank as the 2nd best in NFL history if he maintained that average.  Hunt is also averaging 179.3 yards from scrimmage per game, more than 15 yards per game higher than any player has ever produced in a season.  Among players to average at least 45 receiving yards per game in a season, Hunt is also the leader in rushing yards per game by a wide margin.

And here’s one from Adam Harstad: Redskins RB Chris Thompson is averaging over 30 rushing yards and 70 receiving yards per game; that’s probably not sustainable.  Another unsustainable Thompson stat: among players with at least 12 receptions and 12 rush attempts, Thompson would be just the 5th player since the merger to average 8 yards per rush and 16 yards per reception.

Perhaps more sustainable is what Antonio Brown is doing.  In 2015, he averaged 114.6 receiving yards per game, the 9th best mark in league history.  Right now he is at 118.0 yards per game, which would land in 6th place over the course of a full season.

Patriots addition Brandin Cooks is averaging 25.6 yards per catch through 10 catches. If that holds, he would be just the 4th player since 1990 to do so (minimum 10 receptions), and none of the first three had more than 16 receptions.

Jadeveon Clowney has three fumble recoveries in three games.  The record for fumble recoveries by a defensive player is 9, set by Don Hultz with the Vikings in 1963.

Dallas DE Demarcus Lawrence has 7 sacks through three games, which is another unsustainable pace.  The record, of course, is 22.5* sacks, set by Michael Strahan in 2001.


{ 18 comments }

Week 3 Game Scripts (2017): Jaguars Ring the Ravens Bell

The Jaguars obliterated the Ravens in London in week 3: Jacksonville led 10-0 after the first quarter, 23-0 at halftime, and 37-0 entering the third quarter. The Jaguars led 44-0 with 3:30 minutes left, before the Ravens scored the final points of the game.

It was the best Game Script of the season, thanks to both an incredible defensive performance Baltimore’s first 11 drives ended with three turnovers, seven punts, and one turnover on downs, and averaged a total of just 10.5 yards per drive! The offense’s first ten drives resulted in five touchdowns, three field goals, and two punts, and averaged 40 yards per drive (which would jump to 48 yards/drive if you eliminated the drives that began in Ravens territory and resulted in a touchdown).

The full week 3 Game Scripts below: [continue reading…]

{ 3 comments }

I have spent a lot of time thinking about the player protests during the national anthem since Colin Kaepernick ushered in this movement over a year ago. The amount of time I’ve spent thinking about it has only intensified over the last few days, of course. And while I have a lot of thoughts on the topic — and the dozens of offshots and related topics — I am not quite ready to put pen to paper on it.

I also know that what I have to say matters a lot less than what you have to say. I have a ton of respect for this community, and my hunch is a lot of you have thoughts on this topic, too. I’d be curious to hear your thoughts, and also provide an outlet that you may have been looking for to voice your mind. So we’ll take a day off from the football content and let you guys lead the way.

Chase

{ 53 comments }

Alex Smith And The Biggest Career Turnarounds

Smith, Harbaugh, and Kaepernick in San Francisco

On Saturday, I wrote that Alex Smith had turned his career around in a remarkable fashion. In his first 44 starts, he lost 28 times.  And after a win on Sunday, Smith has lost just 28 times in his last 95 starts! That made me wonder: which quarterbacks have turned their careers around in a similar fashion?

To measure this, I calculated each quarterback’s actual career winning percentage from 1950 through 2016 along with their adjusted winning percentage.  What was the adjustment for? Well each start gets weighted more heavily than the last one.  So for a quarterback with 100 starts, his last start gets a weight of 100, his second-to-last start gets a weight of 99, his third-to-last start a weight of 98, and so on.  His second start gets a weight of two, and his first start gets a weight of just one.  In other words, this is heavily skewed towards starts that come later in a quarterback’s career.

By this measure, Smith’s adjusted career winning percentage (including his three starts this year) is 0.669, which is 0.075 higher than his actual winning percentage of 0.594.  That’s pretty significant, but it’s not the largest disparity. That title goes to Billy Kilmer, who had a terrible record with the Saints but a very good with the Redskins.  He had an actual career winning percentage of just 0.539, but weighted for games that came later, it was 0.632, an increase of  0.092.

The 179 quarterbacks who started at least 50 games (from 1950 to 2016) are listed below. Smith ranks as the 5th biggest “late bloomer” on the list. [continue reading…]

{ 12 comments }

Something Is Wrong With Cam Newton

It doesn’t take an expert to realize that something is wrong with Cam Newton. Whether the cumulative effects of the various injuries he has suffered throughout his career have taken a toll on him, or there’s a specific injury causing a problem, it’s now clear that Newton is a shell of his former self.  In Newton’s last 16 games, he’s thrown just 16 touchdown passes… while throwing 16 interceptions.  In Newton’s MVP season of 2015, he averaged more than two passing touchdowns per game, and just over half an interception per game.  The Panthers scored just 9 points against the Bills last week, but the bottom fell out yesterday.

Facing what had been a historically bad Saints defense, Newton produced the single-worst game of his career:  He threw 26 passes but gained just 167 yards, while taking four sacks and losing 28 yards.  That’s an ugly 4.6 NY/A, but it gets much worse when you realize he had no touchdowns and three interceptions.  That translates to a 0.13 ANY/A average, the worst statistical performance of Newton’s career. Again: this came against the Saints.

This game also dropped Newton’s ANY/A over his last 16 games to below 5.00.  That’s right: over Newton’s last 16 games, he has the following stat line: 279/520 (54%), 3,528 yards (6.8 Y/A), 16 TDs, 16 INTs, 42 sacks for 337 yards, and 4.97 ANY/A. The graph below shows Newton’s single game ANY/A (in blue) and trailing 16 game ANY/A (in black) for each game of his career (playoffs excluded): [continue reading…]

{ 14 comments }

Jared Goff, John Brodie, and The Biggest ANY/A Increases

Last season, Jared Goff produced one of the worst rookie seasons in recent history. He ranked dead last in ANY/A, over a 1.5 adjusted net yards per attempt behind every other qualifying passer. Well, this year, through three games, Goff ranks first in the NFL in ANY/A.

It’s really early, but Goff’s performance made me wonder what was the biggest increase in ANY/A year over year in football history (minimum 200 attempts both seasons). In the pre-merger era, the answer is John Brodie (although we are really using AY/A here because we don’t have sack data). He averaged 3.99 AY/A in 1960 and 8.23 AY/A in 1961, representing an increase of 4.24. In the post-merger era, it’s Nick Foles at the top, thanks to his remarkable 2013 season. The table below shows the top 100 year-over-year increases: [continue reading…]

{ 7 comments }

As of Christmas Day, 2010, Alex Smith had a career record of 18-31. At 13 games under .500 with a 0.367 winning percentage, it sure seemed like Smith was a draft bust.  His head coach, Mike Singletary, didn’t seem to have much use for him, just like Mike Nolan before him. Before Jim Harbaugh resurrected Smith’s career, it seemed like he would be yet another draft bust.

But since Christ Day, 2010, Smith has had a sparkling 0.713 winning percentage, thanks to a 63-25-1 record. Smith lost 28 of his first 44 starts, but he’s only lost 28 of his last 94 starts. The graph below shows Smith’s career marked in terms of games below/above .500. His low point was 13 games under .500, reached three times (most recently in mid-December 2010) but now he’s a career high 25 games above .500: [continue reading…]

{ 24 comments }

Young as a Yuck

Steve Young went 91-33 as a starting quarterback for the 49ers, a 0.734 winning percentage. He also went 3-16 as the quarterback of all other teams (which, in this case, is just the Bucs), for a 0.158 winning percentage. That’s remarkable, but is it as remarkable as say, what Jake Plummer did? With the Broncos, Plummer went 39-15 (0.722), but he was 30-52 (0.366) with all other teams (here, just the Cardinals).  Young has a larger differential, but he started just 19 games in Tampa Bay; Plummer started over 50 games with both teams.

One way to “deal” with this is to add X number of games of .500 play to both sides.  I’ve used 40 games before, which is probably within the range of reasonable.  This helps smooth out small sample sizes: Young would therefore be 111-53 with the 49ers (0.677) and 23-36 (.390) outside of San Francisco.  As you can see, his 49ers adjusted winning percentage only changes by about 6% by adding 40 games of .500 play, but his Tampa Bay adjusted winning percentage rises by 23% because of the small sample size.  That’s the point.   Now, Young has a 29% better adjusted winning percentage in San Francisco than outside of San Francisco.

Plummer? His Denver record would become 59-35 (.628), while his non-Broncos record would be 50-72 (.410), giving him a 22% better adjusted winning in Denver.

I did this for every quarterback in NFL history (prior to 2017) and checked to see which passers had the biggest differentials in terms of adjusted winning percentage as quarterback of one team (minimum 10 starts) versus the rest of their career. Young was in fact the leader by this metric, with Plummer coming in at #4. Steve DeBerg was 2nd: he was 21 games under .500 in Tampa Bay and 21 games under .500 in San Francisco, and he also went 7-9 in his starts in Denver, Miami, and Atlanta. On the other hand, he was 31-20-1 as the starter with Kansas City. As a result, his adjusted winning percentage was 23% higher with the Chiefs than it was outside of Kansas City.

Billy Kilmer went an impressive 50-23-1 later in his career as a Redskins starter, but just 11-28 with the Saints (and 0-1 with the 49ers) at the beginning of his career.  In other words, he was a 1970s Plummer. Here’s how to read the table below, using Jim Plunkett — who was 19 games above .500 with the Raiders, and 19 games under .500 when not with the Raiders as an example. Plunkett went 38-19 with the Raiders for a 0.667 winning percentage and a 0.598 adjusted winning percentage (after adding 40 games of .500 play). When not with the Raiders, Plunkett was 34-53 for a 0.391 winning percentage that jumps to 0.425 after adding 40 games of .500 play. Plunkett’s actual difference in winning percentage was 0.276, but just difference in adjusted winning percentage was 0.173, the 10th largest on the list. [continue reading…]

{ 4 comments }

I was a little late in getting out the week 1 Game Scripts, but hopefully these will come out every Wednesday or Thursday for the rest of the year.

The Cowboys, Eagles, and Chargers stood out as pass-heavy this week. Dak Prescott finished with 50 passes (plus two sacks), easily a career high and only the second time he’s thrown even 40 passes in a game. Ezekiel Elliott, meanwhile, set career lows with just 9 carries and 8 yards. Dallas was blown out by Denver, but still: a -11.5 Game Script usually yields more like a 68% pass ratio, not 79%.

Philadelphia was even more pass-happy: this game was close throughout, but Carson Wentz had 52 dropbacks (and 4 rushing attempts), while Philadelphia running backs had just 13 carries. LeGarrette Blount, after recording a team-high 14 carries in week 1, was on the field for just six snaps and had zero carries against the Chiefs. Wentz didn’t convert half of his dropbacks into completions, so it’s tough to see the explanation here for abandoning the ground game. Darren Sproles led the team with 10 carries, but it seems unlikely that he will ever get much more than that. So the either the Eagles will either become the most pass-happy team in the NFL or return to Blount or Wendell Smallwood for a larger role.

The Chargers led for much of the second half against Miami, only falling behind in the final minute. But that didn’t stop Philip Rivers from recording 40 dropbacks, compared to just 13 rushes for the Chargers running backs. Melvin Gordon rushed 9 times for 13 yards with a long of 11 yards, so he obviously was not getting much done. And Rivers completed over 75% of his passes and averaged over 10 yards per completion. In that context, it made a lot of sense. But that doesn’t change the fact that for a team with a Game Script of +1.8, passing on over 75% of their plays (excluding Rivers’ final run of the game to center the ball) is extraordinarily pass-happy. [continue reading…]

{ 3 comments }

There have been just two games this season where a quarterback averaged 12.0 Adjusted Net Yards per Attempt: Sam Bradford in week 1 (27/32, 346 yards, 3 TDs, 0 INT, 1 sack, 5 yards) when he averaged 12.15 ANY/A against the Saints, and Tom Brady in week 2 (30/39, 447, 3/0, 2-11) when he averaged 12.10 ANY/A… also against the Saints. The worst game of this early season was the stinker Andy Dalton produced against the Ravens in week 1: he went 16 of 31 for just 170 yards with 4 interceptions, and was also sacked 5 times for -26 yards. That translates to an abysmal -1.00 ANY/A, the only game with a negative ANY/A so far this year.

And while Baltimore didn’t exactly step a level up in competition in week 2, the Ravens dominated DeShone Kizer in a similar fashion: the rookie went 15/31 for 182 yards with 0 TDs and 3 INTs, while taking 2 sacks for 5 yards. That translates to just 1.27 ANY/A, the second lowest this year behind Dalton among passers with 25 attempts. In other words, it wouldn’t be much of a stretch to argue that the two best passing games of the season came against the Saints, and the two worst passing performances this year came against the Ravens.

So far this early season, quarterbacks are averaging 5.85 Adjusted Net Yards per Attempt. So Bradford, by averaging 12.15 ANY/A on 33 dropbacks, was at 6.30 ANY/A above average over 33 dropbacks, or 208 Adjusted Net Yards above average. Brady, at +6.25 ANY/A relative to league average over 41 dropbacks, was at +256. Those are two of the top three games this year: [continue reading…]

{ 4 comments }

I like trivia, and Chris Brown asked me a good question on twitter yesterday:

The game Brown was referencing was the Patriots performance against the Saints in week 2 of the 2017 season. Here was the receiving breakdown on the New England side:

 
Player Tm Pass Yd Rec Yd
Rob Gronkowski NWE 0 116
James White NWE 0 85
Chris Hogan NWE 0 78
Phillip Dorsett NWE 0 68
Rex Burkhead NWE 0 41
Brandin Cooks NWE 0 37
Dion Lewis NWE 0 11
James Develin NWE 0 6
Jacob Hollister NWE 0 5
Tom Brady NWE 447 0

Brady threw for 183 yards to his wide receivers (Hogan, Dorsett, and Cooks), 143 yards to running backs (White, Burkhead, Lewis, Develin) and 121 yards to his tight ends (Gronkowski and Hollister). So that means Brady threw for 400+ passing yards with just 40% of his passing yards coming from his wide receivers. [continue reading…]

{ 12 comments }

The Race For The Number One Pick (Post-Week 2)

There have only been two weeks of NFL football so far, and four teams have only played one game. But that doesn’t mean it’s too early to start thinking about which team will wind up with the number one pick in the 2018 Draft. So far, six teams separated themselves from the pack in terms of being particularly bad. The Bills, Texans, and Giants have not played well, but with only one loss each, I’m going to exclude them for now. And while the Chargers and Saints are 0-2, as long as Philip Rivers and Drew Brees are around, they aren’t going to be in contention for the first pick. But which teams are?

The Colts have been outscored by a league-high 40 points. Indianapolis lost to the Rams and Cardinals, and both of those teams lose their other game this year. Without Andrew Luck, the Indianapolis offense looks awful: After starting off with a touchdown and a field goal, the Colts final nine drives of the game ended with seven punts, a field goal, and an interception. Indianapolis probably has too weak of a schedule to be a real contender for the first pick, but the Colts will be a mess as long as Luck isn’t around.

The Colts play the Browns this weekend, in a matchup of bottom feeders. As a sign of how far Indianapolis has fallen, the Colts are currently +1 even though the game is at Lucas Oil. Cleveland, of course, went 1-15 last year, and things are not off to a good start this season. Myles Garrett was injured before the season, and on Sunday, Jamie Collins suffered a concussion, DeShone Kizer had a bout with a migraine, and Corey Coleman broke his hand. In other words, it’s factory of sadness as usual in Cleveland: eight minutes into the game against the Ravens, Baltimore scored more points than the Browns would score all game. [continue reading…]

{ 5 comments }

Week 1 Game Scripts (2017): Ravens Flip The Script

Two different Ravens running backs had more carries than Flacco had attempts in week one.

Last season, no team was more pass-happy than the Baltimore Ravens. Joe Flacco and the Ravens led the NFL in pass attempts along with both pass ratio and pass identity. Flacco threw at least 30 passes in every game last year. The Ravens threw 50 passes in a game they won 38-6 in a remarkable display of the team’s pass-only identity.

Well, in week 1 of the 2017 season, the Ravens threw just 18 times and on only 29.5% of all plays, both of which were league-lows. Terrance West and Javorius Allen combined for 40 carries, and while both players were on the team last year, clearly something has changed in Baltimore. The Jaguars and Bills also stood out as very run-heavy in week 1: Jacksonville spent the fourth pick on Leonard Fournette, so that makes a lot of sense, while the Bills are always run-heavy in the Tyrod Taylor/LeSean McCoy era.

On the Game Scripts notes: the Rams led the way with the best Game Script of week 1, courtesy of a blowout win over the Colts. And just two teams won with negative Game Scripts in the opening slate of games: the Chiefs and Lions both won by double digits, but were the only two teams to pull off fourth quarter comebacks. [continue reading…]

{ 6 comments }

Drew Brees, Blake Bortles, and Philip Rivers don’t often get lumped together, but those three are the only quarterbacks in the NFL to (1) start at least 8 games in each of the last 3 years, (2) miss the playoffs in each of the last 3 years, and (3) return as their team’s starter in 2017 (this kicks Colin Kaepernick off the list).

You don’t have to go back in time too far to find a quarterback to start half of their team’s games for at least four straight seasons and miss the playoffs each year: Eli Manning and Ryan Tannehill pulled off that trick from 2012 to 2015. Also that year? Jay Cutler and the Bears missed the postseason for the fifth straight year, although Cutler’s Bears arguably would have made the playoffs once or twice with a better backup quarterback when Cutler missed time due to injury.

Prior to Cutler, Marc Bulger (2005-2009 Rams), David Carr (2002-2006 Texans), and Aaron Brooks (2001-2005 Saints) were the last three quarterbacks to miss the playoffs in five straight years with the same team.

How about six? Neil Lomax was the last do to that, from ’83 to ’88 with the Cardinals, the last six seasons of his career.

The record is 7: since 1960, it’s been done by Jim Zorn with the Seahawks (’76 to ’82), Dan Pastorini with the Oilers (’71-’77), John Hadl with the Chargers (’66-’72), and Sonny Jurgensen and Norm Snead from 1964 to 1970 with Washington and Philadelphia, respectively.

As for Rivers? If not for a missed chip shot field goal and an overtime win against Kansas City’s backups in week 17 of the 2013 season, Rivers on the 2017 Chargers would be in the running for seven straight seasons of missing the playoffs.

{ 4 comments }

Last night, the Texans and Bengals played in a yet another boring and low-scoring game. In the final seconds of the first half, the Bengals trailed 10-3, but got a big break when Cincinnati completed a 37-yard pass down to the Houston 11 yard line.  The Bengals had 1st-and-10 with 16 seconds left, which should have been enough time for… 2 plays? The first play took four seconds, and the second six, which caused the Bengals to send out the field goal team.  Cincinnati ultimately lost by four points.

Time Down ToGo Location
0:24 1 10 HTX 48 Andy Dalton pass complete deep right to Alex Erickson for 37 yards (tackle by Kareem Jackson) 10 3 2.390 4.840 51.6
0:16 Timeout #2 by Cincinnati Bengals 10 3
0:16 1 10 HTX 11 Andy Dalton pass incomplete 10 3 4.840 4.140 48.6
0:12 2 10 HTX 11 Andy Dalton pass incomplete 10 3 4.140 3.130 44.4
0:06 3 10 HTX 11 Randy Bullock 29 yard field goal good 10 6 3.130 3.000 43.8

That feels like an overly conservative move, particularly given that the Bengals had run a pass play that took four seconds just one play earlier. So I looked at all plays with 5, 6, or 7 seconds left in the first half since 2007 where the team had the ball anywhere from the 8 to the 15 yard line and before fourth down. How often do teams kick a field goal? [continue reading…]

{ 6 comments }

Bengals/Texans Is The Saddest Rivalry In The NFL

Since Andy Dalton entered the league in 2011, the Bengals and Texans have faced each other six times, including twice in the playoffs. They square off for a seventh time tonight, and the last six games will have featured Dalton against six different quarterbacks: Deshaun Watson tonight, Tom Savage in 2016, Brian Hoyer in 2015, Ryan Mallett in 2014, Matt Schaub in the playoffs in 2012, and T.J. Yates in the playoffs in 2011 (Yates also started the regular season game that year). More importantly, these games have generally been awful to watch, with four of the six taking place in front of a national audience (a MNF game, a Saturday night game, and two postseason games):

Rk Tm Year Date Time LTime Opp Week G# Day Result OT
1 CIN 2016 2016-12-24 8:25 7:25 @ HOU 16 15 Sat L 10-12
2 CIN 2015 2015-11-16 8:30 8:30 HOU 10 9 Mon L 6-10
3 CIN 2014 2014-11-23 1:02 12:02 @ HOU 12 11 Sun W 22-13
4 CIN 2012 2013-01-05 4:35 3:35 @ HOU 18 17 Sat L 13-19
5 CIN 2011 2012-01-07 4:35 3:35 @ HOU 18 17 Sat L 10-31
6 CIN 2011 2011-12-11 1:02 1:02 HOU 14 13 Sun L 19-20

From 2011 to 2016, there were 29 pairs of non-division rivals that played at least five games (including playoffs). This is highlighted by the Patriots and Broncos, who played a whopping 9 times. The Bengals and Texans have combined to average just 30.8 points per game, easily the lowest among these 29 pairs. And most remarkably, Houston and Cincinnati have combined for just 7 passing touchdowns against 11 interceptions, a -4 difference (among this group, only Texans/Ravens games have seen more interceptions than passing scores). [continue reading…]

{ 4 comments }

Even Bruce Arians Can’t Keep Beating the Spread

As interim coach of the Indianapolis Colts in 2012, Bruce Arians was remarkable. He was named AP Coach of the Year, as the Colts went 9-3, and 8-3-1 against the spread, under his watch. In his first year with the Cardinals in 2013, Arians went 10-5-1 against the spread, making him one of the best coaches ever by that metric. Then in 2014, Arians again was again named Coach of the Year, as he rode some Pythagenpat Magic to go 11-5 against the spread, bringing his career mark up to 29-13-2 against the wise guys in the desert. And in 2015, Arians started off red hot yet again! A 39-32 victory in Seattle against the defending NFC Champions on Sunday Night Football put the Cardinals at 7-2, and 6-2-1 against the spread. At that point, Arians was 35-15-3 against the spread for his coaching career. That’s a 0.660 winning percentage ATS if you count pushes as half wins and half losses, and an even better .700 winning percentage if you discard all pushes (arguably the better approach, since for wagering purposes, a push just means you get your money back). Nobody can beat the spread 70% of the time, right?

Well, yes. Right. Since then, Arians is 9-15-0 against the spread, dropping from a 70% success rate to a 37.5% rate. And he’s just 6-12 ATS in his last 18 games. That includes a stretch in 2016 where Arians’ Cardinals failed to cover in five straight games and seven of eight contests. And it includes a 12-point loss in week 1 of the 2017 season on Sunday, when the Cardinals were 2.5-point favorites. The graph below shows every game of his head coaching career and how many points his team beat (blue) or were beaten by (in red) the spread: [continue reading…]

{ 1 comment }

Sometimes, the headlines speak for themselves. After last night — the Chargers lost when the potential game-tying field goal was blocked in the final second — Los Angeles nee San Diego has now lost 18 of its last 23 games decided by 8 or fewer points.

Query Results Table
Poin Poin Poin
Rk Tm Year Date
Time Opp Week G# Day Result OT PF PA PD
1 SDG 2017 2017-09-11 10:20 @ DEN 1 1 Mon L 21-24 21 24 -3
2 SDG 2016 2016-12-24 1:00 @ CLE 16 15 Sat L 17-20 17 20 -3
3 SDG 2016 2016-12-18 4:25 OAK 15 14 Sun L 16-19 16 19 -3
4 SDG 2016 2016-12-04 4:25 TAM 13 12 Sun L 21-28 21 28 -7
5 SDG 2016 2016-11-27 1:00 @ HOU 12 11 Sun W 21-13 21 13 8
6 SDG 2016 2016-11-13 4:05 MIA 10 10 Sun L 24-31 24 31 -7
7 SDG 2016 2016-11-06 4:25 TEN 9 9 Sun W 43-35 43 35 8
8 SDG 2016 2016-10-30 4:05 @ DEN 8 8 Sun L 19-27 19 27 -8
9 SDG 2016 2016-10-23 4:05 @ ATL 7 7 Sun W 33-30 OT 33 30 3
10 SDG 2016 2016-10-13 8:25 DEN 6 6 Thu W 21-13 21 13 8
11 SDG 2016 2016-10-09 4:25 @ OAK 5 5 Sun L 31-34 31 34 -3
12 SDG 2016 2016-10-02 4:25 NOR 4 4 Sun L 34-35 34 35 -1
13 SDG 2016 2016-09-25 4:25 @ IND 3 3 Sun L 22-26 22 26 -4
14 SDG 2016 2016-09-11 1:05 @ KAN 1 1 Sun L 27-33 OT 27 33 -6
15 SDG 2015 2016-01-03 4:25 @ DEN 17 16 Sun L 20-27 20 27 -7
16 SDG 2015 2015-12-24 8:26 @ OAK 16 15 Thu L 20-23 OT 20 23 -3
17 SDG 2015 2015-12-13 1:03 @ KAN 14 13 Sun L 3-10 3 10 -7
18 SDG 2015 2015-11-29 1:03 @ JAX 12 11 Sun W 31-25 31 25 6
19 SDG 2015 2015-11-09 8:30 CHI 9 9 Mon L 19-22 19 22 -3
20 SDG 2015 2015-11-01 1:02 @ BAL 8 8 Sun L 26-29 26 29 -3
21 SDG 2015 2015-10-25 4:05 OAK 7 7 Sun L 29-37 29 37 -8
22 SDG 2015 2015-10-18 4:25 @ GNB 6 6 Sun L 20-27 20 27 -7
23 SDG 2015 2015-10-12 8:30 PIT 5 5 Mon L 20-24 20 24 -4

For his career, Philip Rivers has a 54-26 record in games decided by more than 8 points, and a 43-54 record in games decided by 8 or fewer points. Read differently, Rivers has lost 28 *more* times in close games than in non-close games. That is (for now) tied with Rich Gannon for the largest spread ever. [continue reading…]

{ 16 comments }

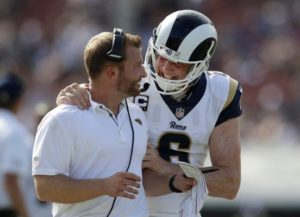
Sean McVay, Bill Parcells, and Excellent Coaching Debuts

You know your debut goes well when you can crack jokes with your punter

Over the last ten years, no team has had a worse record than the Rams. And two of the last three years have started in particularly ugly fashion: last season, the Los Angeles Rams lost 28-0 as 2.5-point favorites in San Francisco. And two years earlier, the St. Louis Rams lost by 28 points to the Vikings as 3.5-point favorites on opening Sunday (more on this game in a bit). But on Sunday, in the first game with a new coaching staff headlined by 31-year-old Sean McVay, OC Matt LaFleur, and DC Wade Phillips, the Rams walloped the Scott Tolzien-led Colts, 46-9.

The Rams were expected to win because, well, Tolzien, but Los Angeles was only favored by 3.5 points. That means Los Angeles, by virtue of a 37-point win, covered by a whopping 33.5 points.  For some perspective, the only other team to cover by four touchdowns on Sunday was Jacksonville, in game 3 of the Doug Marrone era.  Covering by 33.5 points is a ton: the Rams never did it during the Greatest Show On Turf days although the team did do it three times during the Jeff Fisher era, including… the last time the Rams played the Colts. That game, you may recall, was the, um, Tavon Austin breakout game.

Anyway, covering by 33.5 points is pretty rare, but it’s really rare when it comes in a head coach’s first game with the team. In fact, it’s the largest cover by a head coach in his first game since 1990.  And among all coaches in their first games with a new team (i.e., including coaches in their first stop at a new gig), it’s the third largest cover since 1990.  Take a look at how each coach from 1990 to 2016 did in week 1 with a new team: [continue reading…]

{ 4 comments }

Look Who Is Alone In First Place In The AFC East

The New England Patriots are 0-1. The Dolphins, due to Hurricane Irma, have had their week 1 game postponed to week 11, giving Miami a week 1 bye. And the Jets and Bills square off in Buffalo today. The winner of that game will therefore be alone in first place in the division. Which is pretty unusual in the Tom Brady era.

The last time that Buffalo was alone in first place in the AFC East was after week 2 of the 2014 season, when the Bills were 2-0 and the rest of the division was 1-1. Before that, the last time was week 3 of 2011, and other than a few weeks during 2008 (the year Miami won the division and Matt Cassel started 15 games for New England), the only other times since 2001 were after the first two weeks of the 2003 season.

For the Jets, it’s been even longer. New York was last alone in first place in the division after week 6 of the 2010 season, when the Jets were 5-1 and the Patriots were 4-1 (a week later, both teams were 5-1). Since 2002, the only times the Jets have been alone in first place were weeks 11-13 of the 2008 season, weeks 2 and 3 of the 2009 season, and weeks 5 and 6 of the 2010 season.

Looking ahead to week 2, the Bills travel to Carolina while the Jets head to Oakland. So there’s a very good chance the winner of the Jets/Bills game will be 1-1 next week, and New England (playing in New Orleans) will either be 1-1 or 0-2. That would allow the Dolphins, with a win over the Chargers in the first NFL regular season game at the StubHub Center, to be alone in first place in the division. The last time that happened? Week 2 of the 2010 season, and before that, week 4 of the 2005 season! Yes, there has been exactly one week in the last 11 years where Miami was alone in first place (in 2008, the Dolphins never achieved that status, despite winning the division on a tiebreaker).

The graph below shows how many games above .500 each team in the AFC East after each week of the NFL season for the 2001 through 2016 seasons. The Bills and the Patriots share blue and red as their primary colors, but that’s not a huge issue in this chart. [continue reading…]

{ 1 comment }

Sacks Are Coming From Lighter Players

In 1994, the “average” sack came from a player that weighted 266 pounds. Wait, what do you mean by average sack? Well, if you look at all 937 sacks in 1994, and identify the weight of the sacker on each sack, you can calculate the weight of the average sack in each season. John Randle was 290 pounds, and he had 13.5 sacks that year, so he gets 13.5 times as much weight a player with one sack. The graph below shows the weight of the player producing an average sack in each year since 1982. As you can see, it peaked in the mid-’90s, and has declined slightly since.

However, players in general are getting heavier, including in the front seven. The graph below shows the average weight of a player in the front 7 — weighted by the number of starts by such a player — for each year since 1982. That data is in orange; the blue line showing the average sack weight is still included in the chart for reference.
[continue reading…]

{ 3 comments }

Longtime commenter Jason Winter has chimed in with today’s guest post. Jason is a part-time video game journalist and full-time sports fan. You can follow him on twitter at @winterinformal.

As always, we thank Jason for contributing. Note that this was written before last night’s game.


If you’re making predictions as to who will win each division on the eve of this 2017 NFL season, you’ve probably got New England to once again win the AFC East. I mean, look at the rest of that division. Seriously.

As for the other seven divisions, how many teams do you have repeating as champions? Or, let me put it to you this way: Suppose I bet you that at least half of the divisions in the NFL – the AFC East included – will have new winners in 2017. So if there are four or more new division winners, I win; if there are fewer, you win. Would you take that bet?

If we’d done that bet every year since the NFL went to its current eight-division format, I’d have won 12 out of 14 times. So you definitely shouldn’t take that bet.

But sure, that gives me an advantage: You win if 0, 1, 2, or 3 divisions have new winners (four outcomes), and I win if 4, 5, 6, 7, or 8 do (five outcomes). So fine, I’ll give you an extra chance. I only win if more divisions (5+) have new winners in 2017, so you’ll win if exactly half (4) or fewer divisions have new champions. Now what chance do I have to win?

If we did this every year since 2003, I’d still be ahead in the money, with 9 out of 14 wins. Always bet on chaos.

[continue reading…]

{ 7 comments }

2016 Game Scripts in Review: Pass Identity Ratings

Did you know: the Patriots and 49ers both threw on 54% of their plays last season. Both teams ranked in the bottom five last year in pass ratio, i.e., their percentage of plays that were either pass attempts or sacks. But the teams both passed infrequently for different reasons: New England didn’t want to pass much because they were often playing with the lead and were milking the clock; San Francisco didn’t want to pass much because their passing game was not very good and because both Colin Kaepernick and Blaine Gabbert were two of the most run-heavy quarterbacks in football.

San Francisco was undoubtedly a run-heavy team last year, but the Patriots?  Of course not.  No team with Tom Brady is run-happy, but the game scripts incentivized New England to be run-happy.  Regular readers know about Game Scripts, which is simply the average points margin over every second of every game.  New England had a Game Script of +7.7 last year, the highest margin in the NFL.  This means if you were to write down the amount by which New England was leading for every second of every game last year, and calculated the average, you would get a 7.7 point lead.  The graph below shows the Game Script for all 32 teams last year on the Y-Axis, along with their Pass Ratio (pass attempts plus sacks divided by total plays) on the X-Axis. [continue reading…]

{ 5 comments }

The AFC West may be the most competitive division in the NFL. The Broncos and Chargers both have realistic playoff aspirations in 2017, but most observers would still rank the Raiders and Chiefs as the top two teams in the division. But if Oakland is going to win the division, it’s likely going to have to do it by getting an early lead; for the Chiefs, they just need to not fall out of the race before Thanksgiving, because Kansas City should be able to make up ground late. Why? Because while Kansas City and Oakland have similar schedules (the Chiefs draw Houston and Pittsburgh in the two variable games, while the Raiders get the Titans and Ravens), the Chiefs schedule is frontloaded (in terms of difficult games) while Oakland’s schedule is backloaded.

In the first six weeks, the Raiders get the Jets, Ravens, and Chargers at home, along with road games against the Titans, Redskins, and Broncos. Oakland should be able to get off to a 4-2 or 5-1 start against that schedule. The Patriots game comes in week 11 (and it’s a “home” game in Mexico City), but it’s the final four weeks that are scary: Oakland goes to Kansas City and hosts Dallas (on SNF) in weeks 14 and 15, before finishing with road games in Philadelphia (on Monday Night Football) and against the Chargers. A 2-2 mark would be more than holding serve.

Kansas City opens in New England on Thursday night, as tough a game as there is on any schedule. And nearly all the “easy” games for Kansas City come in the final six weeks. The Chiefs host Buffalo at the end of November and face the Jets the following week. The last four games are three home games — the Raiders, Chargers (on Saturday night), and Dolphins — and the final game is in Denver. Kansas City can realistic hope for a 5-1 finish to streak into the playoffs, so the Chiefs just need to get to 5-5 through ten games.

A similar disparity exists in the AFC South: all of those teams have easy schedules (more on this below). But one team with a very favorable early season schedule is the Colts, who… just might need it given the uncertain health status of Andrew Luck. The Colts open up with a road game against the Rams, followed by home games against Arizona and Cleveland. Indianapolis also hosts the 49ers and Jaguars in the team’s first seven games. The Titans have the second easiest schedule in the league, but it’s also really easy late. Tennessee’s December slate? Home for Houston, at Arizona, at San Francisco, home for the Rams, and home for the Jaguars. The Titans are in position to ride a late-season winning streak into the playoffs.

I went ahead and created my own team ratings. You may disagree with them slightly, but the only reason I generated them was to generate SOS ratings. So even if you disagree with some of the ratings, it shouldn’t impact each team’s SOS that much. The ratings below represent how many points each team would beat an average NFL team by on a neutral field. [continue reading…]

{ 1 comment }

38 Questions: A Football Perspective Contest (2017)

Below you will find 38 pairs of numbers. In each case, you tell me which number will be bigger. One point for each correct answer. Most points wins.

Ties — and I expect there to be a nontrivial number of them — go to the side that had fewer votes. For example, here is a pair:

Number of wins by the Lions
Number of wins by the Ravens

Let’s say 49 people take the Lions and 44 take the Ravens. If the Lions and Ravens end up with the same number of wins, then each Ravens-backer will get a point and each Lions-backer will not.  Last year, JimZornsLemma won with 25 correct guesses out of 38; the average was just 19 correct guesses. Thanks to Jeremy De Shetler for an assist on some of this year’s questions.

GRAND PRIZE: the main prizes will be (1) honor and (2) glory. There may also be some sort of trinket to be named later. By the time this thing is over, more than five months will have passed, so that gives me some time to scrape something together. But you probably shouldn’t enter unless honor and glory are sufficient.

MORE RULES:

1. Everyone is limited to one entry per person. This will be enforced by the honor system. If caught breaking this rule, you, your children, and your children’s children will be banned from all future FP contests.

2. I won’t enter the contest myself, which will allow me to arbitrate any dispute impartially. Any ambiguity in the rules will be clarified by me in whatever way causes me the least amount of hassle.

3. While there are quite a few items that refer in some way to the NFL postseason, unless specifically stated, all the items below refer to regular season totals only.

5. You may enter until 1:00 p.m. Eastern time on Sunday, September 17th, 2016. However, there’s an incentive to entering early because…

6. In the event that the contest ends in a tie, the winner will be the person whose entry was submitted first.

HOW TO ENTER: PLEASE READ IF YOU WANT TO ACTUALLY ENTER THE CONTEST.

Cut-and-paste the list of questions below into your editor of choice, THEN DELETE THE CHOICES you don’t like (thereby leaving the ones you do like), and then cut-and-paste your 38 answers into the comments of this thread. Please do not edit the text in any way other than deleting half of it. If you want to leave non-entry comments, you are free to do so either at the very end of your entry or in a subsequent comment, but please do not put commentary in the body of your entry. [continue reading…]

{ 62 comments }

Ladies and gentleman, the Jets 2017 record

The 2017 season will be the 58th season in Jets franchise history. It is also the least anticipated season by Jets fans in that 58-year history. New York went 5-11 last year, and probably wasn’t even that good (the Jets had an SRS of -8.5, 4th worst in the NFL). In the NFL, the way to give a fan base hope is to be good or to make some exciting changes in the offseason. The Jets retained the same general manager (Mike Maccagnan) and head coach (Todd Bowles) from last year’s uninspiring squad, and while New York switched quarterbacks, the addition of 38-year-old Josh McCown somehow feels like a downgrade on Ryan Fitzpatrick.

How bad is it? The USA Today had the Jets going 0-16. Multiple other outlets have spent time discussing that possibility, too. It’s only a question of degree, at this point: everyone assumes that the Jets are going to be horrible.  McCown is a 38-year-old quarterback who has won 8 games since 2006.  The offense is almost certainly the least talented in the NFL ignoring the quarterback position.  And if you were wondering how they got here, well, since the end of 2016, the Jets also said goodbye to:

And again: this team was terrible last year with those players.  So is this really the least optimistic season in Jets history?  Let’s run through things in reverse order, and explain why Jets fans were feeling better on September 1 of every other season than on September 1, 2017.  For brevity’s sake, I’m going to skip seasons where the Jets went at least .500 in the prior year, because, those seasons obviously had more hope than this one. [continue reading…]

{ 18 comments }

Which QBs Have Been The Oldest QBs In Football?

Yesterday, I wrote that Charlie Conerly was the oldest starting quarterback in the NFL from 1953 to 1960, an eight-year run that remains unmatched today. Conerly was the oldest quarterback in 1961, too, but he was mostly a backup in his final season. The table below shows the oldest quarterback in each season since 1946, among all players who finished in the top 30 in passing yards (in all leagues combined). [continue reading…]

{ 13 comments }

Charlie Conerly and the Quarterbacks That Never Arrived

Back in the day, men were men and quarterbacks were Marlboro men.

You probably don’t spend a lot of time thinking about Charlie Conerly. If you do, it’s probably in the context of his legacy as a borderline Hall of Fame candidate, the man who won a record four TD/INT crowns, or as the best quarterback from Ole Miss to lead the Giants to a title.

But here’s something you probably didn’t know about Conerly: he was the oldest quarterback in the NFL… for eight years.   Sammy Baugh retired after the 1952 season at the age of 38; after Baugh, the oldest two quarterbacks in the NFL were Bob Waterfield and Frankie Albert, each 32, and both of them retired after the season, too. That left a pair of 31-year-olds as the elder statements of the NFL arms race: Otto Graham, born in December 1921, and Conerly, born in September 1921.

So in 1953, a 32 years old Conerly was the oldest quarterback in the NFL, thanks to a three month edge over Graham. The NFL was a young man’s league back then, at least at quarterback: no other starter was in his 30s, and only one other regular starter was older than 27. The gap would only grow over time. Graham retired in 1955; in 1956, Conerly was 35, and the next oldest quarterbacks were all 30 years old: Bobby Layne, Y.A. Tittle, Norm Van Brocklin, George Ratterman, and Harry Gilmer.  In 1960, the oldest four QBs in the league were Conerly at 39, and Van Brocklin, Layne, and Tittle at 34 (yes, no 36-year-old quarterback magically appeared).  In ’61, the three oldest quarterbacks in the NFL were Conerly at 40, and Tittle and Layne at 35; by then, Van Brocklin was coaching the Vikings. Conerly retired after the 1961 season. [continue reading…]

{ 9 comments }

In 1998, Randall Cunningham may have been the best quarterback in football.  Cunningham was 35.4 years old as of September 1st of that season. If it wasn’t Cunningham, it was probably Vinny Testaverde (34.8 years old as of 9/1/98), or  Steve Young (36.9), or Chris Chandler (32.9), or John Elway (38.2).  Troy Aikman (31.8) and Doug Flutie (35.9) also had great seasons, three other quarterbacks — Dan Marino (37.0),  Steve Beuerlein (33.5), and Rich Gannon (32.7) — finished in the top 20 in passing yards.

That means 10 of the top 20 quarterbacks in passing yards in 1998 were 31.8 years old or older as of September 1st of that year.    Thirteen years later, things were very different, as 8 of the top 16 passers in 2011 by passing yards were under 28 years old as of September 1st, with four being under 25: Cam Newton (22.3), Matthew Stafford (23.6), Josh Freeman (23.6), Andy Dalton (23.8), Mark Sanchez (24.8), Matt Ryan (26.3), Joe Flacco (26.6), and Aaron Rodgers (27.7).

I calculated the average age of quarterbacks in the NFL for each season since 1950, using the methodology described here. The short version: calculate what percentage of league-wide passing yards was produced by each player, calculate that player’s age as of September 1st of that season, and that calculate the league-wide age of all passers, weighted by their percentage of league passing yards. The results below: [continue reading…]

{ 10 comments }