≡ Menu

In week 9, the Dolphins lost 21-14 to Kansas City. That game was notable because Tua Tagovailoa passed for 193 yards, slightly outgaining Patrick Mahomes, who threw for 185 yards in a winning effort. That doesn’t sound so unusual, especially given how close the totals were: Miami’s quarterback passed for more yards than Kansas City’s quarterback, and Miami lost the game.

But that was unusual: in fact, that is the only game this season where that happened for the Dolphins. In 12 games this year, Miami has had more gross passing yards (excluding sacks) than they have allowed; in those games, the Dolphins are 11-1. In four other games, opposing passers have more passing yards than Dolphins passers; the Dolphins are 0-4 in those games. So in 15 of 16 Miami Dolphins games, the team with more gross passing yards has also won the game.

And that is both rare and a perfect example of the 2023 season.  Because while Miami with Mike McDaniel  and Tua are outliers, the 2023 season is pretty big outlier, too.  In general, throughout the course of NFL history, there is not much of a correlation between which team has more passing yards and which team wins the game. As we know, teams that are trailing late in games throw more frequently — and can rack up the passing yards — than teams with a lead. The same reason you hear starts like “Team X is 15-2 when RB Y has 20 carries or more” is why passing yards isn’t all that correlated with winning. [continue reading…]

{ 0 comments }

The greatest kicker ever made the greatest kick ever. His team celebrated.

In the first fifty years of pro football, long kicks were more prayers than plans. The NFL in 1934 was very different than the one we watch today; back then, you could have a player like Glenn Presnell play quarterback, tailback, defense, and kicker… and also choose his team’s colors, as he and his wife did with the Detroit Lions and their Honolulu blue and silver. A few months later, Presnell made a big in-game contribution for Detroit: with the wind at his back and in front of 8,000 fans, he connected from 54 yards away to provide the sole points in a 3-0 win over rival Green Bay.  It was the longest kick in the young history of the NFL.

Kicks over 50 yards were very rare over the ensuing two decades.  A few of the top kickers like Lou Groza and Ben Agajanian would connect from long range time to time, but both players maxed out at 53 yards.  In 1952, the Chicago Cardinals made just two field goals all season.  That year, the Cleveland Browns used a first round pick on Tennessee defensive back and running back Bert Rechichar.  As a rookie, Rechichar started every game and turned six interceptions; playing in Cleveland with Groza, the idea of Rechichar ever attempting a field goal would have been silly.  But in 1953, the NFL expanded and brought football back to Baltimore.  As a result, Rechichar found his way on the expansion Colts.  In the second quarter of the opening game, he returned an interception for a touchdown to provide the first ever points for the new team.  Teammate Buck McPhail, who was the Colts regular kicker in the preseason, hit the extra point to tie the game at seven apiece. [continue reading…]

{ 0 comments }

GridFe 2010s All Decade Team

This article was originally published on the now defunct GridFe.com site. In an effort to preserve some of the material from that site, I am republishing the article on Football Perspective. Below is the full article, unchanged from its original form.


As the league becomes increasingly reliant on the passing game, the need for players to support or defend passing offenses increases, while run oriented players see a concomitant decrease in necessity. Because of this, I have included a third receiver spot and space for a defensive back in the slot. However, with a hundred years of NFL football in the rearview, it feels right to include some traditional roster spots with a nod to the past. Thus, fullbacks, nose tackles and linebackers also have a home on the GridFe all decade team for the 2010s. [1]Given how long the league fielded 43 and 34 defenses as base personnel, this team will pay homage by including four linebacker slots.

Here’s the squad [continue reading…]

References

References
1 Given how long the league fielded 43 and 34 defenses as base personnel, this team will pay homage by including four linebacker slots.
{ 0 comments }

In 1959, John Unitas led the NFL in pass attempts, completions, passing yards, and passing touchdowns en route to a unanimous MVP award.  In addition, his Baltimore Colts repeated as NFL champions, capping off a brilliant season for the legendary quarterback.

Two years later, in the early days of the AFL, George Blanda was the league’s MVP as he threw for 3,330 yards (no other player had 2,700 yards) and 36 touchdowns (no other quarterback had even 20). Teaming with Bill Groman and Charley Hennigan, Houston had a dominant offense and won the AFL Championship.

But since then — which would include the entirety of the Super Bowl era — no quarterback has won the Super Bowl in the same season where he led the league in passing yards.  A similar but slightly different criteria yields a different result.  Team passing yards, as opposed to individual passing yards, has two major differences: sack yards are deducted at the team but not the individual level, and of course situations where a quarterback does not play a full season will have a much smaller impact on the team level. [continue reading…]

{ 0 comments }

How the Chiefs and Buccaneers Got To Super Bowl LV

The Chiefs have three superstars leading their dominant offense: TE Travis Kelce was drafted in 2013, WR Tyreek Hill was drafted in 2016, and QB Patrick Mahomes was drafted in 2017. Kansas City’s top three defensive stars — nose tackle Chris Jones, safety Tyrann Mathieu, and edge rusher Frank Clark — were added three different ways.  Jones was second round pick in 2016, Clark was acquired via trade in 2019, and Mathieu was a free agent pickup in 2019.

That 2019 year was a big offseason for Kansas City.  Sure, the team was the #1 seed in 2018, hosted the AFC Championship Game, and only lost in overtime to the eventual Super Bowl champions, but that team was a bit different from this version. Six likely starters in Super Bowl LV — Mathieu, Clark, WR Mecole Hardman, ILB Damien Wilson, G Nick Allegretti, and CB Bashaud Breeland — were added in the 2019 offseason. [continue reading…]

{ 0 comments }

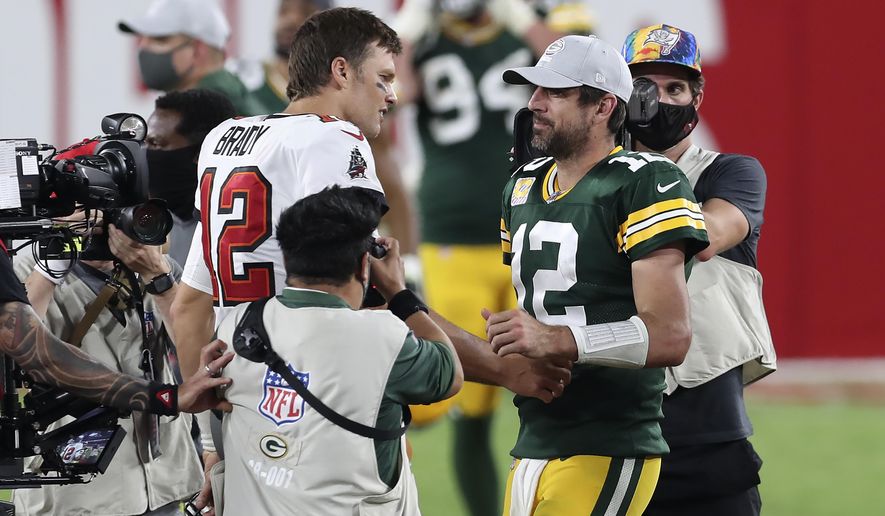
Aaron Rodgers and Tom Brady meet again: Can you feel the hype?

There are, of course, a lot of similarities between Aaron Rodgers and Mark Sanchez.

Both players were born in California, played college football in California, and were drafted by cold-weather teams.

Both players were first round picks to teams in green jerseys.

Both players have thrown exactly 89 career interceptions in the NFL.

And one season, at the start of a new decade, both Sanchez and Rodgers got trounced by a Tom Brady-led team. In 2010, in a game against the Patriots, Sanchez went 17 for 33 for 164 yards with 0 TDs, 3 interceptions, and 1 sack for 15 yards, producing an anemic 0.41 ANY/A as the Jets lost 45-3. In 2020, in a game in Tampa Bay, Rodgers went 16 for 35 for 160 yards with 0 TDs, 2 interceptions, and 4 sacks for 42 yards, a 0.72 ANY/A average; the Packers lost 38-10.

But Sanchez would get a chance to exact revenge in the postseason, and it was served ice cold: the Jets won, the largest regular season margin ever avenged in a game at the same site in the playoffs. This year’s Packers/Buccaneers game is a little different. For starters, the Jets actually had beaten New England earlier in the year, while Green Bay and Tampa Bay are no longer division rivals and only played once during the regular season. More importantly, while the 2010 Patriots were the better team and the home team, this time around, Brady’s team looks to be the worse team and is on the road.

So enough with the constant Sanchez/Rodgers comparisons. Let’s begin looking at situations similar to what will be playing out on Sunday in the NFC Championship Game: that is, times where a team met once (and only once) during the regular season, and then met again in the playoffs.

There have been three 40+ point wins in the regular season that saw rematches in the postseason: in all three, the regular season team won again.  Those three games were, with the team that got blown out listed first, 1969 CLE @ MIN, 1991 DET @ WAS, and 2018 PHI @ NOR.  You will notice that in all three games (along with many of the other, less than 40 point blowouts), the team that got blown out — for lack of a better words, let’s call them the Packers of history — were on the road in the rematch.  And that’s part of what makes the Green Bay/Tampa Bay game less common.

The Packers will be 3.5 point favorites in the NFC Championship Game. So a better comparison might be the 2016 Chiefs and Steelers. In 2016, Kansas City was very good: they finished 12-4, but they were blown out, 43-14, on the road in Pittsburgh during the regular season. Pittsburgh went 11-5, and so the postseason game was in Kansas City. That sounds similar to the upcoming Green Bay/Tampa Bay game, with the rematch switching venues to the home of the better team. The Chiefs were 2.5 point favorites in that game, which they… well, lost, 18-16.

There have been 20 teams in the Super Bowl era that are facing something “similar” to what the Packers have this weekend. That means they:

  • Lost by double digits in the lone regular season game against the playoff opponent
  • The rematch was at the site of the “Packers” team
  • The “Packers” were favored to win the postseason rematch

How did previous Packers teams fare? They went 14-6, meaning the Chiefs/Steelers game referenced above was an outlier. If you want an example that Packers fans will be happy about, let’s use a very topical pair of teams. In 1993, the Buffalo Bills hosted the Kansas City Chiefs for the AFC Championship Game. In the regular season, in a game on the road at Arrowhead, the Bills were easily handled by the Chiefs, 23-7. In the rematch, Buffalo — the “Packers” in this example — was favored by 3 points, despite going up against an old man considered the greatest quarterback of all time: Joe Montana. Buffalo did win the rematch easily, 30-13, and knocked Montana out of the game.

Here are all 20 games, with the “Packers” team — the one that got blown out in the regular season but hosted the rematch — listed first. Excluding four games that are red herrings, the home team went 11-5 in the rematch. Whether you think that’s good (hey, they got blown out the first time and won over 2/3s of their games) — or bad (they were favored to win and only won 11 out of 16 times) is up to you. It’s also worth pointing out that at least three of the times the home team exacted revenge involved some pretty miraculous circumstances, [1]The Comeback, The Catch II, Ray Hamilton. and this pretty easily could have been an 8-8 split.

YearHome TmRoad TmReg SeasonSpreadResultPlayoff Boxscore
2020GNBTAMTAM 38 GNB 10-3.5TBDTAM @ GNB
2017PITJAXJAX 30 PIT 9-7LostJAX 45 PIT 42
2016PITMIAMIA 30 PIT 15-11WonPIT 30 MIA 12
2016KANPITPIT 43 KAN 14-2.5LostPIT 18 KAN 16
2009INDNYJNYJ 29 IND 15 [2]Manning benched in the middle of the game as the Colts already had the 1 seed locked up.-8.5WonIND 30 NYJ 17
2009CINNYJNYJ 37 CIN 0 [3]Week 17 game where the Bengals rested starters as the game was meaningless for Cincinnati.-2.5LostNYJ 24 CIN 14
2004INDDENDEN 33 IND 14 [4]Week 17 game where the Bengals rested starters as the game was meaningless for Indianapolis.-10WonIND 49 DEN 24
2003INDDENDEN 31 IND 17-3WonIND 41 DEN 10
1999WASDETDET 33 WAS 17-6WonWAS 27 DET 13
1998DENMIAMIA 31 DEN 21-13.5WonDEN 38 MIA 3
1998SFOGNBGNB 36 SFO 22-3WonSFO 30 GNB 27
1993BUFKANKAN 23 BUF 7-3WonBUF 30 KAN 13
1992BUFHOUHOU 27 BUF 3 [5]While this was a week 17 game, it was not meaningless for Buffalo; the Bills lost the AFC East by losing this game. And while this game might have an asterisk because Kelly was injured during the … Continue reading-2WonBUF 41 HOU 38
1991BUFKANKAN 33 BUF 6-10.5WonBUF 37 KAN 14
1991DENHOUHOU 42 DEN 14-3.5WonDEN 26 HOU 24
1989NYGRAMRAM 31 NYG 10-3LostRAM 19 NYG 13
1987DENHOUHOU 40 DEN 10 [6]This game came with replacement players.-10WonDEN 34 HOU 10
1980DALRAMRAM 38 DAL 14-3WonDAL 34 RAM 13
1976OAKNWENWE 48 OAK 17-8WonOAK 24 NWE 21
1975RAMDALDAL 18 RAM 7-6.5LostDAL 37 RAM 7
1969DALCLECLE 42 DAL 10-7LostCLE 38 DAL 14

Please leave your thoughts in the comments.

References

References
1 The Comeback, The Catch II, Ray Hamilton.
2 Manning benched in the middle of the game as the Colts already had the 1 seed locked up.
3 Week 17 game where the Bengals rested starters as the game was meaningless for Cincinnati.
4 Week 17 game where the Bengals rested starters as the game was meaningless for Indianapolis.
5 While this was a week 17 game, it was not meaningless for Buffalo; the Bills lost the AFC East by losing this game. And while this game might have an asterisk because Kelly was injured during the game, the rematch also came the next week without Kelly in a forgotten matchup between the two teams.
6 This game came with replacement players.
{ 0 comments }

Previously:

On Monday night in Buffalo, the Kansas City Chiefs produced one of the most run-happy games of the Andy Reid era. On a rainy night where the Bills defense consistently dared the Chiefs to run the ball, Kansas City didn’t take the bait, running 44 times for 247 yards and15 first downs. The Chiefs punted on the opening drives of both halves, but that was it: otherwise, Kansas City was able to consistently move the ball on the Bills without relying much on more than the threat of Patrick Mahomes. It was the sort of performance you would expect from that other AFC powerhouse: last year, the Ravens had a record four games with 240+ rushing yards and a 120+ passer rating, marks the Chiefs met in the win over Buffalo. With Le’Veon Bell coming on to the roster, the Kansas City offense should only get more potent.

The full week 6 Game Scripts, below. [continue reading…]

{ 0 comments }

NFL Stats Through Week 3 — Fun With Stathead

As many readers know, Pro-Football-Reference.com produced remarkable search tools that let readers access that remarkable database to answer all sorts of trivia questions. PFR has now migrated that function to Stathead, and I thought I’d help my readers get use to the Stathead tools, too. So let’s go around the NFL and use the Stathead player and team tools to examine some of the interesting stats through three weeks of the 2020 season. [continue reading…]

{ 0 comments }

Super Bowl Champions and Elite Safeties

In light of the Jets trading Jamal Adams to Seattle — more on this later — I wanted to take a look at the correlation between top level safety play and Super Bowl champions.

Hall of Fame Safeties and Super Bowl Champions (15)

There have been 15 Super Bowls won by safeties who would make the Hall of Fame. Six HOF safeties won two Super Bowls: Willie Wood with the Packers, Troy Polamalu with the Steelers, Steve Atwater with the Broncos, Ronnie Lott with the 49ers, Cliff Harris with the Cowboys, and Donnie Shell with the Steelers. In addition, Johnny Robinson won with the ’69 Chiefs, Rod Woodson won with the ’00 Ravens, and Ed Reed won with the ’12 Ravens.

Defensive Player of the Year and Super Bowl Champions (3)

In addition to Polamalu, Rod Woodson, and Ed Reed, Bob Sanders won a Super Bowl with the ’06 Colts and was the AP DPOY in ’07. Dick Anderson was the AP DPOY in ’73, and won Super Bowls with Miami in ’72 and ’73. Both players were huge parts of their team’s titles.

First-Team All-Pro and Super Bowl Champions (23 plus 7)

There have been even more safeties who, at one time in their career were first-team All-Pros and were starters on a Super Bowl champion. This includes all six Patriots teams — Lawyer Milloy in ’01, Rodney Harrison in ’03 and ’04, and Devin McCourty in ’14, ’16, and ’18. Dwight Hicks was an All-Pro with the 49ers during his prime and was a Pro Bowler on both the ’81 and ’84 teams. Darren Woodson is a near Hall of Famer who won two rings with the Cowboys. Mike Wagner was a very good safety who started for the ’74 and ’75 Steelers. And eleven other guys have won once.

That list is headed by likely HOFers in LeRoy Butler with the ’96 Packers, John Lynch with the ’02 Bucs, and Earl Thomas with the ’13 Seahawks… along with Darren Sharper (’09 Saints) who well, was a HOF-level player and a reprehensible person and rapist. Tyrann Mathieu (’19 Chiefs) may also one day have a Hall of Fame case, although it’s obviously early.

The rest of the list: Merton Hanks with the ’94 49ers, Malcolm Jenkins with the ’17 Eagles, Jim Hudson with the ’68 Jets, Gary Fencik with the ’85 Bears, Mark Murphy with the ’82 Washington Football Team, and Rick Volk with the ’70 Colts.

In addition, there are 7 Super Bowl champions who, in addition a blue chip safety, had another All-Pro safety. Jake Scott won two Super Bowls with Miami in ’72 and ’73 playing alongside Anderson, Mike Wagner started next to a HOFer in Shell on the ’78 Steelers, Charlie Waters and Cornell Green were All-Pro safeties who played next to Harris on the ’77 and ’71 Cowboys, respectively, Eugene Robinson started next to Butler on the ’96 Packers, and Tim McDonald was the other safety on the ’94 49ers.

The graph below shows the starting safeties for all 54 Super Bowl champions, and is color-coded to represent HOF/DPOY players, All-Pros, and 2nd-team All-Pros/Pro Bowlers.
[continue reading…]

{ 0 comments }

The GWTD King.

Last week, I looked at which running backs and wide receivers have scored the most game-winning touchdowns. Today, I am reproducing the same analysis but for quarterbacks: who has thrown the most game-winning touchdowns?

As before, a touchdown qualifies as a game-winning touchdown if all of the following four criteria are met:

  • It occurs in the 4th quarter or in overtime;
  • The scoring team was not winning prior to the touchdown
  • The scoring team was winning after the touchdown, including the extra point [1]However, if a team was down by 7, scored a touchdown, went for two and converted, that touchdown does not count as a game-winning touchdown. So in this Cowboys/Giants game from 2018, Dallas was down … Continue reading; and
  • If the touchdown (plus point after) gave the winning team more points than the losing team scored all game. So if a team is down 21-17 and scores a touchdown to go ahead 24-21, and that team ultimately wins 31-27, that does not count as a game-winning touchdown. But if they win 31-21, it does.

Got it? Great. I looked at all games, regular and postseason, in the NFL, AFL, and AAFC and counted all game-winning touchdowns by this metric. As it was back in 2013, Baltimore Colts legend Johnny Unitas remains the king. He had 23 game-winning touchdown passes and also ran for one more, giving him a record 24 game-winning touchdowns on his resume: [continue reading…]

References

References
1 However, if a team was down by 7, scored a touchdown, went for two and converted, that touchdown does not count as a game-winning touchdown. So in this Cowboys/Giants game from 2018, Dallas was down 35-28 with just over a minute to play when Dak Prescott threw a touchdown pass. After the play, the Cowboys went for 2 and converted, and won 36-35. But I am not crediting Prescott with a game-winning touchdown pass. Had Dallas been down 34-28 when Prescott threw his touchdown, he would receive credit for a game-winning touchdown pass assuming the Cowboys hit the ensuing extra point. Prescott in fact threw the game-winning 2-point conversion, but that is a separate category.
{ 0 comments }

Yesterday, I looked at the NFL teams since 1970 that got the most (in terms of winning percentage) out of their passing games. These were teams that were dragged down by their passing offense. Today, the opposite: passing offenses that were dragged down by the rest of the team.

And let’s begin with Manning. Because no passing offense was ever let down more by the rest of his team than one of Manning’s dome teams. Of course, I am referring to Archie Manning and the 1980 Saints, who went 1-15 despite having an above-average passing offense. New Orleans finished 6th in completion percentage and 10th in ANY/A in 1980, but New Orleans allowed a then-record 6,218 yards of offense to opponents season. The Saints allowed 487 points, a mark that still ranks as the worst in franchise history.

Behind Manning, the Saints averaged 5.19 Adjusted Net Yards per Attempt, which was +0.33 better than league average. As a result, this means among all teams since 1970, the ’80 Saints were 0.28 standard deviations better than average at passing. However, with a 1-15 mark, those Saints were 2.27 standard deviations below average at winning. Using the methodology described yesterday, this means the 1980 Saints get a grade of -2.55, indicating an extreme lack of help for the passing offense. That is the worst result of any team since the merger.

The next 3 teams on the list are all 49ers teams. In 2000, Jeff Garcia, Terrell Owens, a 38-year-old Jerry Rice, and Charlie Garner powered one of the best offenses in the NFL. The 49ers ranked in the top 5 in yards per play and led the league in turnovers… and yet went 6-10, thanks to a defense and special teams that was just as bad as the 49ers offense was good. In 1982, the strike-shortened season, Joe Montana and Dwight Clark were a lethal combination, but the team won 3 games, blew 3 games in the 4th quarter, and lost another 3 games. Montana and the 49ers had the best passing attack in the NFC that season, but a defense that significantly regressed. And in 1979, in the first year of Bill Walsh, San Francisco had a similar situation: Steve DeBerg and the 49ers had an above-average passing offense, but the defense couldn’t stop a nosebleed, ranking in the bottom 3 in both ANY/A and points allowed.

The full results, below: [continue reading…]

{ 0 comments }

The 2005 Bears were a work of art.  Coached by Lovie Smith, with Ron Turner (OC) and Ron Rivera (DC) at his side, the Bears clinched the NFC North with an 11-4 record in week 16.  The Bears did this despite having one of the worst passing offenses in the NFL: at the time, Chicago ranked 31st in passer rating, passing yards, and passing touchdowns, only eclipsing the 49ers in all three categories.  Therefore, it’s fair to say that the team’s success was overwhelmingly due to a dominant defense and a solid running game powered by Thomas Jones (the special teams were not particularly good, either).

In fact, by one measure, the 2005 Bears got more out of bad QB play than any other team since 1970.  How did I measure that? [continue reading…]

{ 0 comments }

Trivia: Top Scoring Teams and All-Pro Honors

Last year, Lamar Jackson had an MVP season, playing a huge role in Baltimore leading the NFL in points scored. Surprisingly, Baltimore didn’t have many other offensive players receive much All-Pro recognition: LT Ronnie Stanley and RG Marshal Yanda were both first-team All-Pros, but that was it. But this made me wonder, which league-leading offense had the least All-Pro recognition?

In 1985, the San Diego Chargers led the NFL in points scored. That year, Dan Fouts was a 1st-team All-Pro selection at quarterback by the NEA, while Dan Marino was a 1st-team All-Pro by all the other major organizations (AP, Sporting News, Pro Football Weekly). For purposes of today’s post, I am treating all organizations equally, and therefore both Fouts and Marino would get credited with being a 1st-team All-Pro.

The Chargers didn’t have many other honors on offense, though: the only other recognition went to RB Lionel James and LT Jim Lachey, who were each 2nd-team All-Conference selections from the UPI. But that’s only the second-least decorated offense since 1970 among teams that have led the league in scoring. One team had just one 1st-team All-Pro and the only other all-pro honor was one 2nd-team All-Conference selection. Can you guess the team? [continue reading…]

{ 0 comments }

Pick Your All-Time Offense, Part 2

Rather than pick my team, I am going to pick my best four teams.

Let’s start with my run-n-shoot offense: think of this as the team you would pick if, say, you know you are starting the second half down 21-0.

Here are my thoughts:

1) Calvin Johnson is the only WR available at flex, so he’s an obvious choice.

2) Barry Sanders has a lot of experience in the run-n-shoot (first under Mouse Davis) and with 11 personnel under Tom Moore; Sanders’s skills are best utilized without a fullback on the field. The running back will be devalued here, but Sanders can keep defenses honest — especially when they are playing the pass.

3) At FB/TE, we are going with the best receiver in the group, and that’s Kellen Winslow Sr. He’s got some experience playing on some pass-happy teams.

4) You want Peyton Manning — the ultimate quarterback to lead a second half comeback — and he also has experience under Moore.

5) Taking Manning and Johnson removes Rice and Moss from the WR list, but going with Don Hutson and Lance Alworth is a legendary pair of wide receivers to join Johnson.

6) Mel Hein is going to be a consistent pick — the guy won MVP at center! He is the pick as our player from the ’30s.

7) Next, I’m taking Dan Dierdorf as my right tackle.  In addition to being an outstanding player, Dierdorf excelled under Don Coryell  — which means he’ll be a natural fit sliding in next to Winslow. [continue reading…]

{ 0 comments }

Scoring Distribution From 1950 to 2019

Scoring soared in the aftermath of World War II, but quickly dropped off in the middle of the 1950s. Scoring fell to its nadir in 1977, prompting the 1978 rules changes regarding pass blocking and pass coverage. After another lull in the early nineties, scoring has steadily increased over the last twenty years. It reached a peak in 2013 and nearly matched that again in 2018, before a a slight dip in 2019. Take a look at the average points per game for all NFL teams (i.e., excluding the AFL) since 1950:

You might think that the increase in scoring is due to the passing game becoming more dominant in modern times, but that’s hardly the full story. There are more passing touchdowns now, but they have also to some extent just taken touchdowns that would have otherwise been rushing touchdowns. Over the last 5 years, teams have scored about 16.6 points per game on passing plus rushing touchdowns, if we assign 7 points to each touchdown. That’s noticeably higher than how things were in the ’90s and ’00s, and much higher than the ’70s, but it’s lower than NFL life was in the ’50s and much of the ’60s.

One undeniable fact of life is that field goals have become a much bigger part of the game. The graph below assigns 7 points to all passing, rushing, and other touchdowns, and 3 points to all field goals. It then shows how many points per team game have come from each of those four categories. [continue reading…]

{ 1 comment }

Welcome to the 2020 Offseason

I’m going to take a little vacation: both in the physical sense and from writing every day. Given how tight this community is, I wanted to let everyone know that I probably won’t be updating this blog for the next week or two, but don’t worry about me.

In the meantime, please leave any ideas, thoughts, or anything on your mind in the comments. As we begin the 2020 offseason, what are you interesting in reading about? Writing about? Studying? Debating?

Thanks,

Chase

{ 0 comments }

The top passers of 2019 share a word.

In 2018, Patrick Mahomes* led the NFL in both Adjusted Net Yards per Attempt and Value added. As regular readers know, ANY/A is calculated as follows: (Passing Yards + 20 * TD Passes – 45 *INT – Sack Yards Lost) / (Attempts + Sacks). Mahomes averaged 8.89 ANY/A last year, and the league average was 6.32; since the Chiefs quarterback had 606 dropbacks in 2018, that meant he added 1,554 Adjusted Net Yards of value over average. That easily led the league.

In 2019, Mahomes averaged 8.38 ANY/A and the league averaged 6.16 ANY/A. Mahomes missed some time this year due to injury, and finished with 501 dropbacks; he therefore added 1,113 Adjusted Net Yards of value over average. That wasn’t quite on pace with what he did last season, but it was still good enough to lead the league.

But it was Ryan Tannehill — who finally had his breakout season — who finished #1 in the NFL in ANY/A. Replacing Marcus Mariota in midseason, Tannehill averaged 8.52 over 12 games, 10 starts, and 317 dropbacks. That last number is why he only finished 5th in VALUE; he didn’t play long enough to add as much value as Mahomes, Dak Prescott, presumptive MVP Lamar Jackson (who also averaged 80.4 rushing yards per game), or Drew Brees.

The worst five quarterbacks in VALUE added, from 28th to 32nd: Giants rookie Daniel Jones, Browns second-year QB Baker Mayfield, soon to be ex-Bengals QB Andy Dalton, Bears third-year QB Mitchell Trubisky, and Panthers second-year QB Kyle Allen.

The full stats, below: [continue reading…]

{ 0 comments }

Long Passing Touchdowns, By Year

It’s a good thing we have Kirk Cousins, the 2019 NFL said. The Vikings quarterback leads the league with four touchdown passes of 50+ yards, with three of them going to Stefon Diggs. Daniel Jones, Patrick Mahomes, Lamar Jackson, and Dak Prescott are the only other passers with three such touchdowns.

The graph below shows the amount of 50+ yard passing touchdowns in each season since 1950, graphed on a per-16 team game basis.

As Adam noted in the comments a week ago, there have been fewer big pass plays this season. That isn’t quite reflected in this chart (which only looks at touchdowns), but there is still a small dropoff.

And, of course, a huge dropoff from the late ’60s. In 1968; there were a whopping 96 touchdown passes in only 364 team games. The charge was led by AFL stars John Hadl (10, with three apiece to Lance Alworth, Gary Garrison, and Jacque MacKinnon), Len Dawson (6, with half to Frank Pitts), and Joe Namath (5, all to Don Maynard). The next year, however, the total dropped by 30 to just 66 in the same 364 games. Hadl and Dawson threw just two long touchdowns that season.  The big jump year was ’98, which was fueled by Antonio Freeman (6) and Randy Moss (5).

What else stands out to you?

{ 1 comment }

Washington Redskins, Trailing 16 Game History

The Washington Redskins are 0-4, and are 15-point underdogs at home today against the Patriots. It is the largest spread the Redskins have ever faced in a home game, topping a 13-point margin against the 1995 Cowboys. A loss today means Washington will have lost 11 of its last 12 games, as the Redskins finished 2018 with a 1-6 mark in the team’s final 7 games once Alex Smith went down.

It certainly feels like a low point in franchise history. And over a long enough time horizon, that’s certainly true: since 1993, Washington has the fourth worst record in the NFL, below even the Cardinals.

The graph below shows the team’s trailing 16-game winning percentage over each 16-game period in franchise history.

Less than a year ago, Washington had a 9-7 record over its previous 16 games. But that was with Smith, and with a head coach who apparently didn’t want the team’s first round quarterback, the team seems as directionless now as it has in years. But take note, Redskins fans: it could be worse. As you can see from the graph above, Washington lost 16 straight games from ’60 to ’61, and went 22 straight games during this stretch without a win.

{ 0 comments }

Outstanding. Now the real question? Want to be a Footballguy?

That was the e-mail I received from David Dodds on June 6, 2002. The co-owner of Footballguys.com then and now, Dodds was replying to a freelance article I submitted to his site. Two days later, my article was posted, and I had become a paid writer. Today, I will share some of what I have learned over the last 17 years with you.

  • The more you write — and read — the easier writing becomes. Writing every day or writing a long piece sounds daunting, but you will be aided by momentum for most of the journey. Reading other work in your field will naturally elicit a thought that you can put to paper. And anytime I write an article, there’s always an idea for a future piece embedded in that work. I have now written a post for 2,548 consecutive days, and I can promise you it gets easier.
  • Serious writers need to do three things: Write, Publish, and Promote. Many want to write, or think they would be good writers, but that’s about as far as they ever go. There are no barriers to entry when it comes to writing. Other people will write but delay to publish their work. For me, reader feedback is an incredibly important (hence the promote part) part of the process. Vince Lombardi said it best: “Practice doesn’t make perfect. Perfect practice makes perfect.” Without outside feedback and criticism, you are likely to continue making the same mistakes. You are essentially living in a one person bubble, and that’s a bad environment in which to grow. There are many problems with people on the internet, but one thing people on the internet are really good at is telling you when you did something wrong. For writers, I think that’s a good thing.
  • Read good writers. As often as you can. It remains the cheat code to becoming a good writer.
  • There is no money in writing. There are exceptions, of course, but readers of this blog don’t get blinded by exceptions. I wish there was money in writing, but that’s just not the case. Do not go into writing to make money. I think of writing the way I think of exercise: it’s just plain good for you in ways that, ironically, are difficult to articulate. But it’s for you the way exercise is for you: do it because you enjoy it, not to make money. Please don’t go into writing to make money.
  • Don’t let the perfect be the enemy of the good. This applies in a couple of ways.
    • Occasionally, my posts will have typos or errors. That happens and it doesn’t bother me. 100% accuracy should not be your goal in writing just like your goal in life shouldn’t be to never make a mistake. I post something every day, and being 95% accurate every day of the week is preferable, I think, to being 100% accurate three times a week. Also, nobody is 100% accurate.
    • We all want to write that seminal piece that changes the way people think forever. That’s great, but it takes also takes forever to write that piece. And here’s a neat trick: if you publish Part 1 of your topic early on, you can use reader feedback to get to your destination much quicker than you can by brainstorming. I have also found that you are more likely to write That Great Article if you write 10 articles that you think are decent than one article that you think is The One. That’s because you will be shocked at how bad you are at predicting what reader reaction will be to your article. Unless it’s about Peyton Manning and Tom Brady.

  • Remember the golden rule: it may sound hokey, but treating others the way you would like to be treated is excellent advice for everyone in every field. I’ve found and maintained a lot of great friends by following this advice. Don’t be a bad person.
  • Be humble and honest with your audience. If you don’t know all the answers (and you probably don’t), say that. If you are unsure of something, say that, too. People are pretty good at detecting these sorts of things, anyway, and you earn reader credibility by treating your audience with respect. I maintain that this very small site has some of the best commenters in the community, and I think that’s because I write with this rule. Whenever I have found myself drawing a lot of criticism for my work, it’s because I have violated this principle. Also, listen to good criticism and ignore bad criticism. Trust your gut on that one.
  • From time to time people ask me how I got into football writing. The rest of this post (an update from 2013) will explain just that. Seventeen years ago, there was no twitter, and neither blogging nor fantasy football was mainstream. My brother was and is a sports anchor/reporter (and a great one at that), and he was the writer in the family. I was just an 18 year old who hated writing and was good at math. [continue reading…]

    { 0 comments }

    Rushing Offense vs. Rushing Defense

    Yesterday, I looked at how consistent passing offenses — as measured by Relative ANY/A — were from year to year. What happens if we look at rushing consistency from year to year?

    To do that, I looked at rushing yards, relative to league average, for all teams from 2002 to 2018. That is shown in the graph below, with rushing yards relative to league average in Year N on the X-Axis, and rushing yards relative to league average in Year N+1 on the Y-Axis. The best rushing offense over this period was the 2006 Falcons, but they were actually below average in 2007 without Michael Vick.  In general, though, we see similar results to what we saw yesterday: a slight (and not as large as yesterday) positive correlation between Year N and Year N+1 productivity.

    What about rushing defense? The biggest surprise is how similar the data appear for both rushing defense and rushing offense.  Again, the X-Axis shows rushing yards relative to league average, with a positive number meaning a good rush defense.  The Y-Axis shows the Year N+1 data.  In 2005, the Minnesota Vikings rush defense was slightly below average, but in 2006, Minnesota posted the top rushing defense of this period.

    In terms of stickiness from year to year, rushing defense looks more consistent than passing defense, and exactly as consistent as rushing offense.


    { 0 comments }

    I calculated the Adjusted Net Yards per Attempt averages for every quarterback for every season in NFL history. I then calculated each quarterback’s Relative ANY/A, which is their ANY/A relative to league average. I wanted to then plot the big four quarterbacks of this era — Peyton Manning, Tom Brady, Drew Brees, and Aaron Rodgers — to see how they fared (after excluding seasons where the quarterback didn’t have enough pass attempts to qualify for the passing crown). I’ll leave the commentary to you guys, and I’ll just present the data in three different graphs.

    First, let’s do it by chronological year. This means Manning’s graph starts early but ends, while Rodgers doesn’t get started until 2008. I have used blue/white for Manning, red/blue for Brady, gold/black for Brees, and green/gold for Rodgers.

    [continue reading…]

    { 1 comment }

    The Alabama Crimson Tide once again dominated the draft, as did the entire Southeastern Conference. Three Alabama players — defensive tackle Quinnen Williams, guard Jonah Williams, and running back Josh Jacobs — went in the first round, and the school had 10 players selected in the 2019 Draft, the most of any school this year. And based on the Football Perspective Draft Value Chart, Alabama also had the most draft value of any school, followed by Ohio State, Clemson, and Oklahoma.

    The table below shows the draft value each school produced in 2019:

    RKCollegeConferencePlayersDraft Value
    1AlabamaSEC1091
    2Ohio St.Big Ten979.7
    3ClemsonACC678.8
    4OklahomaBig 12876.4
    5MichiganBig Ten555.5
    6Mississippi St.SEC554.7
    7WashingtonPac-12851
    8IowaBig Ten446
    9KentuckySEC540.7
    10LSUSEC337.8
    11MississippiSEC634.8
    12Boston Col.ACC432.4
    13FloridaSEC530
    14GeorgiaSEC729.4
    15North Carolina St.ACC429.3
    16Notre DameInd628.6
    17HoustonAmerican325.2
    18Texas A&MSEC724.3
    19UtahPac-12523.8
    20StanfordPac-12523.4
    21DukeACC123.2
    22TCUBig 12323
    23Penn St.Big Ten622.3
    24West VirginiaBig 12520
    25MarylandBig Ten317.8
    26Florida St.ACC217.5
    27Washington St.Pac-12216.5
    28Arizona St.Pac-12216.4
    29TempleAmerican315.2
    30USCPac-12414.8
    31Alabama St.fcs114.6
    32WisconsinBig Ten414.5
    33South CarolinaSEC313.1
    34Iowa St.Big 12212.4
    35Central MichiganMAC212.3
    36VanderbiltSEC211.8
    37AuburnSEC611.7
    37Kansas St.Big 12211.7
    39MissouriSEC211.2
    40MemphisAmerican211.2
    40Michigan St.Big Ten211.2
    42Miami (FL)ACC510.9
    43Northern IllinoisMAC210.8
    44HawaiiMWC210.6
    45ToledoMAC29.3
    46VirginiaACC29.1
    47Central FloridaAmerican18.7
    48Delawarefcs18.5
    49MassachusettsInd18.3
    50ArkansasSEC38.2
    51BaylorBig 1217.8
    52San Jose St.MWC17.6
    53Florida AtlanticCUSA27.4
    54Old DominionCUSA27
    55BYUInd16.7
    56CharlotteCUSA16.5
    57West. Illinoisfcs16.4
    58Louisiana TechCUSA16.3
    59San Diego St.MWC16.2
    60OregonPac-1245.9
    60Sioux Fallsfcs15.9
    62Oklahoma St.Big 1235.8
    63Boise St.MWC15.1
    64East. MichiganMAC14.9
    65Wake ForestACC13.9
    66IndianaBig Ten13.6
    67Charleston (WV)fcs13.4
    68RutgersBig Ten22.6
    68PittsburghACC12.6
    70TexasBig 1222.5
    71MinnesotaBig Ten12.4
    72Tarleton St.fcs12.1
    73NorthwesternBig Ten12
    73North Dakota St.fcs12
    75North CarolinaACC11.8
    76Fresno St.MWC11.7
    77Washburnfcs11.5
    78ColoradoPac-1211.3
    79SE Missouri St.fcs11.2
    79WyomingMWC11.2
    81Elonfcs11.1
    82La-MonroeSun Belt10.8
    83Bowling GreenMAC10.6
    83AkronMAC10.6
    85IllinoisBig Ten10.4
    85Utah St.MWC10.4
    87TulaneAmerican10.2
    87South Dakota St.fcs10.2
    89SyracuseACC10
    89CincinnatiAmerican10
    89Texas TechBig 1210
    89North Carolina A&Tfcs10
    89James Madisonfcs10
    89Prairie Viewfcs10
    89Valdosta St.fcs10
    89Idahofcs10
    89Morgan St.fcs10
    89Colorado St.MWC10
    89Air ForceMWC10
    89ArizonaPac-1210
    89UCLAPac-1210

    Alabama’s dominance in the draft was part of an even more impressive showing by the conference as a whole. Eight of the top 18 teams in draft value came from the SEC, including 5 teams from the SEC West. The graph below shows how much draft value each conference produced in 2019:

    And here’s the same data in table form:

    RkConfDraft Value
    1SEC398.7
    2Big Ten258
    3ACC209.5
    4Big 12159.6
    5Pac-12153.1
    6American60.5
    -fcs46.9
    -Ind43.6
    7MAC38.5
    8MWC32.8
    9CUSA27.2
    10Sun Belt0.8

    Some other draft notes:

    • Tennessee was the only SEC school that did not produce a draft pick in 2019.
    • In the Big 10, Purdue and Nebraska were the only two schools that did not have a player drafted.  For Nebraska, this ended a steak of having at least one player drafted in every year since 1963.
    • Kansas was the only Big 12 school without a draft pick in 2019.
    • In the Pac 12, California and Oregon State were the two schools shut out from the Draft.
    • Louisville, Georgia Tech, and Virginia Tech were ACC schools without a player selected in the 2019 Draft.
    • Houston, Temple, and Central Michigan were the three non-Power 5 schools with the most draft value.
    • Three schools went 1-11 and still produced at least one draft pick: Rutgers, San Jose State, and Central Michigan.
    • Just two first round picks did not go to a Power 5 school, and both have Houston ties.  With the 9th pick, the Bills selected Houston DT Ed Oliver, and with the 23rd pick, the Texans drafted Alabama State OT Tytus Howard.


    { 0 comments }

    The Dolphins Acquire Josh Rosen For Pennies

    The Miami Dolphins have been looking for the next Dan Marino since the day he retired. In that pursuit, the franchise has a habit of thinking all quarterback woes can be solved with a second round pick. And while that has been flawed thinking so far, it’s hard to find any criticism with what GM Chris Grier did last night.

    In 2003, Miami traded a 2004 second round pick to Philadelphia for A.J. Feeley, who lasted just one year with the Dolphins and went 3-5 as a starter.

    In 2007, Miami used a second round pick on John Beck from BYU, who also lasted only one year in South Beach and went 0-4 as a starter.

    In 2008, Miami used a second round pick on Michigan’s Chad Henne. The Wolverine product stuck in Miami for four years and went 13-18 as a starter.

    In 2009, Miami — fresh off of its success with the Wildcat offense — used a second round pick with West Virginia superstar running quarterback Pat White. He never worked out in the NFL at any position, lasting only one year in the NFL and finishing with under 100 total career yards. [continue reading…]

    { 0 comments }

    Aaron Jones led the NFL (much to my dismay) in yards per carry in 2018, averaging 5.48 yards per carry courtesy of 729 yards on 133 carries. But there are many problems with focusing too much on a simple metric like yards per carry, which doesn’t tell you very much.

    Every year, I like to conduct a study on all running backs who had above average YPC averages and then figure out how many carries we would need to remove to drop his YPC to below average. Why do I like to do this? Because it’s the offseason, and why not! But also because it helps to highlight and remind us how sensitive YPC is to outlier runs.

    When I looked at the top running backs in the NFL last year, as a group, they rushed 8,153 times for 35,989 yards, a 4.41 YPC average. So for all running backs who had an above-average YPC number last year, how many carries would we have to remove to get them below 4.41?

    Jones had a 67-yard run last year; take that away, and his YPC drops to 5.02. Remove his next 3 best runs — 33, 30, and 29 yards — and his YPC drops to 4.42. You need to take away his 5th best carry, an 18-yard rush, to drop his YPC to 4.31. So for Jones, the answer is 5 carries is how many you need to take away to get his YPC to below the threshold.

    You might think, hey, this is biased against running backs with a low number of carries! Well, that’s the point! We should be skeptical of placing too much emphasis on a player’s YPC average if that running back doesn’t have a lot of carries. The “leader” in this statistic is actually a two-way tie between Todd Gurley and Gus Edwards. For Gurley, you need to take away his top 6 runs — which were only 36, 29, 26, 24, 24, and 23 yards — to get his YPC down to 4.36. This serves as a good way of noting that Gurley actually had a “down” year when it comes to YPC: he was only a couple of long runs away from an even more dominant season. Edwards had only 127 carries, but he also didn’t have many big runs: even if you take away his best 5 runs, his YPC would drop to 4.45; you need to remove his 6th best carry to get him to 4.34.

    The graph below shows the results for each player who had an above-average YPC last year. The first four columns should be self-explanatory. The “TakeAway” column shows how many carries you need to take away to get that player’s YPC to below 4.41. Note that for Barkley, McCaffrey, and Chubb — despite each topping 5.0 YPC — that answer is only 3! And for Chubb and Barkley, removing their best 5 runs brings both players to a sub-4.00 YPC average. The next 10 columns show the 10 longest runs that player had. Then, the final 10 columns show that player’s YPC average once you remove each of his best X carries. [continue reading…]

    { 0 comments }

    In general, the first running back selected in the Draft finishes as the top rookie running back frequently, all things considered, particularly when the top rookie running back was a high pick (think Todd Gurley or Ezekiel Elliott). Given that there are over 20 rookie running backs most seasons, it is remarkable that the top rookie running back can be the most productive player even more than 25% of the time, which they do.

    That was also the case in 2018, at least if you define productivity by traditional measures (advanced metrics may tell a different story). Saquon Barkley had 1,307 rushing yards, 721 receiving yards, and 15 offensive touchdowns; if you credit each touchdown with an additional 20 yards on top of the yards gained to produce that touchdown, that gives Barkley 2,328 adjusted yards.

    He also was, by far, the running back on whom the most draft capital was spent. Selected with the 2nd overall pick, the Giants used 30.2 points of draft value on Barkley. That’s more than double the value spent on any other running back.

    The graph below shows the draft value and adjusted yards for each rookie running back in 2018. The Y-Axis shows adjusted yards; obviously more is better, and being higher on the chart means more yards. The X-Axis shows draft value, shown in reverse order (you can also think of it as draft pick shown in regular order, but I like my charts to place the best quadrant in the upper right; therefore, draft value is shown from most capital spent to least). [continue reading…]

    { 1 comment }

    I came across this very interesting article: How simple arithmetic cost the Rams a chance to win the Super Bowl.

    And after reading it, I think he is… right.

    There’s an important mathematical rule for using timeouts at the end of football games that almost no NFL coach seems to understand:

    If you’re on defense and want to preserve clock, never call a timeout on a running clock with 2:41–2:45 left in the game.

    Sean McVay violated this by calling a timeout at 2:42 late in the Super Bowl. This cost the Rams ~35 seconds, which would have given them a chance to make an unlikely miracle comeback statistically much more probable.

    The article is definitely worth a read, but in short, McVay erred by using his 2nd timeout after the Patriots 1st-and-10 run with 2:47 to go.  The clock was running, and by calling timeout with 2:42 to go, he prevented the Patriots from being forced to run a play (after their next play) with 2:02 to go, which would have resulted in the play clock being stopped with about 1:58 to go after that play.

    McVay ultimately cost the Rams about 30-35 seconds.  Had every play worked out the same way, the Patriots would have snapped the 2nd-and-7 play with about 2:03 remaining, the 1st-and-10 with ~1:55 remaining, the 2nd-and-6 with ~1:50 remaining (after which you call timeout #2), and the 3rd down play with ~1:45 remaining (after which you call timeout #3).  That would have let the field goal try come with about 1:40 left, rather than 1:16 left (my math results in about 25 additional seconds, rather than 35, but the point remains).

    Kudos to Adam Moelis & Matthew Walla for pointing out an interesting observation that I completely missed.  A good shorthand is to think about how many seconds the 2 minute warning stoppage saves.

    For the defense, the worst thing that could happen is an early-down play gets tackled with 2:40 remaining.  If the official winds the clock with 2:39 to go, and there is *no* 2-minute warning, the next play would be snapped with 1:59 left.  Since there is a 2 minute warning, it would be snapped with 2:00 to go, and the 2-minute warning saves one second.

    The *best* thing that could happen is an early-down play gets tackled with 2:41 remaining.  Now if it’s 3rd down, that’s not so valuable, but if it’s 1st or 2nd down, it sure is.  If the first down play gets tackled with 2:41 remaining, and the defense does NOT call timeout, then the 3rd down play has to be run with 2:01 remaining, which means the punt would happen with about 1:56 remaining (assuming, in all cases, that the defense wins each play).  You want the 2-minute warning to save the maximum amount of time, of course.

    So I agree with their shorthand: “If you’re on defense and want to preserve clock, never call a timeout on a running clock with 2:41–2:45 left in the game.”  I’d add an addendum that this doesn’t apply if it’s 3rd down, but otherwise it looks pretty good to me.  McVay called a timeout after a 1st down run with 2:42 left, a clear blunder.

    What do you think?

    { 2 comments }

    Saquon Barkley Has Been Inefficient In 2018

    Earlier this week, I wrote about about Saquon Barkley and his remarkable traditional statistics but less than stellar efficiency metrics (in part due to New York’s offensive line woes).

    The graph below shows each of Barkley’s carries this season. On the X-Axis, you can see how many yards he gained. On the Y-Axis, you can see how many Expected Points Added was gained on that carry.

    As you can see, Barkley has had 6 very long runs, but the majority of his carries have produced negative EPA. This is in part because running plays are less valuable than passing plays, and in part because over half of his rushing attempts have gained 2 or fewer yards.

    But this gets to a much more important question than how to evaluate Barkley (and remember, “Barkley” here is shorthand for Barkley in the Giants offense, running behind a bad offensive line): it gets to the heart of how do you evaluate running backs overall.

    What do you think?

    { 0 comments }

    Five and a half years ago, I wrote about Julio Jones was in the process of stealing the torch from Roddy White.  In 2012, both Falcons teammates finished in the top 12 in fantasy points scored by wide receivers. At 31, White had 92 catches for 1,351 yards and 7 touchdowns, while a 23-year-old Jones in 2012 had 79 catches for 1,198 yards and 10 TDs.   From 2008 to 2012, White ranked 2nd in receiving yards, tied for 2nd in receiving touchdowns, 3rd in receptions, and 3rd in receiving yards per game.  But the young Jones was about to take the torch from him as the Falcons top target.

    From 2014 to 2018, Antonio Brown ranks 2nd in receiving yards (behind Jones), 1st in receiving touchdowns, 1st in receptions, and 2nd in receiving yards per game.  Now 30 years old, Brown is still in the prime of his career, but like White, he has a teammate 8 years his younger who may be threatening his future.  In this case, it’s 22-year-old JuJu Smith-Schuster who has had a breakout season in 2018.  Both players rank in the top 12 in fantasy points by wide receivers this year, but it’s Smith-Schuster who actually leads the Steelers in both receptions and receiving yards!

    Assuming Smith-Schuster winds up leading the Steelers in receiving yards, Brown will almost certainly finish with one of the best WR2 seasons in history. It also would be one of the more interesting “pass the torch” scenarios in league history (if, of course, Smith-Schuster winds up being the best Steelers receiver over the next few years). [continue reading…]

    { 0 comments }

    The Chiefs are the current 1 seed in the AFC, but the Los Angeles Chargers are hot on their heels: both teams have an 11-3 record, while every other team in the AFC has at least four losses. Kansas City has outscored opponents by 119 points, the best in the AFC; the Chargers have the second best points differential in the conference, however, at +97.

    How rare is it for one division to have the top two teams in a conference by points differential? It hasn’t happened in the NFL since 2012 and 2013, when the Seahawks and 49ers were the class of the NFC. In 2012, Seattle had a conference-best +167 points differential and an 11-5 record, while the 49ers went 11-4-1 with a +124 points differential and made the Super Bowl. The next year, the Seahawks went 13-3 with a +186 points differential; Seattle earned the 1 seed and won the Super Bowl, while San Francisco went 12-4 with a +134 points differential and blew a fourth quarter lead in the NFC Championship Game.

    In 2007, the Giants won the Super Bowl but were not a great team; in ’08, New York was much better, beginning the season 11-1 before the Plaxico Burress incident. The Giants finished 12-4 with a NFC-best +133 points differential. But the Eagles went 9-6-1 with a +127 points differential and snuck into the playoffs, before knocking off the Giants in the second round.

    Those are the only three times since realignment in 2002 that the two best teams — by points differential — in one conference resided in the same division. The last time it happened in the AFC was in 1997 and also involved the Chiefs. That year, the Broncos had a +185 points differential, the best mark in the league. But the Chiefs had the second-best points differential at +143, and stole the AFC West from a fading Denver team. The Broncos started 11-2, but lost road games as underdogs to the Steelers and 49ers, and finished 12-4. Kansas City ended the season on a 6-game winning streak, and finished 13-3; no other AFC team had more than 11 wins.

    In this case, the Chiefs are more like the ’97 Broncos, with the ’18 Chargers playing the role of ’97 Chiefs. In the playoffs, Denver blew out the Jaguars in the first round in a rematch of the ’96 disaster, and then went to Arrowhead for the second round. In that game, the Broncos edged out the Chiefs 14-10, en route to the franchise’s first Super Bowl victory.

    The table below shows all instances since 1970 where two teams in the same division finished with a points differential in excess of 100 points. I would expect the 2018 AFC West will join this list: [continue reading…]

    { 0 comments }
    Previous Posts