≡ Menu

Week 14 Passing Stats: Primetime Flops

You don’t expect to see Jared Goff’s at the bottom of the weekly ANY/A rankings, at least not since his rookie year.  But Goff had the worst game of his career on Sunday night, throwing for only 180 yards while also throwing 4 interceptions and zero touchdowns against the Bears.  Savvy readers will know that since an interception is worth -45 yards in the ANY/A formula, a passer with 180 yards, no TDs, and zero INTs will have an ANY/A of 0.00, regardless of their number of attempts.

Goff also took three sacks, so he finished with an ANY/A of -0.53.  The quarterback on the opposing sideline, Mitchell Trubisky, wasn’t much better. Trubisky threw a touchdown, but picked up just 110 yards while throwing 3 interceptions; he finished with an ANY/A of -0.48 on 31 dropbacks.

And then on Monday Night Football, we saw some more bad passing from a pair of star quarterbacks.  Russell Wilson was the winning quarterback, and the Seahawks became just the second team in the last 9 years to win a game with 60 or fewer passing yards on 20 or more passing stats (the 2017 Seahawks being the other). Wilson finished with an ANY/A of 0.68 and a passer rating of 37.9, the single worst performance of his career.

Kirk Cousins was the losing quarterback on MNF, and while his final statistics don’t look too bad, they are a bit misleading.  Cousins took a strip sack with three minutes to go that was recovered and returned for a touchdown, putting Seattle up 21-0.  After that, Cousins threw for 70 yards and a touchdown on his final 6 meaningless passes; prior to that moment, he was averaging 4.45 ANY/A.  He had thrown for just 5 first downs on his first 29 passes.

The table below shows the weekly passing results: [continue reading…]

{ 0 comments }

Ohio State has beaten Michigan 13 times in the last 14 years. And the only time since 2003 that Michigan beat Ohio State was in 2011, when the Buckeyes were 6-6 and in the bridge year between Jim Tressel and Urban Meyer. And Ohio State nearly pulled off the upset!

For a rivalry known as The Game, it’s been remarkably one-sided for a long time: the last time Michigan beat an Ohio State team of any note, Santonio Holmes and Braylon Edwards were the stars of the game. It’s been awhile.

And yet, this year, both teams are likely in control of their own destiny. The winner of Saturday’s matchup will win the Big 10 East, and head to Indianapolis to face Northwestern in the Big 10 title game. A win there all but guarantees a playoff spot for a 12-1 Michigan team, and a 12-1 Ohio State team would be a favorite to make the college football playoff, too.

Here’s how I’d rank each team’s chances of being one of the four to make the College Football Playoff. Read it as such: keep going down the list until you find four teams that actually exist.

1. SEC Champion Alabama
2. ACC Champion Clemson
3. SEC Champion Georgia
4. 12-0 Notre Dame
5. B10 Champion Michigan

—– Those 5 teams are all “win out and they’re in”, although I note that if Georgia narrowly beats Alabama in an epic SEC Championship Game, there will be some murmurs to take an 12-1 Alabama over a 12-1 Michigan. Both teams will have lost to two playoff teams (Georgia, Notre Dame), and Alabama had been more dominant throughout the season. But the committee seems to value conference championships pretty highly, so I think they would go with Michigan.

6. 12-1 Bama (losing in the SEC Championship Game)
7. 12-1 Big 10 Champion Ohio State
8. 12-1 Big 12 Champion Oklahoma

—– This is the real pressure point for the committee: do you take a 12-1 Ohio State over a 12-1 Oklahoma? The Buckeyes have a much, much worse loss and arguably a tougher schedule. Oklahoma is, subjectively, a better team, too. But the Big 10 has been the better conference this season, and my gut is the committee would take Ohio State at 12-1 over Oklahoma at 12-1. I’d go the other way.

9. 12-1 Pac-12 Champion Washington State

—– Last year, the Pac-12’s best team was USC, and the Trojans playoff hopes were dashed with a Friday night loss on the road against Washington. This year, the Pac-12’s best team is Washington State, and the conference’s best chance to send a team to the playoff was crushed by a Friday night road loss to … USC. Washington State has had a great year, but there are zero notable non-conference games and the Pac-12 as a whole is a down conference. As such, even going 12-1 isn’t enough if there’s a 12-1 conference champion (or a 12-0 Notre Dame or a 12-1 Alabama) still out there.

10. 12-1 Clemson (L-ACCCG)
11. 11-1 Notre Dame

—– Chaos needs to ensue for us to get here.

12. 13-0 UCF
13. B12 Champion West Virginia

Below are the college football SRS ratings through 12 weeks. [continue reading…]

{ 0 comments }

If you knew before today that Ryan Fitzpatrick and Nathan Peterman were going to have historic performances today, you probably would have guessed that they would have been historically bad. In that case, you’d be half right.

Let’s start with Peterman, one of the least pedigreed and deserving week 1 starters in recent memory.  Well, against the Ravens, he completed 5 of 18 passes (27.8%) for just 24 yards with 0 TDs and 2 INTs. That’s a -3.67 AY/A average, since interceptions are worth -45 yards. Add in Peterman’s 3 sacks for 12 sacks, and his ANY/A average is -3.71 (sidenote: it’s remarkable that adding 3 sacks of -4 yards each barely moves the needle! That’s how bad Peterman was). It was just the second time since 2016 that a quarterback had at least 14 pass attempts and an AY/A of -3.5 or worse; the first was Peterman in his first start last year against the Chargers.

Perhaps more “impressive” is that even if we ignores the interceptions and the sacks, Peterman was flat out horrible. He gained 24 yards on his 18 attempts, a pitiful 1.33 Y/A average. In 1997, Tony Graziani of the Falcons also threw for 24 yards on 18 attempts (and also threw 0 TDs and 2 INTs); in fact, since 1982, Graziani and Peterman are the only two quarterbacks to throw 18+ passes and average under 1.35 yards per attempt.  Change the thresholds a little bit — say, 15 passes, 1.50 Y/A — and Peterman is still the only quarterback to hit that mark since the end of the 2009 season (and the games in 2009 both involved significant weather).

Buffalo mercilessly pulled Peterman after 10 drives. Those drives yielded one first down and just 21 yards! The Bills opened the season with seven straight three-and-outs!

Given the modern passing environment, I’m not sure a quarterback can do much worse than what we saw yesterday in Baltimore.

On the other hand, we have Ryan Fitzpatrick.    He completed 21 of 28 passes for 417 yards and 4 TDs. He didn’t take any sacks or throw any interceptions, giving him a yards/attempt average of 14.9 and an ANY/A and AY/A average of 17.75!

How good is that? Since 1970, just five quarterbacks have thrown for 400+ passing yards and also averaged 17.7 AY/A or better.  One was Joe Namath against the Colts in 1972, a game that might be the best passing performance game ever considering the era and opponent.  Mark Rypien had a memorable 6-TD game against the Falcons in 1991 and Nick Foles had a 7-TD game against the Raiders; both of those games make the 400/17.7 AY/A cut-off.  The fourth game was Steve McNair in 2003, and the fifth was Fitzpatrick on Sunday.

Fitzpatrick picked up a first down on 17 of his 28 dropbacks. How remarkable is it to gain a first down on 61% of your pass plays? No team did it last season, and just two (2016 Falcons, 2016 Cowboys; one time each) did it the year before.

It remains to be seen how good the Saints are, but let’s say (perhaps optimistically) that New Orleans allows 5.3 ANY/A again this year in all other games. That would mean Fitzpatrick, who had a 17.75 ANY/A average over 28 dropbacks, would have been 12.45 ANY/A above expectation, which translates to 349 Adjusted Net Yards above expectation. That would rank in the top 15 all-time.

So yeah, it was a pretty darn good day for Fitzpatrick and the Bucs offense. And it’s not the only remarkable game of his career: don’t forget the 6 TD, 0-sack, 0-INT game in 2014 where he averaged over 10 yards per pass.

For now, Bucs fans can sit back and enjoy this remarkable drive chart.

{ 0 comments }

Tom Brady’s Career By Trailing 16 Game ANY/A

Last week, I looked at the Green Bay Packers passing offense since 2008 in trailing 16 game increments. I thought it would be fun to do the same thing today for Tom Brady.

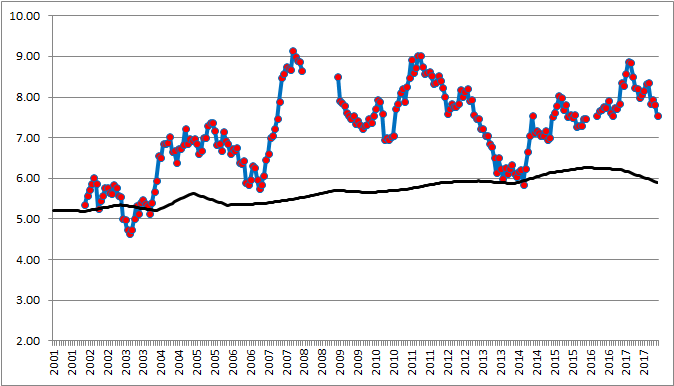
The blue and red line shows Brady’s trailing 16 game Adjusted Net Yards per Attempt. The black line shows the trailing 16 game league average. As you can see, Brady was around league average for awhile, jumped way up prior to 2007, when he jumped way, way up.

The gaps in the line show his injury in 2008 and suspension in 2016. One interesting note is how Brady dipped just below average on his trailing 16 game average after the MNF game against the Chiefs in 2014.

What stands out to you?

{ 0 comments }

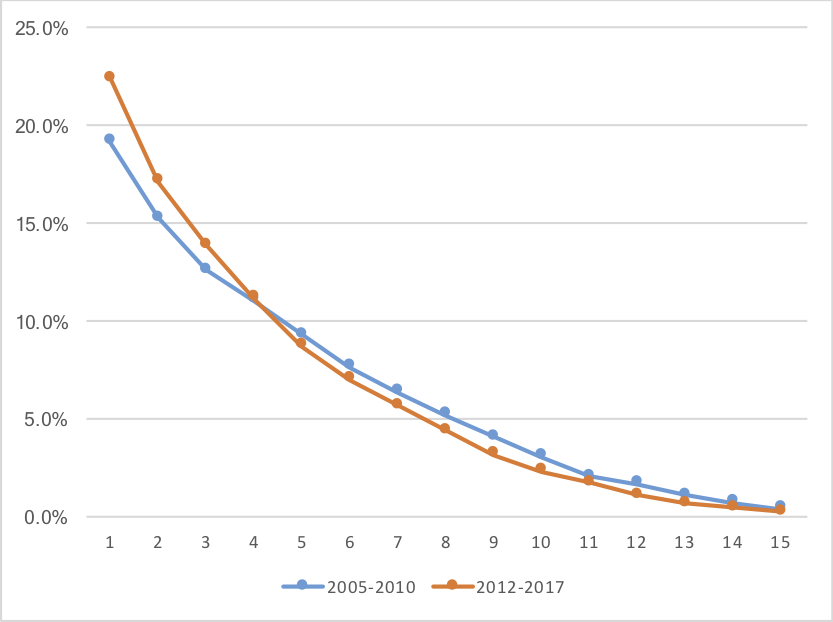
From 2005 to 2010, 42% of all players (minimum one game) in the NFL were in their 5th year or later. Meanwhile, playing in their first three years made up just 47% of all players in the NFL during that time. In other words, there were only a few more of the youngest players than the oldest players (5th plus years) in the NFL.

In 2011, there was a lockout and then the new CBA was instituted. The collective bargaining agreement instituted a very low wage scale for rookies and a higher floor for veterans; as a result, all other things equal, players on rookie contract were much more valuable than veterans due to significantly lower salaries. The 2011 year is a complicated year to analyze because teams scrambled to put together rosters and they didn’t have a chance to fully comprehend the new CBA. But let’s look at 2012 to 2017: during the last six years, less than 36% of all players to play one game in a season was in their 5th year or later, and over 53% of all players were in their first three years.

The graph below shows what percentage of players were in their 1st, 2nd, 3rd, 4th, etc., years of playing status over two sets of eras: 2005 to 2010, and 2012 to 2017.

[continue reading…]

{ 1 comment }

Yesterday, we looked at quarterback records against the spread.  In that post, I noted that Tom Brady and the Patriots have been favorites in a remarkable 52 consecutive games, which would nearly be an NFL record if Brady hadn’t missed any games. For his career, the Patriots have been favored in 232 games that Brady has started, been an underdog 52 times, and the line has been a Pick’em in 4 games.

The table below shows the number of games that each quarterback’s team has been a favorite, underdog, or pick’em since 1978. For quarterbacks who started games before 1978, like Terry Bradshaw, I have played ** next to their name to indicate that this data does not cover their whole career.  Post-1978 Bradshaw, however, has the highest percentage of games as a favorite, followed by Steve Young and then Brady. [continue reading…]

{ 0 comments }

Nobody questions how valuable Rob Gronkowski has been to the Patriots and to Tom Brady. The future Hall of Fame tight end is a dominant force when healthy, and Brady’s numbers with and without Gronk reflect that. With the PFR game play finder, we can easily look at Brady’s career numbers in the regular season on passes to Gronkowski and to everyone else.

[Note: I still am not a fan of using per-target statistics to judge wide receivers, but I find them an interesting — but certainly not definitive — part of the puzzle when looking at quarterback production. Also note: all statistics in this post are from the PFR game play finder, so they may differ slightly from official numbers.]

Here are a few stats to consider:

  • Gronk has seen 8.2% of Brady’s career targets, but is responsible for 10.7% of his career passing yards (+2.6%).
  • On passes to Gronk, Brady has averaged 9.95 yards per attempt; on passes to all other Patriots, Brady has averaged 7.36 yards per attempt, a whopping 2.59 yards/attempt lower.
  • Thought of another way, Gronkowski has elevated Brady’s yards per attempt by 0.21, as Brady has a career yards / attempt average of 7.57.

So yes, Gronk has been great.  [1]And note that using yards is not even the best way to show how valuable Gronk has been.  He’s responsible for 15.3% (!) of Brady’s career touchdowns.; But so has Jordy Nelson, who has been a critical part of the success that Aaron Rodgers has had in Green Bay.  Let’s look at those same numbers:

  • Nelson has seen 14.6% of Rodgers’ career passes, but he is responsible for 18.0% (+3.3%) of his career passing yards.
  • On passes to Nelson, Rodgers has averaged 9.81 yards per attempt; on passes to all other Packers, Rodgers has averaged 7.67 yards per attempt, 2.14 yards/attempt lower.
  • Nelson has elevated Rodgers’ career yards per attempt average by 0.31, as Rodgers has a career Y/A average of 7.98.

Gronkowski being +2.59 Y/A better than all other Patriots is a remarkable figure, and Nelson being at “just” +2.14 doesn’t quite compare.  But due to volume, Nelson has actually raised his quarterback’s career average by a much larger degree.

I used the PFR game play finder to look at the passing breakdown of Brady, Rodgers, and also Drew Brees and Peyton Manning. Some nuggets:

  • Marvin Harrison was responsible for 16.6% of Manning’s targets, the highest in the bunch. Brady is the only quarterback of the bunch who didn’t throw even 9% of his targets to one player; Rodgers, meanwhile, has seen four different receivers (Nelson, Randall Cobb, Greg Jennings, and James Jones) on the receiving end of at least 9% of his passes. This is in part because Rodgers has had a shorter career, and also the general lack of roster turnover in Green Bay.
  • More than any other quarterback, Brees has made a living off of secondary weapons. Kenny Stills (11.82 yards/target, 133 targets), Robert Meachem (10.74, 251), and Devery Henderson (10.27, 384) were the only three players to average over 10 yards per target on at least 100 targets.
  • Brees throws a ton to running backs, and they also kill his average. Among players for these four quarterbacks who were responsible for at least 2.5% of their quarterback’s targets, Brees has the three players with the lowest average gains: LaDainian Tomlinson, Reggie Bush, and Mark Ingram.
  • Nothing stands out immediately to me about Manning: as you would suspect, Reggie Wayne, Harrison, and Demaryius Thomas are the three who have helped him the most, but not to a particularly noteworthy degree. Harrison had the most targets, Wayne bumped his average up the most (+0.16), and Thomas had the best average gain (9.32).

[continue reading…]

References

References
1 And note that using yards is not even the best way to show how valuable Gronk has been.  He’s responsible for 15.3% (!) of Brady’s career touchdowns.
{ 1 comment }

Yesterday, I looked at how much the NFL was relying on highly-drafted passers. The answer: quite a bit, as 50% of passes were thrown by a quarterback drafted in the top 32 or top 18 in each of the last three years.

That is certainly significant, but it’s not groundbreaking, either. Allow me to transport you back to 1972. The NFL had 26 teams, and 14 of those teams had a starting quarterback drafted in the top 10 or earlier! This includes Archie Manning (Saints), John Hadl (Chargers), Jim Plunkett (Patriots), Craig Morton (Cowboys), Norm Snead (Giants), Joe Namath (Jets), Roman Gabriel (Rams), Terry Bradshaw (Steelers), Mike Phipps (Browns), Len Dawson (Chiefs), Dan Pastorini (Oilers), Steve Spurrier (on the 49ers along with top-5 pick John Brodie), Marty Domres (Colts), and Earl Morrall (on the Dolphins along with top-5 pick Bob Griese). [1]Complicating things a bit was before 1967, there were two drafts: one by the NFL, and one by the NFL. Hadl was drafted 10th overall in the NFL Draft, and in the third round of the AFL Draft. Morton … Continue reading

The non-top 10 picks that year that were starters included Fran Tarkenton, Ken Anderson, Daryle Lamonica, Billy Kilmer, and Johnny Unitas. It may not have been a great passing year because of the rules in place at the time, but it sure had a lot of great quarterbacks. This was an era of Hall of Fame quarterbacks, even if 1972 just missed both Bart Starr and Dan Fouts.

On the other end of the spectrum is the 2001 season. An undrafted Jon Kitna, playing for the Bengals, led the NFL in pass attempts. Brad Johnson (Tampa Bay), was third in attempts; Aaron Brooks (Saints) and Rich Gannon (Raiders) rounded out the top 5, and neither was drafted in the first three rounds.

Kurt Warner (Rams, undrafted), Chris Weinke (Panthers, 106th pick), Trent Green (Chiefs, 222nd), Doug Flutie (Chargers, 285th), and Jeff Garcia (49ers, undrafted) all had 500+ pass attempts. Mark Brunell (Jaguars, 118), Elvis Grbac (Ravens, 219), Jay Fiedler (Dolphins, undrafted), Tom Brady (Patriots, 1999) and Jim Miller (Bears, 178) were starters, too. And Matt Hasselbeck (Seahawks, 187) and Alex Van Pelt (Bills, 216) led their teams in pass attempts, too. And backups in the NFC North (Ty Detmer, Shane Matthews, and Mike McMahon) combined for nearly a full season, too, and all were late round or undrafted quarterbacks.

If you sort each passer by draft order, you can see which draft pick is necessary to cross the 50% threshold. In 1972, you only had to go to the 10th pick; in other words, half of all passes that year came from players selected in the top 10 of the NFL or AFL Draft. In 2001, you had to go all the way down to pick 106. Over the last few years, the average is just north of the 20th overall pick.

The graph below shows the median passer (by draft slot) in each year since the merger: [continue reading…]

References

References
1 Complicating things a bit was before 1967, there were two drafts: one by the NFL, and one by the NFL. Hadl was drafted 10th overall in the NFL Draft, and in the third round of the AFL Draft. Morton was drafted 5th overall in the NFL Draft, and in the tenth round of the AFL Draft. Snead was a 2nd overall NFL pick, and a 5th round AFL selection.  I have used their NFL Draft choices in all instances, because I think that better reflects their prospective ability: they were low AFL draft picks because the AFL teams didn’t think they had a great chance at getting the player.  Hadl went to San Diego because the Chargers would let him play quarterback, while the Lions wanted him at running back. Gabriel was a top-two pick in both drafts. Namath was the first overall pick in the AFL Draft, and fell in the NFL Draft because the league didn’t think they could sign him.
{ 0 comments }

You can hear me on the Bill Barnwell podcast today discussing the origins of the draft value chart, why the top picks are overvalued, and why it still might be a good idea to overpay to trade up in the draft.

Listen here or on iTunes.

{ 0 comments }

Trivia: Youngest Receiving Stars

There have been only two players in NFL history to record a 100-yard receiving game before turning 21 years old. Can you name them?

Trivia hint 1 Show


Trivia hint 2 Show


Trivia hint 3 Show


Click 'Show' for the Answer Show

The Steelers rookie was the youngest player since the NFL merger to record a catch: he was 20 years, 299 days old when he recorded his first NFL reception. He is remarkably young, of course: he was the youngest player in the 2017 NFL Draft and also one of the most productive as a rookie. As a sophomore at USC, Smith-Schuster had 1,454 yards in 14 games. He had 123 receiving yards in his first game in college, which came three months shy of his 18th birthday.

He had a remarkable rookie season even if you consider him just an average 21-year-old, and not a really young 21-year-old:

Query Results Table
Games Receiving
Rk Player Year Age Draft Tm Lg G GS Tgt Rec Yds
Y/R TD Y/G Ctch% Y/Tgt
1 Randy Moss* 1998 21 1-21 MIN NFL 16 11 124 69 1313 19.03 17 82.1 55.6% 10.59
2 Amari Cooper 2015 21 1-4 OAK NFL 16 15 130 72 1070 14.86 6 66.9 55.4% 8.23
3 Mike Evans 2014 21 1-7 TAM NFL 15 15 122 68 1051 15.46 12 70.1 55.7% 8.61
4 Keenan Allen 2013 21 3-76 SDG NFL 15 14 105 71 1046 14.73 8 69.7 67.6% 9.96
5 Sammy Watkins 2014 21 1-4 BUF NFL 16 16 128 65 982 15.11 6 61.4 50.8% 7.67
6 JuJu Smith-Schuster 2017 21 2-62 PIT NFL 14 7 79 58 917 15.81 7 65.5 73.4% 11.61
7 Josh Gordon 2012 21 2-1 CLE NFL 16 13 96 50 805 16.10 5 50.3 52.1% 8.39
8 DeAndre Hopkins 2013 21 1-27 HOU NFL 16 16 91 52 802 15.42 2 50.1 57.1% 8.81
9 Percy Harvin 2009 21 1-22 MIN NFL 15 8 91 60 790 13.17 6 52.7 65.9% 8.68
10 Hakeem Nicks 2009 21 1-29 NYG NFL 14 6 74 47 790 16.81 6 56.4 63.5% 10.68
11 Larry Fitzgerald 2004 21 1-3 ARI NFL 16 16 115 58 780 13.45 8 48.8 50.4% 6.78
12 Jeremy Maclin 2009 21 1-19 PHI NFL 15 13 91 56 773 13.80 4 51.5 61.5% 8.49
13 Reggie Bush 2006 21 1-2 NOR NFL 16 8 121 88 742 8.43 2 46.4 72.7% 6.13
14 Antonio Bryant 2002 21 2-63 DAL NFL 16 15 93 44 733 16.66 6 45.8 47.3% 7.88
15 Kenny Britt 2009 21 1-30 TEN NFL 16 6 75 42 701 16.69 3 43.8 56.0% 9.35
16 Christian McCaffrey 2017 21 1-8 CAR NFL 16 10 113 80 651 8.14 5 40.7 70.8% 5.76
17 Kenny Stills 2013 21 5-144 NOR NFL 16 10 50 32 641 20.03 5 40.1 64.0% 12.82
18 Andre Reed* 1985 21 4-86 BUF NFL 16 15 48 637 13.27 4 39.8
19 Ricky Nattiel 1987 21 1-27 DEN NFL 12 3 31 630 20.32 2 52.5
20 Gern Nagler 1953 21 14-167 CRD NFL 11 11 43 610 14.19 6 55.5
Provided by Pro-Football-Reference.com: View Original Table
Generated 3/26/2018.

Something particularly notable about his production last year? His catch rate was over 70% and his yards per reception was over 15, all while gaining at least 800 yards. Since 1992, he was just the 4th player to hit those three marks:

Query Results Table
Games Receiving
Rk Player Year Age Draft Tm Lg G GS Tgt Rec Yds Y/R TD Y/G Ctch% Y/Tgt
1 Jordy Nelson 2011 26 2-36 GNB NFL 16 9 96 68 1263 18.57 15 78.9 70.8% 13.16
2 Tyreek Hill 2017 23 5-165 KAN NFL 15 13 105 75 1183 15.77 7 78.9 71.4% 11.27
3 John Taylor 1993 31 3-76 SFO NFL 16 16 74 56 940 16.79 5 58.8 75.7% 12.70
4 JuJu Smith-Schuster 2017 21 2-62 PIT NFL 14 7 79 58 917 15.81 7 65.5 73.4% 11.61
Provided by Pro-Football-Reference.com: View Original Table
Generated 3/26/2018.

When it comes to projecting future NFL success, Smith-Schuster had about as good a rookie year as it gets: not only was he incredibly young, but he was also remarkably efficient and very productive.

{ 0 comments }

FBG Free Agent Tracker

This is the busiest week of the year for roster turnover. I’m short on time today, but wanted to alert all of you that Footballguys.com has a free agency tracker for all your needs.

http://subscribers.footballguys.com/apps/freeagenttracker.php?sortby1=rel&filter=

Please use the look and let us know what you think have been the most interesting moves of the week!

{ 0 comments }

Receiving Success Rate (2017)

Yesterday, I wrote about Mike Evans and how 68 of his 71 receptions were “successful” receptions. Today, I’m going to present that data for all top wide receivers, tight ends, and running backs.

A “successful” reception is one that picked up a first down on 3rd or 4th down, gained 60% of the necessary yards on 2nd down, or 40% of the necessary yards on 3rd down.

PlayerPosTarRecYardsFDTDFD%Yd/RecSR
Mike EvansWR13671100455577%14.196%
Marquise GoodwinWR1045696246282%17.295%
Marvin JonesWR10861110144972%18.093%
Hunter HenryTE624557932471%12.993%
DeAndre HopkinsWR169961378701373%14.493%
Julio JonesWR14888144567376%16.492%
Kelvin BenjaminWR784869230363%14.492%
Kenny StillsWR1035884738666%14.691%
Rob GronkowskiTE10469108357883%15.791%
Alshon JefferyWR1215778944977%13.891%
Keelan ColeWR754073531378%18.490%
Rishard MatthewsWR875379536468%15.089%
Mike WallaceWR925274833463%14.488%
Seth RobertsWR654345522151%10.688%
Antonio BrownWR163101153372971%15.288%
Albert WilsonWR634255432376%13.288%
DeSean JacksonWR915066836372%13.488%
Stefon DiggsWR946484943867%13.388%
Cooper KuppWR946286943569%14.087%
Jared CookTE855468735265%12.787%
Ted GinnWR705378732460%14.887%
Davante AdamsWR11874885461062%12.086%
Keenan AllenWR159102139574673%13.786%
Brandin CooksWR11365108243766%16.686%
Devin FunchessWR1096384041865%13.386%
Michael ThomasWR149104124570567%12.086%
Cameron BrateTE774859134671%12.385%
Paul RichardsonWR754163830673%15.685%
A.J. GreenWR14175107856875%14.485%
T.Y. HiltonWR1025493635465%17.385%
Zach ErtzTE1107482447864%11.185%
Mohamed SanuWR956770341561%10.585%
Jordy NelsonWR895348238672%9.185%
Jermaine KearseWR1026581037557%12.585%
Michael CrabtreeWR1025861835860%10.784%
Kyle RudolphTE825753232856%9.384%
Robby AndersonWR1136394136757%14.984%
Danny AmendolaWR856166240266%10.984%
Eric DeckerWR835456331157%10.483%
Jimmy GrahamTE8953459291055%8.783%
Emmanuel SandersWR944755530264%11.883%
Tyreek HillWR10575118341755%15.883%
Pierre GarconWR664049925063%12.583%
DeVante ParkerWR965767133158%11.882%
Delanie WalkerTE1107480844359%10.982%
Adam ThielenWR14391127860466%14.082%
Marqise LeeWR955670240371%12.582%
Travis KelceTE12283103855866%12.582%
Sterling ShepardWR845973136261%12.481%
JuJu Smith-SchusterWR795891739767%15.881%
Demaryius ThomasWR1388395054565%11.481%
Doug BaldwinWR1127295643860%13.381%
Robert WoodsWR855678137566%13.980%
Martavis BryantWR835060330360%12.180%
Evan EngramTE1146472237658%11.380%
Charles ClayTE734955829259%11.480%
Terrance WilliamsWR785356931058%10.779%
Amari CooperWR944868030763%14.279%
Vernon DavisTE684364923353%15.179%
Adam HumphriesWR836163135157%10.379%
Dez BryantWR1336983944664%12.278%
Julius ThomasTE614138818344%9.578%
Larry FitzgeraldWR161109115666661%10.678%
Ryan GrantWR654557329464%12.778%
Jason WittenTE886356026541%8.978%
Jack DoyleTE1027566335447%8.877%
Tyrell WilliamsWR704372830470%16.977%
Jesse JamesTE644337220347%8.777%
Kendall WrightWR915961433156%10.475%
Nelson AgholorWR946276836858%12.474%
Jarvis LandryWR15711298761954%8.874%
Trent TaylorWR614343127263%10.072%
Eric EbronTE875357432460%10.872%
Tyler KroftTE614240423755%9.671%
Christian McCaffreyRB1148065136545%8.171%
Jamison CrowderWR1046680037356%12.171%
Brandon LaFellWR845254825348%10.571%
Tyler LockettWR644148822254%11.971%
Golden TateWR12092100345549%10.971%
Todd GurleyRB886478831648%12.370%
Jeremy MaclinWR714044023358%11.070%
George KittleTE634351523253%12.070%
LeVeon BellRB1058565531236%7.769%
Alvin KamaraRB1018182738547%10.269%
Randall CobbWR926665329444%9.967%
Austin HooperTE654952619339%10.765%
Austin Seferian-JenkinsTE745035718336%7.164%
James WhiteRB735642925345%7.763%
Duke JohnsonRB927469334346%9.462%
Kareem HuntRB655345518334%8.660%
Jerick McKinnonRB685142020239%8.259%
Carlos HydeRB896036018030%6.058%
Melvin GordonRB835847622438%8.257%
Theo RiddickRB715344420238%8.457%
LeSean McCoyRB775944823239%7.656%
Mark IngramRB715841619033%7.255%
Shane VereenRB53442548018%5.852%
Javorius AllenRB604625016235%5.450%
Giovani BernardRB614338016237%8.849%
Tarik CohenRB715335410119%6.740%

As for Bears rookie Tarik Cohen, he had just 40% of his 53 receptions be successful! That was remarkable, but you can view all of his receptions here and see the results for yourself, including seven catches for zero or negative yards.

What stands out to you?

{ 11 comments }

A pair of Valentine’s Day babies

There have been 45 quarterbacks in NFL history to throw for at least 30,000 yards. I write about this nearly every year, as not much changes. Three of them — Drew Bledsoe (born February 14, 1972), Jim Kelly (2/14/1960), and Steve McNair (2/14/1973) — were all born on February 14th.

If we drop the cut-off to 16,000 yards, we jump to 139 quarterbacks but get to include David Garrard, another Valentine’s Day baby (1978). But wait, there’s more: If we drop the threshold to 3,500 passing yards, we get to include Patrick Ramsey and Anthony Wright. Those guys may not impress you, but consider that only 337 players have thrown for 3,500 yards. That means dozens of days have zero quarterbacks with 3,500 yards — including New Year’s Day, another February holiday (Groundhog Day), Cinco De Mayo, Halloween, and Christmas Eve — so slotting in Ramsey and Wright as QB5 and QB6 on your birthday dream team is pretty damn good. [continue reading…]

{ 5 comments }

After the 2015 season, there were seven new head coaching hires. All seven were offensive head coaches, as part of a three-year coaching sandwich that focused on one side of the ball.

  • Adam Gase to the Miami Dolphins was one of three high-profile hires.  But after a strong first season, the shine has worn off in South Beach. Gase’s Dolphins struggled everywhere except the scoreboard for awhile, but after a 6-10 season in year two, Miami looks no closer to finding long-term success than it was prior to Gase.
  • Another sexy hire was Hue Jackson to Cleveland, who was also the lone minority hire from 2014-2015. Unfortunately, Jackson has been hired to be the Browns head coach as many times as he’s won games as the Browns head coach.
  • After being fired by the Eagles, Chip Kelly still landed in San Francisco as a high-profile hire. Of course, he flamed out quickly, going 2-14 in his lone season with the 49ers. He’s now the UCLA head coach after taking the 2017 season off from coaching.
  • The New York Giants promoted Ben McAdoo from offensive coordinator to head coach; that went well for a year, but McAdoo couldn’t even last a full two years despite making the postseason in year one
  • Dirk Koetter joined McAdoo as offensive coordinators that were promoted to take over for fired head coaches. Koetter, like Gase and McAdoo, was much better in year one than in year two. He wasn’t fired, but a 4-11 start in 2017 put him on the hot seat.
  • Mike Mularkey went 2-7 as the Titan’s interim head coach in 2015, and then somehow got the fulltime job.  After an impressive 2016 and an up-and-down 2017, Mularkey’s Titans made the playofs…. but he was still fired after the season, to make room for Mike Vrabel. Random factoid that may only interest me: three of the last four Tennessee coaches were named Mike, and in the last 30 years, all Titans coaches have been named Mike, Ken, Jeff, Jack, or Jerry.

[continue reading…]

{ 19 comments }

Super Bowl Betting History

Super Bowl LII features the New England Patriots and the Philadelphia Eagles. The Patriots are favored by 5 points (the line opened at NE -5.5) and the over/under is 48 points. There have been 51 prior Super Bowls, so how do those lines compare?

  • On average, the point spread has been 6.9 points with an over/under of 44.2 points. The average final score? Winning team 30.2, losing team 16.1. In the Patriots era (i.e., 2001-2016), the average spread has been 5.4 points, with an over/under of 48.4 points, nearly perfectly matching this year’s numbers.
  • Underdogs are 16-34 straight up in Super Bowls (the Seahawks/Patriots Super Bowl line was a push). The last 8 Super Bowl champions all covered the spread, in part because of low lines (none higher than 5 points) and in larger part because four of the last five Super Bowl champions were underdogs. Overall, underdogs are 22-26-2 against the spread.
  • There have been just six Super Bowls where the spread mattered (i.e., the underdog covered the spread but still lost): Steelers/Cowboys in ’75, 49ers/Bengals in ’88, Cowboys/Steelers in ’95, Patriots/Panthers in 2003, Patriots/Eagles in 2004, and Steelers/Cardinals in 2008.
  • The “over” has hit in 4 of the last 5 games, bringing the Over’s mark to 27-24 overall.

The table below shows the full results. [continue reading…]

{ 27 comments }

The Philadelphia Eagles are the #1 seed in the NFC, and they got there despite nearly half of their team’s starts coming from players who were on other teams. Of the 352 starts (16 * 22) for the team this season, 166 came from players who are not lifelong Eagles. Eighteen players had 11+ starts for Philadelphia, with half of those players not being homegrown. Note: All players in today’s post are included if they played a single game for a team this year or in prior years, regardless of whether or not they are no longer on that team (in say, the case of Adrian Peterson). Call this the lazy way out. [continue reading…]

{ 1 comment }

With the 2017 season in the books, I wanted to review the top offenses and defenses from the regular season. Today we will look at how each team did in the four major categories: passing offense, rushing offense, passing defense, and rushing defense.

Passing Offense

The base stat we use to measure passing offenses is Adjusted Net Yards per Attempt, but if we want to be even more precise, we should incorporate first downs. As a result, the formula is:

(Passing Yards (net of sack yards lost) + Passing Touchdowns * 11 + First Downs * 9 – Interceptions * 45) divided by (Attempts + Sacks)

In the table below, we are using team passing yards, which already deducts sack yards lost. And since every touchdown is automatically a first down, this means that all touchdowns are worth 20 adjusted yards. But to not make them worth 29 yards, we have to only credit each touchdown with 11 yards.

Drew Brees and the Saints had the top passing offense by this measure, although the Patriots and Chargers passing attacks weren’t far behind. The Browns were, by a large margin, the worst passing offense in the NFL, with the Broncos and Packers joining them in the bottom three. [continue reading…]

{ 20 comments }

The Jets Outlook vs. the Saints is Petty Ugly

As it stands, Bryce Petty and the Jets are 17-point underdogs this Sunday in New Orleans. Here are the 15 largest spreads the New York Jets have faced since 1978:

Query Results Table
Vegas
Rk Tm Year Date Time LTime Opp Week G# Day Result OT Spread
vs. Line Over/Under Result
1 NYJ 2007 2007-12-16 1:02 1:02 @ NWE 15 14 Sun L 10-20 20.5 covered 41.0 under
2 NYJ 1992 1992-12-06 1:00 1:00 @ BUF 14 13 Sun W 24-17 17.0 covered 36.0 over
3 NYJ 2016 2016-12-24 1:00 1:00 @ NWE 16 15 Sat L 3-41 17.0 not covered 45.0 under
4 NYJ 2007 2007-11-22 4:20 3:20 @ DAL 12 11 Thu L 3-34 14.5 not covered 47.5 under
5 NYJ 2017 2017-09-17 4:05 1:05 @ OAK 2 2 Sun L 20-45 14.0 not covered 44.0 over
6 NYJ 1984 1984-11-26 9:00 9:00 @ MIA 13 13 Mon L 17-28 13.5 covered 45.0 push
7 NYJ 1989 1989-12-17 4:00 1:00 @ RAM 15 15 Sun L 14-38 13.0 not covered 43.0 over
8 NYJ 1996 1996-12-08 4:00 4:00 @ NWE 15 14 Sun L 10-34 13.0 not covered 43.5 over
9 NYJ 2005 2005-11-20 4:15 2:15 @ DEN 11 10 Sun L 0-27 13.0 not covered 41.0 under
10 NYJ 1978 1978-10-01 1:00 1:00 PIT 5 5 Sun L 17-28 12.5 covered 0.0 over
11 NYJ 1996 1996-09-15 1:00 1:00 @ MIA 3 3 Sun L 27-36 12.5 covered 39.5 over
12 NYJ 1992 1992-12-20 8:00 8:00 @ MIA 16 15 Sun L 17-19 11.5 covered 37.0 under
13 NYJ 2013 2013-09-12 8:29 8:29 @ NWE 2 2 Thu L 10-13 11.5 covered 43.0 under
14 NYJ 1987 1987-10-11 1:00 1:00 @ IND 5 4 Sun L 0-6 11.0 covered 0.0 over
15 NYJ 2009 2009-11-22 4:15 4:15 @ NWE 11 10 Sun L 14-31 11.0 not covered 45.0 push

[continue reading…]

{ 2 comments }

Note: The data in today’s post is current through week 10 but excluding the Monday Night game between Carolina and Miami.

The Jets, behind Josh McCown, rank 3rd in the NFL in completion percentage this season, with a nominally impressive 69.1% rate. However, as noted last month, that was pretty misleading — and it still is.

The Jets are one of just four teams that have picked up first downs on fewer than half of their completed passes, and the other three teams are a who’s who of ugly quarterback play this year (Ravens, Dolphins, and Giants). The Bears and Browns round out the bottom six, while the Texans (RIP Deshaun Watson) lead the NFL in this metric.

But if first downs per completed pass is akin to yards per completion — an interesting statistic but better used to describe style than competency — than first downs per pass play (including sacks) is the more useful metric (this is similar to Net Yards per Attempt). After all, on a dropback, if a quarterback throws for a first down, it’s a good pass play; if a first down is not picked up, it usually wasn’t a good pass play.

So first downs per pass play (again, including sacks) is a good measure of an offense’s success rate. And you probably won’t be too surprised to see that the Patriots and Saints lead the NFL in that metric this year. Apparently, Tom Brady and Drew Brees are pretty good at keeping their offenses on schedule. The Chiefs, Falcons, and Rams rank in the top 5 in this metric as well.

Let’s use the Patriots line to explain how to read the table below. New England has completed 234 of 346 passes, a 67.6% completion rate that ranks 4th in the NFL. The Patriots have taken 22 sacks but picked up 142 first downs. New England has picked up a 1st down on 60.7% of its completed passes, and 38.6% of its pass plays. That ranks 1st in the NFL, and is the metric by which the table below is sorted. [continue reading…]

{ 3 comments }

The JaMarcus Russell Raiders weren’t very good, and that includes the 2009 season, Russell’s last with the team. That year, Oakland scored 197 points in 16 games, one of just five teams from ’02 to ’16 to finish a season with fewer than 200 points.

In 2010, Jason Campbell and Bruce Gradkowski took over, and Darren McFadden returned from injury to have the biggest year of his career. The 2010 Raiders scored 410 points and finished 6th in scoring, but here’s the money stat. Through 8 games, Oakland had scored 212 points, exceeding their 2009 points total in half a season!

Is that unusual, you ask? Well, yes it is.  In fact, the 2010 Raiders are the only team to outscore the franchise’s team the prior season (in the 16-game season era) after just 8 games.  But the Raiders are about to have some company.

In 2016, the Jared Goff and Case Keenum Rams scored just 224 points, fewest in the NFL.  This year, through 7 games, the Goff-led Rams have already scored 212 points, which was the most in the NFL prior to the team’s week 8 bye! That’s a rags-to-riches story of remarkable proportions.  But for today’s purposes, note that Los Angeles is just 13 points away from exceeding last year’s total. The Ramsface the Giants this weekend.  Assuming L.A. can score a couple of touchdowns, they will join the Raiders as the only teams to exceed last year’s points total in just 8 games (again, during the 16-game season era).

In fact, only seven other teams in the 16-game era have outscored their slightly older brothers after 9 team games. Those are the 2013 Chiefs, 2007 Browns, 2006 Bears, 2001 Browns, 1999 Rams, 1994 Colts, and 1993 Seahawks.

{ 7 comments }

Unsustainable (But Fun!) Stats Through Three Games

Three games is an extremely small sample size, so let’s consider today Freaky Friday. What stats are great to look at but have no chance of being sustainable?

Jared Goff is currently averaging 10.14 ANY/A; no player has ever reached double-digit ANY/A over the course of a full season. If Goff were to miss the rest of the season, he would actually break the record for most attempts in a season with double digit ANY/A.

Alex Smith has a 132.7 passer rating over 84 attempts; no player has reached such lofty passer rating levels over a season with even 34 attempts.  Smith is also completing over 77% of his pass attempts: no player has done that in a season with even 40 attempts.

Another Chief, rookie RB Kareem Hunt, is having a remarkable season, too.  He’s averaging 133.7 rushing yards per game, which would rank as the 2nd best in NFL history if he maintained that average.  Hunt is also averaging 179.3 yards from scrimmage per game, more than 15 yards per game higher than any player has ever produced in a season.  Among players to average at least 45 receiving yards per game in a season, Hunt is also the leader in rushing yards per game by a wide margin.

And here’s one from Adam Harstad: Redskins RB Chris Thompson is averaging over 30 rushing yards and 70 receiving yards per game; that’s probably not sustainable.  Another unsustainable Thompson stat: among players with at least 12 receptions and 12 rush attempts, Thompson would be just the 5th player since the merger to average 8 yards per rush and 16 yards per reception.

Perhaps more sustainable is what Antonio Brown is doing.  In 2015, he averaged 114.6 receiving yards per game, the 9th best mark in league history.  Right now he is at 118.0 yards per game, which would land in 6th place over the course of a full season.

Patriots addition Brandin Cooks is averaging 25.6 yards per catch through 10 catches. If that holds, he would be just the 4th player since 1990 to do so (minimum 10 receptions), and none of the first three had more than 16 receptions.

Jadeveon Clowney has three fumble recoveries in three games.  The record for fumble recoveries by a defensive player is 9, set by Don Hultz with the Vikings in 1963.

Dallas DE Demarcus Lawrence has 7 sacks through three games, which is another unsustainable pace.  The record, of course, is 22.5* sacks, set by Michael Strahan in 2001.


{ 18 comments }

Footballguys.com – Why Subscribe?

Regular readers know that I’m one of the writers at Footballguys.com. If you are a hardcore fantasy footballer (or daily fantasy sports player), you probably already know that Footballguys.com is the single best source for fantasy football information. If you are a more casual fantasy football player, you’ll find that the tools available at Footballguys will make life much, much easier for you to win your league(s). Either way, I think you’ll find FBG to be worthwhile at $29.95 for one season of the Insider PRO and $44.95 for the Insider PRO Plus.

I don’t make extra money if more people sign up for Footballguys or buy an app, but I hope my readers subscribe because I think a subscription is a really good deal. If you play fantasy football and want to win your competitive league or save hours doing research for your local league, a Footballguys subscription is well worth it. You get: [continue reading…]

{ 1 comment }

2016 AV-Adjusted Team Age: Offense

After each of of the last five years, I’ve presented the AV-adjusted age of each roster in the NFL. Measuring team age in the NFL is tricky. You don’t want to calculate the average age of a 53-man roster and call that the “team age” because the age of a team’s starters is much more relevant than the age of a team’s reserves. The average age of a team’s starting lineup isn’t perfect, either. The age of the quarterback and key offensive and defensive players should count for more than the age of a less relevant starter. Ideally, you want to calculate a team’s average age by placing greater weight on the team’s most relevant players.

My solution has been to use the Approximate Value numbers from Pro-Football-Reference.com, and to calculate age using each player’s precise age as of September 1 of the year in question.  Today, we will look at offenses; tomorrow, we will crunch these same numbers for team defenses. The table below shows the average AV-adjusted age of each offense, along with its total number of points of AV. Last year, the Rams, Jaguars, and Titans were the three youngest offenses. Each of those three are still in the top five this year, joined by the Bucs at #1 and the Seahawks at #4. [continue reading…]

{ 1 comment }

The most talented quarterback Kelly got to work with was a 33-year-old Vick

During Chip Kelly’s up-and-down NFL tenure, he started six quarterbacks across four seasons and two teams.  Nick Foles started 18 games for Kelly’s Eagles, the most of any quarterback; Sam Bradford started 13, Colin Kaepernick 11, Mark Sanchez 10, Michael Vick 6, and Blaine Gabbert 5. If that doesn’t sound like the greatest collection of quarterbacks to you, well, you’re right. Gabbert and Foles were terrible when not coached by Kelly, and Bradford has a career 0.408 winning percentage in games without Kelly.

The other three have winning records without Kelly, but there are other circumstances to consider. Sanchez won 53.2% of his games with the Jets, but his winning percentage in non-Kelly games were heavily inflated by the Jets supporting cast. Vick was 33 years old by the time Kelly came to Philadelphia, with his best days behind him. And Kaepernick? Well, he was on a significant decline before Kelly arrived in San Francisco, and his political stance may have impacted his style of play in 2016.
[continue reading…]

{ 8 comments }

Adam On Depression

Regular readers know Adam Harstad, a longtime friend and co-writer of mine at Footballguys.com. Adam, who is known as the second-best trivia expert on the FBG staff, is a frequent guest poster here and a good follow on @AdamHarstad.

If you’re curious about a look behind the Football Perspective posting curtain, I write most of my articles in the morning. I spend an hour between waking up and going to the gym where I catch up on life things and also draft an article for this site.

Today, I didn’t have time to do that. That’s because I was busy reading Adam’s article (posted on his own site) about depression.  It’s a long article (here’s the executive summary) but that’s a feature, not a bug.  Adam put together a very revealing and thoughtful bit of writing about a really serious and important topic. I am no expert on mental health, but I know depression is bad for at least two reasons: a lot of people suffer from it, and it has an enormous impact on those suffering from it.

It’s not easy to expose yourself to the world the way Adam has, and I commend him for it. Even more impressive: Adam admits and acknowledges that he hasn’t won, but that posting this article is part of his process in trying to overcome depression.  He said that public shame is a powerful motivator, and posting this would perhaps help him in this battle.  So if me posting this helps him help himself, hey, I’m happy to.

I also wanted to post it here to show Adam that we all support him, even if he knows that already.  And I’m sure there are other FP readers  dealing with depression in all of its stages and depths, so  I think reading Adam’s story can be helpful. If you have the time, I encourage you to read Adam’s article in full. And if you don’t have the time, I really encourage you to read his article in full. Again, I’m no mental health expert, but I think people dealing with depression find comfort in knowing that they’re not a lone, and that lots of people deal with depression.  And if you’ve come this far and are still wondering, yes, today’s post was really just a ploy to remind Adam that I’m better than him at trivia.

So today, maybe leave a nice note for Adam in the comments or on his twitter feed.  Or maybe you have some knowledge to share on mental health and depression. I trust you guys to help each other out.


{ 11 comments }

Yesterday, I looked at the players with the worst career winning percentages. Using that same methodology, let’s look at the players with the best winning percentages. And the Otto Graham Browns and Tom Brady Patriots tend to dominate the list.

Below is the list of the top 100 players in adjusted career winning percentage, with a minimum of 100 career games played. [continue reading…]

{ 3 comments }

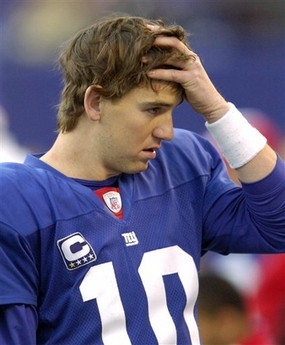
Eli thinks the Giants schedule is fraudulent.

The Chiefs have a very friendly schedule this year when it comes to rest. Kansas City doesn’t have a single game this year when it played a game more recently than its opponent. The only other team that received that scheduling break is the Rams.

On the other hand, you have the Giants. New York has four games against opponents with extra rest, including three where the opponent is coming off of a bye. Denver has a bye in week 5, and plays the Giants at home in week 6; Seattle has a bye in week 6, then travels to New York in week 7; Kansas City has a bye in week 10, then travels to MetLife to face the Giants in week 11. The Giants have a fourth game against an opponent coming off of a bye — against the Rams in week 9 — but both New York and Los Angeles have a bye in week 8. Finally, the Cowboys play on Thanksgiving in week 12 and on TNF in week 13 before facing the Giants on the road in week 14; that gives Dallas 10 days of rest before that December matchup, compared to 7 for the Giants.

So the Giants got a raw deal there: the 49ers (Arizona week 9, Dallas week 7, Washington week 6) and Lions (NO week 6, Cle week 9, GB week 8) are the only other teams to face three opponents coming off an extra week’s rest. Washington has a week 5 bye and hosts San Francisco in week 6, Dallas has a week 6 bye and travels to San Francisco in week 7, and Arizona has a week 8 bye before going to San Francisco in week 9. Detroit travels to New Orleans in week 6 after the Saints week 5 bye, heads on the road to face the Packers in week 9 after Green Bay’s week 8 bye, and hosts the Browns in week 10 after Cleveland’s week 9 bye.

Okay, so the Chiefs and Rams get a break when it comes to their opponents’ rest days, and the Giants, Lions, and 49ers are victims of poor scheduling. What about the other side — i.e., each team’s own rest? Well, Kansas City is the big winner here, too.

Because the Chiefs have two Thursday night games — the kickoff game and week 7 in Oakland — Kansas City has 10 days of rest before its game in weeks 2 and 11 days of rest before its Monday Night game in week 8, giving the Chiefs three more days of rest than the Eagles and Broncos, respectively. And since the Chiefs face the Giants after Kansas City’s bye, that’s a third game with extra rest.

Meanwhile, a few teams — including the Giants — are in worse shape. Because New York plays the previously idle Rams after the Giants own bye, New York doesn’t have any games with a long rest advantage. The Giants only rest advantage comes when — after playing on Thanksgiving in week 12 — New York has three extra days in advance of a trip to Oakland. [continue reading…]

{ 6 comments }

Trivia of the Day – Saturday, April 15

Texas A&M defensive end Myles Garrett is likely going to be the first overall pick in the draft, especially after his dominant performance at the NFL Combine.  He would be the second front seven player from the SEC to go number one in three years, after Jadeveon Clowney was the first overall pick in 2014.

But only one other front seven player from the SEC has gone first overall.  Can you name him?

Trivia hint 1 Show


Trivia hint 2 Show


Trivia hint 3 Show


Click 'Show' for the Answer Show

{ 4 comments }

The Chargers franchise started in Los Angeles in 1960, before moving to San Diego in 1961.  The team spent 56 years in San Diego before deciding to move to Los Angeles yesterday. That’s the longest amount of time any professional football team has spent in one city before relocating.

The Cleveland Browns existed for 50 years, from 1946 to 1995, before Art Modell moved the franchise to Baltimore. Cleveland was given an expansion team three years later, and the new Browns entered the league in 1999.

The Rams also began in Cleveland, playing there from 1937 to 1945.  The team moved west to Los Angeles in 1946, and remained in the greater Los Angeles area [1]The team played in Anaheim from 1980 to 1994. until 1994, when the franchise moved to St. Louis.  That means the Rams existed in LA for 49 seasons before moving to the midwest.  Of course, after 21 seasons in St. Louis, the Rams returned home last season.

The Cardinals were one of the NFL’s original franchises, playing in Chicago from 1920 through 1959.  Then, after 40 seasons in Chicago, the Cardinals moved to St. Louis in 1960.  The team stayed there for 28 years, before moving to Arizona in 1988.

The Houston Oilers were one of the AFL’s initial franchises in 1960, but Bud Adams took the franchise east to Tennessee in 1997.  So after 37 years in Houston, the Oilers moved, but the city received the expansion Texans a few years later.

The only other team to move after 25 years in one city was the Colts, of course.  The franchise began in complicated fashion: the franchise was awarded to Carroll Rosenbloom in 1953, although it really was a legacy of the ’52 Dallas Texans.  The Colts stayed in Baltimore for 31 years, before Robert Irsay – who had traded for the Colts in 1972 – moved the team to Indianapolis after the 1983 season.

What do you think of the Chargers moving to LA?

References

References
1 The team played in Anaheim from 1980 to 1994.
{ 15 comments }

2016 AP All-Pro Teams Announced

On Friday, the AP announced the 2016 All-Pro teams. One confusing change this year: the removal of the fullback and the second running back spot (there used to be 12 first-team All-Pros on offense), and the substitution of a “Flex” spot that seems to go to… anyone? David Johnson finished second in running back voting, but first in Flex voting, whatever that means.  And while 12 1APs may not make sense, there are still 12 on defense, which makes it pretty odd.   There’s also now a defensive back category in addition to CB and S, which… again, I don’t quite get.  But there are 2 first team edge rushers, 2 interior defenders, 3 linebackers, 2 cornerbacks, 2 safeties, and one defensive back.

Quarterback

Matt Ryan, Atlanta, 29; Tom Brady, New England, 15; Aaron Rodgers, Green Bay, 5; Derek Carr, Oakland, 1.

Running Backs

Ezekiel Elliott, Dallas, 47; David Johnson, Arizona, 3.

Wide Receivers

Antonio Brown, Pittsburgh, 43; Julio Jones, Atlanta, 30; Odell Beckham Jr., New York Giants, 16; Mike Evans, Tampa Bay, 6; Jordy Nelson, Green Bay 5.

Tight End

Travis Kelce, Kansas City, 44; Greg Olsen, Carolina, 5; Rob Gronkowski, New England, 1.

Flex

David Johnson, Arizona, 24; Le’Veon Bell, Pittsburgh, 18; Odell Beckham, New York Giants, 3; Antonio Brown, Pittsburgh, 1; Larry Fitzgerald, Arizona, 1; LeSean McCoy, Buffalo, 1; Jarvis Landry, Miami, 1; Travis Kelce, Kansas City, 1.

Left Tackle

Tyron Smith, Dallas, 27; David Bakhtiari, Green Bay, 8; Joe Thomas, Cleveland, 7; Trent Williams, Washington, 3; Jason Peters, Philadelphia, 2; Taylor Lewan, Tennessee, 1; Donald Penn, Oakland, 1; Andrew Whitworth, Cincinnati, 1.

Right Tackle

Jack Conklin, Tennessee, 27 1-2; Mitchell Schwartz, Kansas City, 6; Marcus Cannon, New England, 6; Bryan Bulaga, Green Bay, 5 1-2; Zach Strief, New Orleans, 2; Ryan Schraeder, Atlanta, 2; Marcus Gilbert, Pittsburgh, 1;

Left Guards

Kelechi Osemele, Oakland, 47; Marshal Yanda, Baltimore, 2; James Carpenter, New York Jets, 1. Right Guard

Zack Martin, Dallas, 40; David DeCastro, Pittsburgh, 5; Marshal Yanda, Baltimore, 4; Kevin Zeitler, Cincinnati, 1.

Center

Travis Frederick, Dallas, 29; Alex Mack, Atlanta, 14; Rodney Hudson, Oakland, 5; Maurkice Pouncey, Pittsburgh, 1, Brandon Linder, Jacksonville, 1.

Defensive Players

Edge Rushers

Khalil Mack, Oakland, 46; Vic Beasley Jr., Atlanta, 30; Cameron Wake, Miami, 3; Olivier Vernon, Miami, 3; Jadeveon Clowney, Houston,m 3; Brandon Graham, Philadelphia, 3; Michael Bennett, Seattle, 2; Cameron Jordan, New Orleans, 2; Danielle Hunter, Minnesota, 2; Cliff Avril, Seattle, 2; Everon Griffen, Minnesota, 1; Joey Bosa, San Diego, 1.

Interior Linemen

Aaron Donald, St. Louis, 47; Damon Harrison, New York Giants 16; Ndamukong Suh, Miami, 12; Calais Campbell, Arizona, 7; Gerald McCoy, Tampa Bay, 7; Fletcher Cox, Philadelphia, 6; Geno Atkins, Cincinnati, 5.

Linebackers

Bobby Wagner, Seattle, 48; Von Miller, Denver, 47; Sean Lee, Dallas, 41; Lorenzo Alexander, Buffalo, 4; Luke Kuechly, Carolina, 2; C.J. Mosley, Baltimore, 1; Zach Brown, Buffalo, 1; Zachary Orr, Baltimore, 1; Alec Ogletree, Los Angeles, 1; Dont’a Hightower, New England, 1; Bernardick McKinney, Houston, 1; Lavonte David, Tampa Bay, 1; Whitney Mercilus, Houston, 1.

Cornerbacks

Aqib Talib, Denver, 27; Marcus Peters, Kansas City, 23; Janoris Jenkins, New York Giants, 17; Malcolm Butler, New England, 8; Casey Hayward, San Diego, 8; Richard Sherman, Seattle, 7; Xavier Rhodes, Minnesota, 5; Chris Harris, Jr., Denver, 4; Dominique Rodgers-Cromartie, New York Giants, 1.

Safeties

Landon Collins, New York Giants, 47; Eric Berry, Kansas City, 31; Devin McCourty, New England, 4; Ha Ha Clinton-Dix, Green Bay, 4; Earl Thomas, Seattle, 3; Harrison Smith, Minnesota, 3; Reggie Nelson, Cincinnati, 2; Kam Chancellor, Seattle, 2; Malcolm Jenkins, Philadelphia, 1; Eric Weddle, Baltimore, 1; Quintin Demps, Houston, 1; Darian Stewart, Denver, 1.

Defensive Back

Chris Harris, Jr., Denver, 14; Dominique Rodgers-Cromartie New York Giants, 6; Malcolm Butler, New England, 5; Eric Berry, Kansas City 3; Casey Hayward, San Diego, 3; Malcolm Jenkins, Philadelphia, 3; Patrick Peterson, Arizona, 2; Marcus Peters, Kansas City, 2; Xavier Rhodes, Minnesota, 2; Ha Ha Clinton-Dix, Green Bay, 2; Janoris Jenkins, New York Giants, 2; Aqib Talib, Denver, 1; Darius Slay, Detroit, 1; Devin McCourty,, New England, 1; Brent Grimes, Tampa Bay, 1; Richard Sherman, Seattle, 1; Eric Weddle, San Diego, 1.

Special Teams

Placekicker

Justin Tucker, Baltimore, 50.

Punter

Johnny Hekker, Los Angeles, 42; Marquette King, Oakland, 4; Pat McAfee, Indianapolis, 2; Brad Wing, New York Giants, 1; Sam Martin, Detroit, 1.

Kick Returner

Cordarrelle Patterson, Minnesota, 41; Tyler Lockett, Seattle, 5; Tyreek Hill, Kansas City, 5.

Punt Returner

Tyreek Hill, Kansas City, 50.

Special Teamer

Matt Slater, New England, 14; Nate Ebner, New England, 12; Dwayne Harris, New York Giants, 6; Justin Bethel, Arizona, 3; James Develin, New England, 3; Michael Thomas, Miami, 3; Chase Reynolds, Los Angeles, 3; Eric Murray, Kansas City, 2; Chris Maragos, Philadelphia, 1; Eric Weems, Atlanta, 1; Josh Bellamy, Chicago, 1.

{ 14 comments }
Next Posts Previous Posts