
Kaepernick … tuning out the critics?
Do you know what category the 49ers led the NFL in last year? Punts, with an even 100. Because even with an above-average running attack (in part because of Kaepernick), the 49ers passing game was really bad. As discussed yesterday, Kaepernick ranked 29th out of 30 qualifying passers in NY/A, and San Francisco as a team ranked 29th in net yards per pass attempt.
Yesterday, I posted a list of the 11 players who, like Kaepernick, had really good TD/INT ratios and really low NY/A averages. Here it is again, with the NY/A column showing players who ranked in the top 6 in that category when you sort in ascending order (i.e., from lowest average to highest):
| year_id | Team | Quarterback | TD/INT Rk | NY/A Rk (Asc.) |
|---|---|---|---|---|
| 2016 | SFO | Colin Kaepernick | 6 | 2 |
| 2015 | GNB | Aaron Rodgers | 3 | 4 |
| 2008 | WAS | Jason Campbell | 5 | 4 |
| 2002 | PHI | Donovan McNabb | 3 | 6 |
| 1992 | PHI | Randall Cunningham | 3 | 5 |
| 1989 | ATL | Chris Miller | 6 | 5 |
| 1988 | NYJ | Ken O'Brien | 2 | 2 |
| 1987 | PHI | Randall Cunningham | 6 | 3 |
| 1985 | STL | Neil Lomax | 6 | 5 |
| 1977 | WAS | Billy Kilmer | 6 | 4 |
| 1971 | NOR | Ed Hargett | 6 | 5 |
Unsurprisingly, that list is filled with players who took a lot of sacks. Passers who are overly cautious against throwing interceptions can wind up taking a lot of sacks as part of an overall risk-averse game plan. We saw this with Campbell in 2008, when he led the NFL in interception rate but had the third-lowest yards per completion average in the league. Brian Burke wrote about this at the time, with the key takeaway being that the optimal number of interceptions for an offense isn’t necessarily zero.
But there’s another thing to note about that list: 5 of the 11 quarterbacks on the list were minorities, which feels unlikely to be a coincidence in a league where a very small percentage of the quarterback seasons since 1970 were had by non-white passers. Now, what does race have to do with interceptions? I don’t think it’s controversial to say that Kaepernick’s play last year was placed under a microscope, albeit one brought upon by Kaepernick’s own actions. Could his decision to become an outspoken political figure have impacted his play?
When I noticed that 5 of the 11 quarterbacks on the list were minorities, my mind immediately went to a fascinating article that Jason Lisk wrote about race and interceptions over six ago:
Still, one of the things I have observed is that black quarterbacks, as a group, have tended to be better at avoiding interceptions than their white counterparts. …
Interceptions are highly random, subject to game situation, dependent on deflections, tips, the receiver running the correct route, the defender making a good play and not dropping the ball. They can also be somewhat controlled by the quarterback’s behavior. If you try to fit the ball into tight windows, your chances for both a good play and a bad one increase. There is also no other quarterback action that gets criticized as “stupid” or “dumb” like an interception thrown. I can see how black quarterbacks feel they need to be more cautious when it comes to interceptions, to avoid that criticism. I suspect that the difference in interception numbers is a real effect driven by this external pressure.
So, I think that race matters, because the numbers – as well as direct statements from McNabb and Doug Williams as quoted in Hill’s piece – tell me it matters in affecting how the black quarterbacks play the game as far as avoiding interceptions.
Colin Kaepernick threw 4 interceptions last year. Three were thrown in the first half, and the lone one in the second half came on the first play of the second half. And that interception bounced off of the hands of Torrey Smith — no, really. Believe it or not, this pass resulted in an interception:
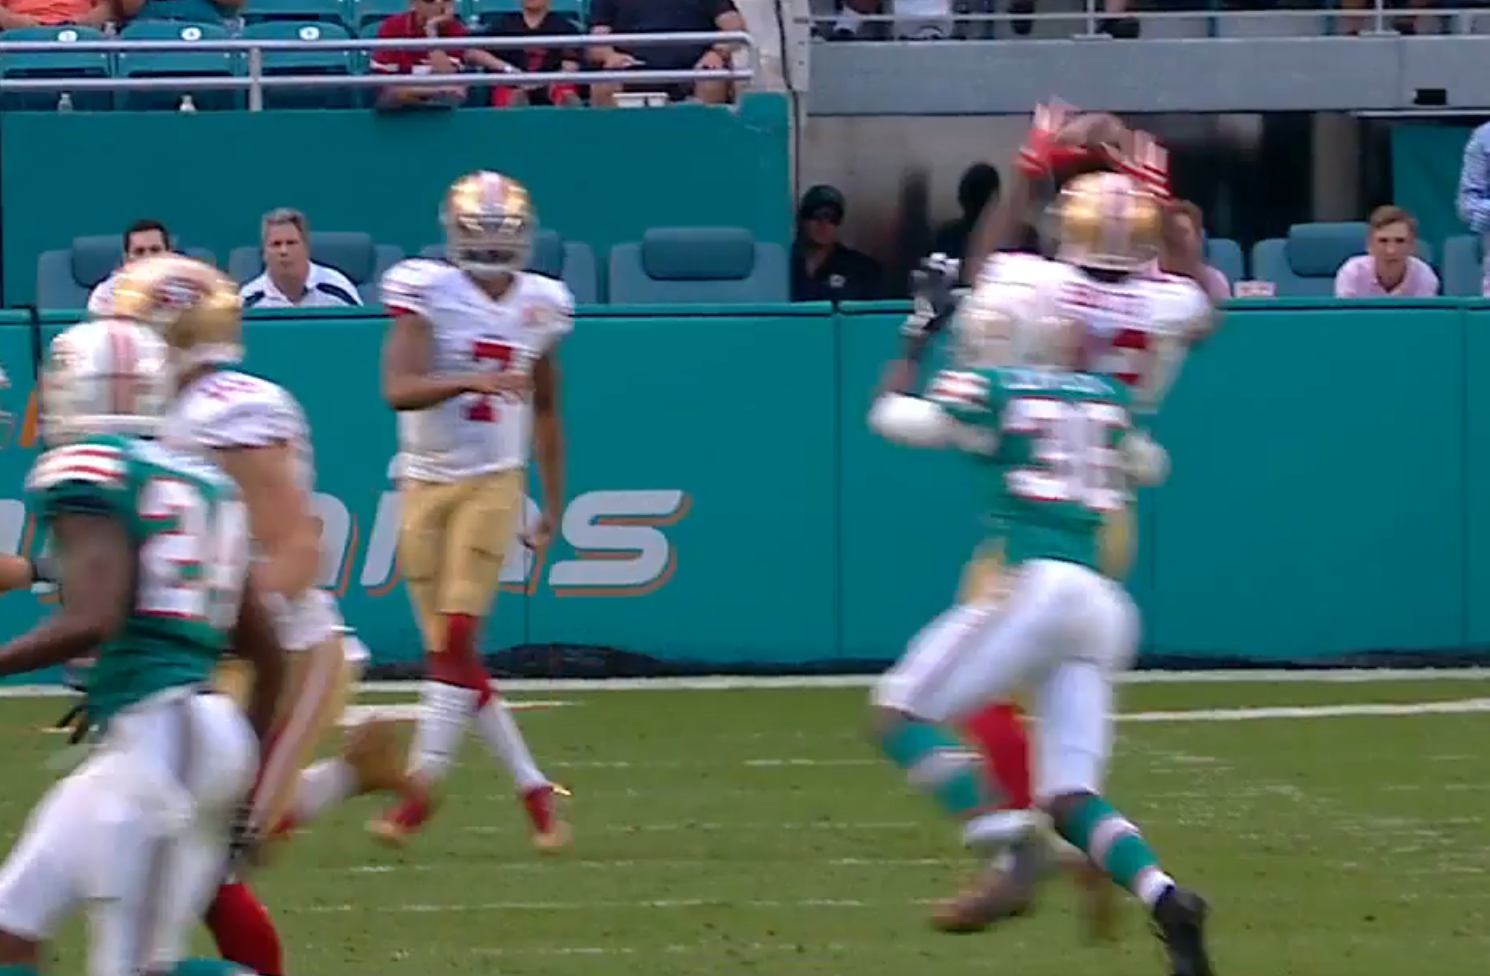
Take a step back and consider how strange this is. We know that quarterbacks tend to throw more interceptions when losing in the second half, and Kaepernick threw just one in that situation — and that one came on the first play of the second half and wasn’t even his fault! Trailing in the second half, quarterbacks tend to (and should) be more risk-seeking, and there’s evidence that some quarterbacks play it too safe in these situations. But Kaepernick played in an extremely conservative manner in these situations.
There were 20 quarterbacks who threw at least 150 passes while trailing in the second half in 2016. Of those 20, Kaepernick had the worst sack rate, checking in at a whopping 10%, double that of the other 20 passers. Kaepernick also had the 3rd best interception rate, and by the spirit of what we’re trying to measure [1]If I wanted to play with the numbers, I could have just looked at passes thrown in the final 29 minutes of the game!, he didn’t throw a single interception. But most severe was his net yards per attempt average: it was down at 4.21, nearly one NY/A behind the rest of the 20 passers:
| Player | Cmp | Att | Cmp% | Yds | TD | Int | Sk | Yds | 1D | Rate | Sk Rate | NY/A | INT Rate |
|---|---|---|---|---|---|---|---|---|---|---|---|---|---|
| Kirk Cousins | 152 | 214 | 71 | 1832 | 13 | 5 | 7 | -61 | 82 | 107.5 | 3.2% | 8.01 | 2.3% |
| Andrew Luck | 121 | 180 | 67.2 | 1512 | 15 | 2 | 11 | -65 | 75 | 116.3 | 5.8% | 7.58 | 1.1% |
| Drew Brees | 154 | 225 | 68.4 | 1671 | 12 | 8 | 5 | -36 | 97 | 93 | 2.2% | 7.11 | 3.6% |
| Derek Carr | 87 | 155 | 56.1 | 1089 | 13 | 0 | 2 | -7 | 57 | 106.1 | 1.3% | 6.89 | 0% |
| Matthew Stafford | 109 | 168 | 64.9 | 1324 | 6 | 4 | 12 | -86 | 62 | 91 | 6.7% | 6.88 | 2.4% |
| Russell Wilson | 103 | 158 | 65.2 | 1137 | 6 | 4 | 8 | -50 | 55 | 88.5 | 4.8% | 6.55 | 2.5% |
| Jameis Winston | 100 | 176 | 56.8 | 1279 | 10 | 5 | 10 | -71 | 65 | 86.8 | 5.4% | 6.49 | 2.8% |
| Philip Rivers | 100 | 188 | 53.2 | 1345 | 10 | 10 | 11 | -58 | 66 | 71.8 | 5.5% | 6.47 | 5.3% |
| Eli Manning | 105 | 175 | 60 | 1199 | 9 | 6 | 7 | -42 | 54 | 83.5 | 3.8% | 6.36 | 3.4% |
| Trevor Siemian | 101 | 164 | 61.6 | 1167 | 8 | 3 | 12 | -78 | 53 | 91.7 | 6.8% | 6.19 | 1.8% |
| Andy Dalton | 115 | 184 | 62.5 | 1319 | 7 | 3 | 16 | -92 | 66 | 89.9 | 8% | 6.14 | 1.6% |
| Marcus Mariota | 90 | 157 | 57.3 | 1033 | 6 | 4 | 7 | -45 | 53 | 79.4 | 4.3% | 6.02 | 2.5% |
| Blake Bortles | 163 | 279 | 58.4 | 1790 | 14 | 5 | 14 | -86 | 99 | 86.8 | 4.8% | 5.82 | 1.8% |
| Joe Flacco | 126 | 196 | 64.3 | 1186 | 7 | 5 | 6 | -42 | 56 | 82.1 | 3% | 5.66 | 2.6% |
| Brock Osweiler | 109 | 181 | 60.2 | 1099 | 7 | 4 | 8 | -65 | 60 | 81.3 | 4.2% | 5.47 | 2.2% |
| Carson Wentz | 129 | 212 | 60.8 | 1275 | 4 | 6 | 10 | -61 | 63 | 72.3 | 4.5% | 5.47 | 2.8% |
| Carson Palmer | 111 | 176 | 63.1 | 1142 | 10 | 7 | 14 | -112 | 69 | 84 | 7.4% | 5.42 | 4% |
| Sam Bradford | 145 | 192 | 75.5 | 1260 | 7 | 1 | 18 | -143 | 77 | 102.3 | 8.6% | 5.32 | 0.5% |
| Ryan Fitzpatrick | 86 | 164 | 52.4 | 937 | 4 | 14 | 9 | -46 | 42 | 42.1 | 5.2% | 5.15 | 8.5% |
| Colin Kaepernick | 84 | 171 | 49.1 | 907 | 5 | 1 | 19 | -107 | 44 | 72.4 | 10% | 4.21 | 0.6% |
| Average | 114.5 | 185.75 | 61.4 | 1275.15 | 8.65 | 4.85 | 10.3 | -67.65 | 64.75 | 86.44 | 5.3% | 6.16 | 2.6% |
I can’t get inside the mind of Kaepernick any more than you can. But here’s what I do know: external forces incentived him to avoid throwing passes that would give his critics easy ammunition to criticize Kaepernick’s intelligence. And while we don’t know if Kaepernick responded to those incentives, what we can say is that his stats reflect the most likely outcome if he was significantly influenced by those incentives.
For reference, here’s Kaepernick’s second-half passing numbers when trailing in 2012, 2013, 2014, 2015, and 2016, along with his total numbers from 2012-2015:
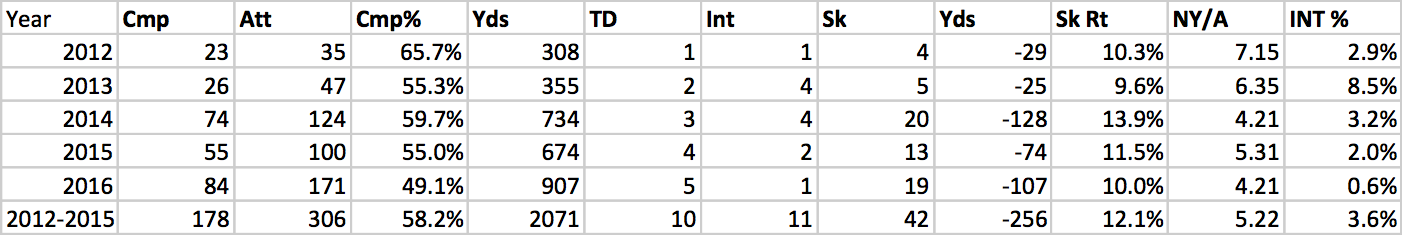
Kaepernick’s sack rate was actually even worse in those situations, and he’s always had a high sack rate in all situations (part of the problem is many running quarterbacks take sacks at high rates, although the data can be a bit misleading here, too.) [2]For example, if a quarterback scrambles and gains a few yards, that does not lower his sack rate because that play goes down as a rush attempt and not a pass attempt. But if he scrambles and get … Continue reading However, his interception rate was higher, and his average passing gain was higher, reflecting a more aggressive approach. The sample sizes here are tiny, and we know that splits happen: at the end of the day, I don’t think we can draw any definitive conclusions.
What does that mean for 2017? Well, that’s up to the reader to decide. Maybe his 2016 performance when trailing in the second half of games wasn’t indicative of anything, and had the sample size been larger, perhaps this article never would have been written. Or maybe there was something to those numbers, and Kaepernick is going to continue to utilize a risk-averse style, and that could wind up either being good or bad (although I’d lean towards it being bad) for him and his teams. Maybe with the spotlight less on him (assuming that is possible), he’ll revert back to a more risk-seeking quarterback when the situation calls for it.
What do you think?
References
| ↑1 | If I wanted to play with the numbers, I could have just looked at passes thrown in the final 29 minutes of the game! |
|---|---|
| ↑2 | For example, if a quarterback scrambles and gains a few yards, that does not lower his sack rate because that play goes down as a rush attempt and not a pass attempt. But if he scrambles and get sacks, it does hurt his sack rate. |