≡ Menu

Yards per Carry: RB1 vs. RB2

Regular readers know that I’m not a huge fan of yards per carry as a metric to evaluate running backs, or even rushing attacks. Given the limited numbers of metrics available, sometimes it is a useful measure, but we also much caution ourselves against relying on it too often. Today’s post is another example of that.

I looked at all rushing attacks since 2002, and calculated the yards per carry gained by each team’s top running back and second running back (excluding pure fullbacks and situations where the second running back had fewer than 50 carries), as measured by carries. If yards per carry was the best way to evaluate running backs, and coaches wanted to play their best players most frequently (and, of course, coaches were able to identify their best players), then RB1s should be better at RB2s at yards per carry.

Last year, Bears rookie Jordan Howard averaged 5.2 yards per carry on 252 carries, while backup Jeremy Langford (who actually opened the season as the starter) gained just 3.2 yards per carry on 62 carries.  That’s a piece of evidence that YPC is useful: Howard was much better than Langford at YPC, and he gained way more carries.  But that +2.0 discrepancy was the largest in football last year: this is an outlier, not a typical example.

How about an outlier in the other direction? The Jets top running back last year was Matt Forte, who started 13 games and handled 218 carries; he averaged 3.7 yards per rush. Meanwhile, backup Bilal Powell averaged 5.5 yards per carry on 131 carries.  This might mean that Powell is better than Forte, but at least last year, the Jets didn’t seem to think so — or maybe thought so too late.

These are two interesting examples because they show some of the drawbacks to actually trying to properly analyze the issue.  Howard was the backup, but because he was so much better than Langford, he gets graded as Chicago’s top running back.  This biases the study in favor of RB1s: if a running back is producing at a high rate, even if he’s the backup, he may wind up leading his team in rushes that year (thanks to earning more carries in the second half of the season), which means RB1s in generally will appear to have higher yards per carry than RB2s.  In that way, it becomes a self-fulfilling prophecy.

On the other hand, look at the Jets example.  I think we would all agree that Powell was the Jets best running back last season. He actually finished with more yards from scrimmage than Forte (thanks to playing in two more games), and nearly outrushed him, too. Forte was the (moderately) high priced veteran free agent signing, while Powell was intended to be the backup. By the end of the year, it was clear Powell was the Jets best running back (if not best player), but he didn’t have enough carries to overtake Forte for RB1 status. So in some ways, this study may not properly identify a team’s true top running back and backup running back, if we only classify those players by carries.

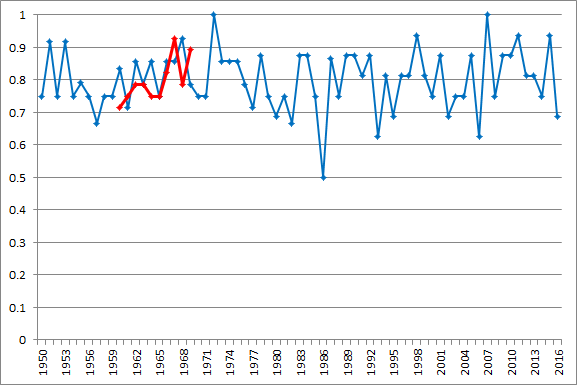
So there is some issues with this on a case-by-case basis.  That’s why the best thing to do is to aggregate the data.  The graph below shows the average yards per rush gained by the average team’s RB1 and average team’s RB2 in each year since 2002: [continue reading…]

{ 15 comments }

Best Non-Record Breaking Seasons: Passing

On twitter, I’ve been doing some fun screenshots of player stats where you need to guess the player based only on all — or just some — of his stats. You can follow with the hashtag PFRScreenShots.

I thought this was a fun one:

Okay, you may say how the heck could I know that? Well, You have more than enough info there! The number 5235 can only be a reference to one thing in season stats: passing yards. And it’s not in bold, which means its not a league leader. So the real question is can you recall a player who threw for 5,235 passing yards but didn’t lead the league in passing?

Which got me to wondering: which passers had the most impressive raw statistics while not leading their league in that category? [continue reading…]

{ 8 comments }

Over the last four days, I wrote about the one great team that didn’t win it all on the six greatest dynasties in the NFL since World War II:

And while these dynasties never played each other, of course, there was some overlap among the quarterbacks.

Starr vs. Bradshaw

Otto Graham played from 1946 to 1955, while Bart Starr didn’t enter the NFL until 1956.  But Starr had a long career, sticking around in Green Bay through 1971.  And on December 6th, 1970, a very special game in NFL history took place: the only meeting with Starr and Terry Bradshaw.  Even if it wasn’t quite Brady/Manning.

In 1970, Bradshaw was the first pick in the draft, and as a rookie, he was terrible, finishing 3.30 ANY/A below average. Starr was washed up by 1970: he ranked 21st out of 25 qualifying passers in ANY/A. [continue reading…]

{ 6 comments }

Missing Links In The Dynasty Chain, Part IV

On Tuesday, we looked at three of the best teams on three of the greatest dynasties in football history: the ’53 Browns, the ’87 49ers, and the ’07 Patriots. Wednesday, the focus shifted to Lombardi’s ’64 Packers, while yesterday we looked at the ’76 Steelers. Today, we complete the series with some notes on the ’94 Cowboys, and how Dallas not only nearly became the first team to win three Super Bowls in a row, but the first team to win four.

Switzer wasn’t able to sustain Johnson’s success

Dallas won the Super Bowl after the ’92, ’93, and ’95 seasons, and lost in the NFC Championship Game against the ’49ers after the ’94 season. Given that the Super Bowl would have been against the Chargers, there’s little doubt that the Cowboys would have been Super Bowl champs had they defeated San Francisco. Back then, the NFC Championship Game — which was between the 49ers and Cowboys three straight years — was the Super Bowl. So was the ’94 version of the Cowboys worse than the other three teams? Let’s look at the rosters. [continue reading…]

{ 43 comments }

Missing Links In The Dynasty Chain, Part III

On Tuesday, we looked at three of the best teams on three of the greatest dynasties in football history: the ’53 Browns, the ’87 49ers, and the ’07 Patriots. Yesterday, the focus was on the ’64 Packers, a talent-rich team sandwiched around repeat champions from ’61-’62 and ’65-’67. All four teams were dynasties with Hall of Fame coaches and quarterbacks, and that trend continues today with a look at the ’70s Steelers, and the historic combination  Chuck Noll and Terry Bradshaw.

And as with the Packers, we will look at a Steelers team that didn’t win the Super Bowl but was in the middle of the team’s dynastic run.You know that Pittsburgh won four Super Bowl titles in six years, but less understood is how the team evolved over that period.

Four of the Steelers Hall of Famers were drafted in 1974, the year of the team’s first championship. Jack Lambert, John Stallworth, Lynn Swann, and Mike Webster were all green 22 years olds that season, and only Lambert was a major contributor as a rookie; Stallworth, Swann, and Webster combined to start just six other games.

Noll and Bradshaw didn’t always see eye to eye, but they usually won.

A fifth Hall of Famer, QB Terry Bradshaw, was drafted in 1970, but he was far from Terry Bradshaw even five years into his career.  The ’74 Steelers featured one of the worst passing attacks to ever win the Super Bowl, and Bradshaw’s passing numbers were below average in each of the first five seasons of his career.  In fact, it was Joe Gilliam who won the training camp battle for the starting job; Bradshaw didn’t even start the first six games of the 1974 season.  Four years later, he was the AP MVP.

What about the rest of those famous Steelers? RB Franco Harris was drafted in 1972; he was an immediate star, and made his third straight Pro Bowl in ’74.  LB Jack Ham was drafted a year earlier, and he made the first of six straight AP 1st-team All-Pro teams in ’74 (and the second of eight straight Pro Bowls).

In 1970, Pittsburgh drafted not just Bradshaw, but Mel Blount. The famed cornerback was a full-time starter his first five seasons, but he didn’t make his first Pro Bowl or earn any All-Pro recognition until 1975, when he led the league with 11 interceptions.  And in 1969, the Steelers drafted DT Joe Greene and the best Steeler with four rings not in the Hall of Fame, DE L.C. Greenwood.  Both were in their prime by ’74.

So while the ’74 Steelers had the names, only half of them had actually developed into stars by 1974. Stallworth, Swann, Webster were reserves, Bradshaw had been benched and underperformed, and Blount had yet to break out. The ’74 team went 10-3-1 and had an SRS of +6.8; the ’75 version was much, much better: that team went 12-2 and had an SRS of +14.2, and rested starters and lost the final game of the regular season. And the ’76 version? Well, after a very rough start, it finished with an SRS of +15.3, the best in Pittsburgh history.

So when it comes to missing rings, the obvious starting place to look is the ’76 Steelers. The ’73 Steelers were far too young, while the ’80 Steelers were over the hill; the only other choice would be the ’77 squad, but that one was doomed before the season even started, with the team chemistry hindered by lawsuits and holdouts. No, the Steelers team that should have won it all — but didn’t — was perhaps the best Pittsburgh team in franchise history. [continue reading…]

{ 20 comments }

Missing Links In The Dynasty Chain, Part II

Yesterday, we looked at the three of the best dynasties in NFL history, and one of the very best teams on each of those dynasties that somehow fell short of winning it all. For the ’07 Patriots and ’87 49ers, shocking playoff losses as double-digit favorites were the the result of ferocious pass rush engineered by the Giants and Vikings, respectively. For the ’87 49ers and ’53 Browns, these losses were followed by back-to-back championships, signs of the talent-laden rosters these teams possessed. And for the ’53 and ’07 Patriots, all-time great seasons by all-time great quarterbacks ended with bitter disappointment.

Today? A look at yet another dynastic team that had all the talent in the world, sandwiched between its inexperienced championship teams of yesteryear and its aging veteran championship rosters of tomorrow.

1964 Packers

Even these two couldn’t save the 1964 Packers.

Yesterday, we talked Brady/Belichick, Montana/Walsh, and Graham/Brown. Today we focus on one of the only other coach and quarterback combinations that can compare to those three. The Packers won their first title in the Vince Lombardi / Bart Starr era in 1961. The 1962 Packers may have been the greatest team in NFL history. In 1963, the Packers again led the NFL in the Simple Rating System, and ranked in the top 2 in points and points allowed. The problem for Green Bay? The Chicago Bears had one of the greatest defenses in NFL history: the Bears led the NFL in points allowed, yards allowed, turnovers forced, net yards per attempt allowed, passing yards allowed, rushing yards allowed, and yards per carry allowed. Green Bay finished 11-2-1, with both losses coming to Chicago (including one game that Bart Starr missed).  And, of course, in 1965, 1966, and 1967, the Packers three-peated as NFL champions.  By ’68, Lombardi was gone, and the Packers Hall of Famers were largely retired or past their prime.

So what rings did the Packers miss? There are only three years from which to choose: ’60, ’63, and ’64.  In 1960, Green Bay made it to the title game, but that team was the baby Packers. There were 13 all-time great players to play for the ’60s Packers, and 12 of those made it to the Hall of Fame. Here is how old each player was in ’60, ’63, and ’64. [continue reading…]

{ 9 comments }

Missing Links In The Dynasty Chain, Part I

A decade ago, NFL Networking aired a series called America’s Game: The Missing Rings, looking at five great NFL teams that failed to win a Super Bowl. These were the Minnesota Vikings from 1969 and 1998, the 1981 Chargers, the 1988 Bengals, and the 1990 Bills. None of those franchises have ever won a Super Bowl, but those five teams all came very close to winning or at least making a Super Bowl.

But what about the 6 great pro football dynasties since World War II? The ’50s Browns, ’60s Packers, ’70s Steelers, ’80s 49ers, ’90s Cowboys, and modern Patriots all had (at least) one great team that failed to win it all, too. We don’t spend a lot of time thinking about the great Brady/Belichick, Graham/Brown, and Montana/Walsh teams that didn’t win it all. But in some cases, those were the very best teams they ever fielded.

2007 Patriots

You know the story. New England became the first and only team to ever go 16-0, and the first and only team to ever outscore its opponents by 300 points. QB Tom Brady was the NFL MVP, and WR Randy Moss, LT Matt Light, LB Mike Vrabel and CB Asante Samuel were all 1st-team All-Pros. WR Wes Welker led the NFL in receptions, and G Logan Mankins, C Dan Koppen, and NT Vince Wilfork all made the Pro Bowl (and the defense also had veteran stars in LB Junior Seau, DE Richard Seymour, and S Rodney Harrison). The year before, without Moss and Welker, the Patriots nearly won the Super Bowl: New England lost in the AFC Championship Game to the Colts, a game the Patriots led 21-3 early on. [continue reading…]

{ 26 comments }

The 1987 MVP Award: Rice, Montana, and Elway

Two of the most valuable players from 1987.

In 1987, the Associated Press voters were faced with a difficult choice. This was a year disrupted by the players’ strike, which led to a 15-game season that included three games featuring replacement players. Jerry Rice was the rare unanimous first-team All-Pro selection at wide receiver, courtesy of a record-breaking 22 touchdown receptions in 12 games.  How remarkable was that? Eagles receiver Mike Quick was second in the league in receiving touchdowns with *11*, and no other player had more than 8!  And for good measure, Rice scored a 23rd touchdown on a rush against the Falcons.

And it’s not as though all Rice did was catch touchdowns. Cardinals wide receiver J.T. Smith crossed the picket line and played in all 15 games; he wound up leading the league in receiving yards, but Rice led the NFL in receiving yards per game for the second straight season.  A remarkable year from the greatest receiver in NFL history is certainly worthy of MVP honors.

The biggest threat to Rice capturing the MVP award appeared to be his own quarterback, Joe Montana.  The 49ers lost on opening day in Pittsburgh, but the 49ers went 10-0 in Montana’s remaining starts.  In part, this is because this was a dominant San Francisco team on both sides of the ball, but Montana led the NFL in completion percentage, touchdowns, touchdown rate, and passer rating.  He also ranked 2nd in ANY/A, behind Cleveland’s Bernie Kosar (the Browns went 8-4 in his starts, and Kosar received minimal MVP attention). Montana had three 4th quarter comebacks and three game-winning drives, while Kosar had none.  And in a head-to-head game on Sunday Night Football, Montana outclassed Kosar. And Montana was Montana, so it’s no surprise that peak Montana on a 10-game winning streak was considered the best quarterback in the NFL. [continue reading…]

{ 17 comments }

Kirk Cousins was a good quarterback in 2015, and a very good one in 2016. He will probably be a very good quarterback for the Redskins again in 2017, and then will likely switch teams after the 2017 season. He will turn 29 this August, which means he would be 29 years old in the year before switching teams, and turn 30 in preseason next year with (presumably) a new team. That’s because the Redskins and Cousins can’t seem to come to terms on a long-term deal, and with Washington unlikely to tag Cousins again after the season, he will be free to move to another team.  And that will make him the extraordinarily rare case of a quarterback in his prime years hitting the open market.

Using my era-adjusted passer ratings, looked at all quarterbacks who had an above-average rating during a season in his twenties and then switched teams in the off-season. The two with the highest era-adjusted passer ratings before switching teams? Drew Brees with San Diego in 2005 and Neil O’Donnell with the Steelers in 1995.  Both left as free agents, with Brees going to New Orleans and having a Hall of Fame career, and O’Donnell going to New York and… playing for a 1-15 Jets team. [continue reading…]

{ 3 comments }

Checkdowns: GM Genius

Ramin Mohajer is a good friend of mine and one of the most genuinely good human beings I know. He’s been working at a nonprofit for years, but alerted me to a new development yesterday: his nonprofit is launching an educational fantasy football platform and scholarship competition based on fantasy football! The new program, GM Genius, was recently featured on ESPN.

Here’s some more information about it, straight from the source: [continue reading…]

{ 1 comment }

2016 AV-Adjusted Team Age: Overall

On Tuesday and Wednesday, we looked at the average age for each team’s offense and defense in 2016. Today, let’s look at the overall picture (ignoring special teams). By that measure, the Jaguars, Browns, Rams, Bucs, and Texans have the five youngest teams in the NFL. Take a look: [continue reading…]

{ 3 comments }

2016 AV-Adjusted Team Age: Defense

Being young isn’t by itself a virtue: the Browns ranked in the bottom 5 in points allowed, yards allowed, net yards per attempt allowed, net yards per rush allowed, turnovers forced, and first downs allowed. But Cleveland was, by far, the youngest defense in the NFL last season.

Yesterday, we looked at the age-adjusted offenses from 2016. Today we do the same for defenses, and the Browns were the youngest group in the league last year, with an average age of just 25.2 years. [continue reading…]

{ 1 comment }

2016 AV-Adjusted Team Age: Offense

After each of of the last five years, I’ve presented the AV-adjusted age of each roster in the NFL. Measuring team age in the NFL is tricky. You don’t want to calculate the average age of a 53-man roster and call that the “team age” because the age of a team’s starters is much more relevant than the age of a team’s reserves. The average age of a team’s starting lineup isn’t perfect, either. The age of the quarterback and key offensive and defensive players should count for more than the age of a less relevant starter. Ideally, you want to calculate a team’s average age by placing greater weight on the team’s most relevant players.

My solution has been to use the Approximate Value numbers from Pro-Football-Reference.com, and to calculate age using each player’s precise age as of September 1 of the year in question.  Today, we will look at offenses; tomorrow, we will crunch these same numbers for team defenses. The table below shows the average AV-adjusted age of each offense, along with its total number of points of AV. Last year, the Rams, Jaguars, and Titans were the three youngest offenses. Each of those three are still in the top five this year, joined by the Bucs at #1 and the Seahawks at #4. [continue reading…]

{ 1 comment }

Today’s guest post comes from hscer, a frequent commenter here at Football Perspective. Hscer is starting a project on his website, MVPQB.Blogspot.com, where he is working on his most valuable quarterback for each season since 1951. Here’s a sample chapter today: as always, we thank our guest posters for their contributions.


 “When .500 is a Miracle” – The Giants trade a number of picks for Fran Tarkenton and immediately go from a one-win team to a .500 club.

The Stats

Unitas (AP1): 255-436 (58.5%) 3428 yards (7.86 y/a) 20 TD 16 INT, 83.6 rating, 7.13 AY/A, 11-1-2 record in starts (4 4QC, 3 GWD). Rushing: 89 yards on 22 attempts (4.0 avg.), 0 TD, 4 fumbles.

Tarkenton (MVQB): 204-377 (54.1%) 3088 yards (8.19 y/a) 29 TD 19 INT, 85.9 rating, 7.46 AY/A, 7-7 record in starts (2 4QC, 2 GWD). Rushing: 306 yards on 44 attempts (7.0 avg.), 2 TD, 4 fumbles.

The Argument

For older selections, I’ve often deferred to the AP when they pass over a quarterback on a weaker team to give their All-Pro nod to an established star on a great squad. I won’t do that here.

The 1966 Giants went 1-12-1. Much of that was due to a putrid defense which allowed 501 points, many of them in an infamous 72-41 loss to the Redskins. But the offense could not be absolved from blame. Gary Wood, Earl Morrall, and Tom Kennedy split time at quarterback, and no rusher exceeded 327 yards. As a result, New York was 12th in the 15-team NFL with 263 points scored, and 8th in yards. Just two seasons later, Morrall would be putting up Unitas-like numbers on Unitas’ own team.

In ’66, New York’s top 5 pass receivers were Homer Jones, Joe Morrison, Aaron Thomas, Chuck Mercein, and Bobby Crespino. In ’67, they were Thomas, Jones, Morrison, Ernie Koy, and Tucker Frederickson, the last two of which were also on the ’66 squad. Four starting offensive linemen returned, and the only new one was 1966 eighth-round pick RT Charlie Harper. [continue reading…]

{ 9 comments }

Today’s guest post comes from hscer, a frequent commenter here at Football Perspective. Hscer is starting a project on his website, MVPQB.Blogspot.com, where he is working on his most valuable quarterback for each season since 1951. Here’s a sample chapter today: as always, we thank our guest posters for their contributions.


“Say What?” – Was Ken O’Brien really better than Dan Marino at any point in time? For one season, he at least had an argument.

The Stats

Marino (AP1): 336-567 (59.3%) 4137 yards (7.30 y/a) 30 TD 21 INT, 84.1 rating, sacked 18-157, 6.21 ANY/A, 12-4 record in starts (4 4QB, 6 GWD). Rushing: -24 yards on 26 attempts (-0.9 avg.), 0 TD, 9 fumbles.

O’Brien (MVQB): 297-488 (60.9%) 3888 yards (7.97 y/a) 25 TD 8 INT, 96.2 rating, sacked 62-399, 6.60 ANY/A, 11-5 record in starts (1 4QC, 1 GWD). Rushing: 58 yards on 25 attempts (2.3 avg., 0 TD, 14 fumbles.

The Argument

Yes, really. Even though Ken O’Brien took far too many sacks in ’85—62 to be exact, losing 399 yards—when he got the ball off, he was better than Marino. Even when he didn’t, his passing edge was large enough to secure a higher ANY/A than The Man in Miami. Dan Fouts was another reasonable selection despite missing four games by throwing for 3638 yards and 27 TD with a league-leading 7.02 ANY/A in the games he did play, but this year comes down to Marino and O’Brien.

Dan Marino was coming off of the greatest season an NFL quarterback has ever enjoyed in 1984, still the best ever in my opinion. This likely helped his cause. It didn’t help O’Brien’s cause that he had one of the ugliest season debuts you can imagine. In a 31-0 loss to the Raiders, he was 16-29 for 192 yards, 0 TD, 2 interceptions, and sacked a whopping 10 times for -61 yards, producing an adjusted net yards per attempt of 1.05. In the final 15 games, his ANY/A was 7.14, but the first game counts all the same. [continue reading…]

{ 17 comments }

Yesterday, I wrote that NFL rookies were screwed by the CBA negotiated in 2011. Today, some more data on that point.

Using the Approximate Value metric created by PFR, we can calculate what percentage of league-wide AV belongs to each class of players. For example, rookies typically provide just over 10% of all AV in any given season; before the new CBA, that number was just under 10%. And when you combine rookies with 2nd, 3rd, and 4th year players, those players are responsible for just about half of all NFL value. Given that some 5th year players are also on their rookie contracts, it’s safe to say that about half (if not more) of all AV is provided by players on their rookie contracts.

The graph below shows, in a blue line, the percent of AV provided by players in their first four seasons.  The orange line shows the percent of league-wide AV provided by rookies.

We don’t see an enormous switch post-2011 from vetearns to rookies, just a slight one. Players in their first three seasons produced 33% of all AV from 2006-2010, which jumped to 36% over the last five years. But the bigger point is just that football is, and has always been, a young man’s game.

{ 8 comments }

Rookie contract Cam sees how little he is making.

On July 28, 2011, proven NFL veteran Kevin Kolb was traded from Philadelphia to Arizona, and signed a five-year contract worth a maximum of $63.5 millon, with $21 million guaranteed. He was cut after two seasons, but still received $30M from the Cardinals.

The next day, unproven rookie Cameron Jerrell Newton signed a completely fair 4-year, $22M contract, with a team option for a fifth year at a cost-controlled rate. No really, it was completely fair, at least according to Pro Football Talk: [continue reading…]

{ 8 comments }

Yesterday, I looked at Hall of Fame quarterbacks and All-Pro voting. In that post, I looked at all All-Pro nominations, but today I will limit this to just Associated Press first-team selections. The graph below shows the team winning percentage for AP 1AP quarterback’s team in each year since 1950. In red, I have also included the AFL AP 1AP team’s winning percentage:

[continue reading…]

{ 18 comments }

Eli Manning and the HOF, Part 2

The common argument for why Manning should make the Hall of Fame is that he and the Giants won two Super Bowls, knocking off the legendary Patriots both times. And in the modern era (i.e., ignoring Tobin Rote), only Jim Plunkett has won two Super Bowls and not made the Hall of Fame.  That’s true, but it’s also a wildly misleading way of looking at things.  If you want to argue that Manning should make the Hall of Fame, that’s a good way to frame your argument, but that’s thinking more like a defense attorney and less like a judge.

Here’s another way to think about it: every single quarterback in the Hall of Fame has been named a first-team All-Pro at least once in their career, except for one quarterback.  And that one quarterback was a no doubt Hall of Famer who also won an MVP trophy.

Two years ago, I wrote about how — statistically speakingEli Manning’s Hall of Fame case falls far short. Today, let’s look not at statistics, but at how sportswriters (i.e., those people who vote for things like the Hall of Fame) viewed these quarterbacks during their careers.  If you include Tom Brady, Aaron Rodgers, Drew Brees and Peyton Manning, there are 29 Hall of Fame quarterbacks who entered the NFL in the last 70 years.

Of that group, 16 have been named an MVP by the Associated Press: Peyton Manning (5 times); Johnny Unitas (3); Brett Favre (3); Joe Montana (2); Steve Young (2); Tom Brady (2); Aaron Rodgers (2); Kurt Warner (2); Dan Marino (1); Fran Tarkenton (1); Y.A. Tittle (1); Ken Stabler (1); Bart Starr (1); John Elway (1); Norm Van Brocklin (1); and Terry Bradshaw (1). [continue reading…]

{ 129 comments }

The most talented quarterback Kelly got to work with was a 33-year-old Vick

During Chip Kelly’s up-and-down NFL tenure, he started six quarterbacks across four seasons and two teams.  Nick Foles started 18 games for Kelly’s Eagles, the most of any quarterback; Sam Bradford started 13, Colin Kaepernick 11, Mark Sanchez 10, Michael Vick 6, and Blaine Gabbert 5. If that doesn’t sound like the greatest collection of quarterbacks to you, well, you’re right. Gabbert and Foles were terrible when not coached by Kelly, and Bradford has a career 0.408 winning percentage in games without Kelly.

The other three have winning records without Kelly, but there are other circumstances to consider. Sanchez won 53.2% of his games with the Jets, but his winning percentage in non-Kelly games were heavily inflated by the Jets supporting cast. Vick was 33 years old by the time Kelly came to Philadelphia, with his best days behind him. And Kaepernick? Well, he was on a significant decline before Kelly arrived in San Francisco, and his political stance may have impacted his style of play in 2016.
[continue reading…]

{ 8 comments }

Adam On Depression

Regular readers know Adam Harstad, a longtime friend and co-writer of mine at Footballguys.com. Adam, who is known as the second-best trivia expert on the FBG staff, is a frequent guest poster here and a good follow on @AdamHarstad.

If you’re curious about a look behind the Football Perspective posting curtain, I write most of my articles in the morning. I spend an hour between waking up and going to the gym where I catch up on life things and also draft an article for this site.

Today, I didn’t have time to do that. That’s because I was busy reading Adam’s article (posted on his own site) about depression.  It’s a long article (here’s the executive summary) but that’s a feature, not a bug.  Adam put together a very revealing and thoughtful bit of writing about a really serious and important topic. I am no expert on mental health, but I know depression is bad for at least two reasons: a lot of people suffer from it, and it has an enormous impact on those suffering from it.

It’s not easy to expose yourself to the world the way Adam has, and I commend him for it. Even more impressive: Adam admits and acknowledges that he hasn’t won, but that posting this article is part of his process in trying to overcome depression.  He said that public shame is a powerful motivator, and posting this would perhaps help him in this battle.  So if me posting this helps him help himself, hey, I’m happy to.

I also wanted to post it here to show Adam that we all support him, even if he knows that already.  And I’m sure there are other FP readers  dealing with depression in all of its stages and depths, so  I think reading Adam’s story can be helpful. If you have the time, I encourage you to read Adam’s article in full. And if you don’t have the time, I really encourage you to read his article in full. Again, I’m no mental health expert, but I think people dealing with depression find comfort in knowing that they’re not a lone, and that lots of people deal with depression.  And if you’ve come this far and are still wondering, yes, today’s post was really just a ploy to remind Adam that I’m better than him at trivia.

So today, maybe leave a nice note for Adam in the comments or on his twitter feed.  Or maybe you have some knowledge to share on mental health and depression. I trust you guys to help each other out.


{ 11 comments }

Today’s guest post comes from hscer, a frequent commenter here at Football Perspective. Hscer is starting a project on his website, MVPQB.Blogspot.com, where he is working on his most valuable quarterback for each season since 1951. Here’s a sample chapter today: as always, we thank our guest posters for their contributions.


“When Fifth is First” – Maybe fifth is unkind to Gannon’s 2000 season, but he certainly wasn’t the best or even top three.

The Stats

Let’s begin with a look at the stats from six of the top quarterbacks from 2000: Rich Gannon, Peyton Manning, Daunte Culpepper, Kurt Warner, Jeff Garcia, and Brian Griese.

QuarterbackCmp-Att-(%)-YdY/ATDINTPassRtSk-SkYdANY/AW-L4Q/GWRshYd-Rsh-YPC-TDFumDYARDVOA
Gannon (AP1)284-473-(60.0%)-34307.25281192.428-1246.7312-43/4529-89-5.9-49105221.4
Manning (MVQB)357-571-(62.5%)-44137.73331594.720-1317.2210-62/3116-37-3.1-15188838.3
Culpepper297-474-(62.7%)-39378.3133169834-1817.2811-53/4470-89-5.3-711135230.1
Warner235-347-(67.7%)-34299.88211898.320-1157.978-31/217-18-0.9-0492328.0
Garcia355-561-(63.3%)-42787.63311097.624-1557.346-100/0414-72-5.8-47164231.8
Griese216-336-(64.3%)-26888194102.917-1397.797-30/1102-29-3.5-15106234.7

The Argument

Gannon’s win here is baffling when you look at the stats in this context: he ranks 5th in DYAR, and 6th in Y/A, ANY/A, Passer Rating, and DVOA. So why did the Associated Press, along with Pro Football Weekly / Pro Football Writers of America and The Sporting News select Gannon as their first-team All-Pro quarterback?

Well, four teams went 12-4 or better, including Gannon’s Raiders. The other three teams had Kerry Collins, Steve McNair, and the
Tony BanksTrent Dilfer combo at quarterback, and Gannon had the best numbers of that group. But even for media types, it usually takes a little more than wins to clinch these awards. McNair, with 2847 yards and 15 TD on the 13-3 defending AFC Champion Titans, was likely not considered by anyone. [continue reading…]

{ 30 comments }

Why Haven’t We Improved At Making NFL Predictions?

Yesterday, we looked at the biggest “covers” in NFL history: those games where the final score was farthest from the projected margin of victory. In a 2010 game in Denver, the Raiders were 7-point underdogs, but beat the Broncos by 45 points. That means the point spread was off by 52 points, the most in any single game.

The first year we have historical point spread data was in 1978. That year, the average point spread was off by (or the average amount of points by which the favorite covered by was) 9.9 points. That number probably doesn’t mean much to you in the abstract, so let’s give it some context. From 1978 to 1982, the average point spread was off by 10.4 points. Over the last five years, the average point spread has been off by… 10.3 points.

Now I’m not quite sure what you expected, but isn’t that weird? In 1978, Vegas bookmakers were using the most rudimentary of models. Think of how farther along we are when it comes to football analytics than we were four decades ago. All of that work, of course, has to have made us *better* at predicting football games, right?

But don’t these results suggest that we are not any better at predicting games? If Vegas was missing games by about 10 points forty years ago, why are they still missing games by about 10 points? One explanation is that the NFL is harder to predict now, which… well, I’m not so sure about that. After all, even if you think free agency and the salary cap bring about parity (which is a debatable position regardless), it’s not like the lines are more accurate later in the season once we know more information. Games are also slightly higher scoring, and you could make the argument that we should be measuring how far games are off by as a percentage of the projected over/under?

Let’s look at the data. The graph below shows in blue the average “cover” in each game for each year since 1978.  As it turns out, 2016 was a really good year for Vegas — the average cover was just 9.0 points, which ranks as the most accurate season ever.  However, there’s no evidence that this was anything more than a one season blip: 2013 and 2015 were average years, and 2014 was the least accurate season ever.  It’s not like our prediction models just started getting sophisticated last season.

For reference, in the orange line, I have also shown the average point spread for each game.  That line has also been pretty consistent over time, with the average spread usually being just above 5 points. [continue reading…]

{ 15 comments }

Biggest Covers In Vegas History (1978-2016)

Last week, I noted that the Colts/Vikings game was the least-conforming game of the 2016 season. Here’s what I wrote then:

The Colts were 0.2 points per game better than average last year, as measured by the Simple Rating System (which takes the points scored and allowed in each game, and adjusts for opponent strength and home field advantage).

The Vikings were 0.9. points per game better than average in 2016, and hosted the Colts in week 15. Given those facts, we would expect Minnesota to have won by 3.7 points. Instead, Indianapolis upset the Vikings, 34-6, beating the expected line by 31.7 points. That was the least-conforming game of 2016.

Well, it wasn’t just the SRS that found that game to be pretty odd. Our friends in the desert expected the Vikings to win by 5 points, which means the Colts covered the point spread by a whopping 33 points.  Two weeks earlier, Indianapolis was actually an underdog in a Monday Night Football game that you would have had to been an idiot to attend in person.  The Colts were 1-point underdogs, but won by 31 points, giving Indianapolis a 32-point cover.  Those were two of the three biggest covers of the year, with the Eagles 34-3 win over Pittsburgh as 3.5 point underdogs (+34.5) being the biggest cover of 2016.

At Pro-Football-Reference.com, we have points spread data going back to 1978. Below are the biggest covers in history: [continue reading…]

{ 2 comments }

Today’s post is an outside the box thought experiment.  I’d love to hear your thoughts on whether this could actually work for an NFL team.

There’s nothing more valuable in the modern NFL that a good quarterback on a rookie contract. Despite that golden rule, teams are not wont to spend multiple draft picks on quarterbacks in the same draft. Since the new CBA was adopted in 2011, only two teams have spent two picks on quarterbacks in the same draft, and no team has used three.

Famously, Washington selected Robert Griffin with the second overall pick in 2012 and then drafted Kirk Cousins early in the fourth round.  That second decision turned out to be a brilliant move by the Redskins in retrospect, even if many criticized that plan at the time.  The other example was in that same draft: Indianapolis selected Andrew Luck with the first overall pick, and took Chandler Harnish with the last overall pick. [continue reading…]

{ 37 comments }

The top QB/WR duo by touchdowns, and another top-10 combo.

Three years ago, I looked at the top quarterback/receiving pairings in terms of total passing touchdowns between the two players. Per a comment suggestion, let’s update that list today. The top two pairs have not changed, but there has been some movement in the top ten.

Philip Rivers and Antonio Gates have now connected for 84 passing touchdowns, all of which came in the regular season. The list below includes the playoffs, and Young and Rice have combined for 85 regular season touchdown passes and 7 playoff scores. That means Rivers and Gates are two more touchdowns away from the second most regular season touchdowns in NFL history. Gates is tied for 6th all time in receiving touchdowns (111) with Tony Gonzalez: despite that, Gates has connected with a touchdown more often with Rivers than Gonzalez has with both Matt Ryan and Trent Green combined.

There’s another tight end duo creeping up the list: Tom Brady and Rob Gronkowski have connected for 76 touchdowns, tied for fifth place on the list. Also at 76 touchdowns: Marques Colston and Drew Brees. The interesting note there: Colston retired without ever catching a touchdown pass from anyone besides Brees.

The table below shows the full list for combinations that have at least 25 touchdown strikes: [continue reading…]

{ 22 comments }

Is Week 1 Really An Outlier?

Week 1 always seem to have some really rare results. Last year, the 2-14 49ers won 28-0 in the late MNF game on opening weekend. The Redskins finished last year with a winning record, but lost at home by 22 points to the Steelers, easily Washington’s worst performance of the season. And the Falcons won the NFC last year, but you wouldn’t have known that watching week 1: Atlanta lost at home to Tampa Bay.

In 2015, the Titans blew out the Bucs, 42-14, in the season opener; Tampa Bay finished the year 6-10, while Tennessee went 3-13. And the 49ers, who wound up going 5-11, again were week 1 superstars: in 2015, San Francisco shocked the 11-5 Vikings, 20-3, on Monday Night Football.

Many of these characters were part of the shocking week 1 results in 2014, too. That year, the 49ers beat the Cowboys in Dallas, 28-17: Dallas finished tied with the best record in the league, while San Francisco went 8-8. The Titans, as they did in 2015, were week 1 superstars in 2014: despite going 2-14, Tennessee beat the 9-7 Chiefs, 26-10, on opening day. And the Vikings and Rams show up here, too: in 2014, Minnesota won in St. Louis, 34-6, in week 1; both teams went 6-9 the rest of the year. Oh, and Miami upset the Patriots in week 1; New England won the Super Bowl, while Miami missed the playoffs.

So is week 1 really an outlier? Well, for the 49ers it obviously has been. The last three years, based on expected results (using location-adjusted SRS ratings to predict final scores), San Francisco has exceeded expectation by over 20 points in each of its last three week 1 games. But there are also teams like the Jaguars. In week 1, 2016, Jacksonville lost at home to Green Bay by 4 points, and Jacksonville finished about 8 points behind the Packers in the SRS. In 2015, the Jaguars lost by 11 at home to the Panthers in week 1, and finished about 15.5 points worse than Carolina. In 2014, Jacksonville lost by 17 in Philadelphia in week 1, and finished 2014 a little over 14 points worse than the Eagles in the SRS. In other words, Jacksonville’s week 1 performance came within 2 points of expectation — based on the full season results — in each of the last three years. [continue reading…]

{ 8 comments }

The Greatest Runners-Up In History

Lost to the eventual champion in 8 straight seasons

Happy Independence Day, folks. July 4th, 1776 was the day our forefathers declared independence in a remarkable document that’s worth your full read.  What’s known in America as the Revolutionary War began in earnest in 1775, reached ***official*** status as a revolution on this day in 1776: that was when the Declaration of Independence was adopted by Congress.  Seven years later, the British surrendered, and the war is still known there as the American War of Independence.  But let’s not give the British too much grief: after all, Britain was the runner-up in the Revolutionary War, which earns them a silver medal in that competition.

So today, let’s look at the best runners-up in NFL history. Two teams have lost in the playoffs to the eventual champion in four straight years.

1990-1993 Bills; 1967-1970 Raiders (4)

The early ’90s Bills famously lost in four straight Super Bowls, to the Giants, Redskins, and then twice in a row against the Cowboys.  But Buffalo isn’t the only team to lose to the Super Bowl champion four years in a row: the Daryle Lamonica/Willie Brown/Gene Upshaw/Jim Otto Raiders pulled off that in the final three years of the AFL and the first year of the post-merger NFL.

In 1967, Oakland made it to the Super Bowl, but lost to the Packers. In 1968, Oakland staged a classic game against the Jets for the AFL title before New York upset the Colts in Super Bowl III. In 1969, the Raiders went 12-1-1 and led the AFL in points, yards, passing yards, passing touchdowns, and yards per attempt. In the playoffs, Oakland beat Houston 56-7, but fell to the Chiefs, 17-7, in the AFL Championship Game. Then in 1970, the Raiders again were on the doorstep of the Super Bowl, but lost 27-17 to the Colts in the AFC Championship Game. [continue reading…]

{ 2 comments }

The Titans Played To Their Opponents In 2016

The Tennessee Titans were weird last year. On paper, the toughest game of the season would have been a week 15 contest in Arrowhead Stadium. And, on paper, the easiest game of the year would be a week 6 home game against the Browns. And yet against both Kansas City and Cleveland, the Titans won by 2 points.

The Titans won one game by more than 14 points last year: would you have guessed it was a 22-point win over the NFC North Champion Packers? Perhaps even more surprising: Tennessee lost one game by double digits in 2016, a 38-17 thumping put on them by… the Jaguars?

It should go without saying that teams tend to play better against bad teams and worse against good teams. But the Titans were a pretty big outlier last year. The table below shows each of the Titans games last year. The table is sorted by the “SOS+HFA” column, which shows the home field adjusted team rating of each opponent. The Chiefs had an SRS rating of +5.6, so playing at Kansas City goes down as a +8.6. The Colts were at +0.2, so playing in Indianapolis is a +3.2, while hosting the Colts is at -2.8. [continue reading…]

{ 4 comments }

Yesterday, I looked at the least-conforming games of the season. I used the SRS to derive opponent-adjusted team ratings, and then came up with a predicted point spread (based on those team ratings and the location of the game) for each game in 2016. By definition, the amount by which each team will exceed its expected points in “overachieving games” will equal the amount by which it fell short of its expected points in “underachieving games.” Since we are just manipulating the 16-game sample, a point by which a team overachieves in one game has to come from another game.

But what we can do is take the absolute value of the difference between the expected margin of victory and actual points differential to get a sense of how consistent or inconsistent each team was last year. And by that measure, the most consistent team was the New York Giants. In 13 of 16 games last year, the final margin came within a touchdown of expectation, and in 3 of 16 games the final margin came within one point of expectation.

The table below shows how to calculate these ratings. Let’s use week 1, which happens to have been one of the rare Giants games that went off script. [continue reading…]

{ 1 comment }
Previous Posts