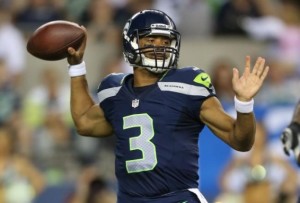
Did you know Wilson was a 3rd round pick?
The Chiefs have Alex Smith at quarterback, and while he wasn’t drafted by Kansas City, he was the first overall pick in 2005. Eight years later, offensive tackle Eric Fisher went first overall, while safety Eric Berry gives the team a third top-five pick, tied with five other teams for most in the league. Dontari Poe, Derrick Johnson, Marcus Peters, Jeremy Maclin, and Tamba Hali were all top-20 picks, too. Thought of another way, all of the top 5 Chiefs in Approximate Value were drafted in the top 20; the team’s next three leaders in AV are Hali and two high third round picks (Travis Kelce and Justin Houston).
Smith had 16 points of AV last year, or 7% of the Chiefs total AV. Since he was the first pick, and the first pick is worth 34.6 points, that means 7% of the Chiefs weighted “average draft value” is 34.6 points. Kelce had 8 points of AV, or 4% of KC’s AV; as a result, 4% of the Chiefs weighted “average draft value” is equal to 8.2, the value of the 63rd pick in the draft. Do this for every player on the team, and Kansas City’s average draft value is equal to 11.5 points, or in between the 37th and 38th picks in the draft. That maybe doesn’t mean much in the abstract, but it’s the most average draft value of any team in the NFL.
Now, let’s look at Seattle. Eight Seahawks had at least 10 points of AV last year: those players were Russell Wilson (3rd round), Bobby Wagner (2nd), Richard Sherman (5th), Michael Bennett (undrafted), Doug Baldwin (undrafted), Garry Gilliam (undrafted), K.J. Wright (4th round), and Earl Thomas (14th overall). It’s easy to forget, given how talented Seattle is, but only Russell Okung, Bruce Irvin, Marshawn Lynch, and Thomas were first round picks (and only Thomas returns for 2016). And only two of the team’s regular contributors — Wagner and Justin Britt — were second round picks. In fact, Seattle’s averaged draft value using the weighting formula described above was 5.15 points, equivalent to the 101st pick in the Draft. That’s two full rounds lower than Kansas City’s average. [continue reading…]