≡ Menu

Alabama Had The Best Draft Class Of 2017

The Crimson Tide edged out some stiff competition

One of the stories from the first round of the 2017 Draft: what happened to all the Alabama players? Through the first 15 picks, there were zero Crimson Tide selections, surprising mock drafters across the country. TE O.J. Howard was heavily linked to the Jets at 6 to the Jets, DE Jonathan Allen was viewed as a top 10 pick rumored to go as high as 3rd overall, and LB Reuben Foster and Marlon Humphrey were regularly mocked as top 15 picks.

Well, after the top 15, things went much better for Alabama.  Humphrey went 16th to the Ravens, Allen went 17 to the Redskins, and Howard went 19th to the Bucs. By the end of the night, Foster had gone, too, being selected 31st by the 49ers.  Three more players from Alabama went in round 2, two more went in round 3, and a 10th Crimson Tide star went in the fifth round.

Only Michigan had more players drafted (11), and no other school had more than eight draftees.  But while the Wolverines had more drafted players, only three players from Michigan were drafted in the first 80 picks — compared to nine for Alabama. I calculated the draft value — using my draft value chart — for each college in the 2017 Draft. [continue reading…]

{ 6 comments }

The 2017 Draft Was Defense Heavy in Round 1

There were 19 defensive players selected in the first round of the 2017 Draft. That’s a lot: from ’02 to ’17, there were an average of 16.6 defensive players taken in the first 32 picks, with a minimum of 13 (2004) and a maximum of 19 (’06, and ’17). And it wasn’t just low picks: the first selection in the draft was DE Myles Garrett, and the 49ers drafted DE Solomon Thomas with the third pick.

Defensive backs Jamal Adams and Marshon Lattimore went 5th and 11th, respectively, before six straight defensive players went, beginning with the 13th pick: Haason Reddick, Derek Barnett, Malik Hooker, Marlon Humphrey, Jonathan Allen, and Adoree’ Jackson. And from 21 to 31, 9 of the 11 players taken were defenders: Jarrad Davis, Charles Harris, Gareon Conley, Jabrill Peppers, Takkarist McKinley, Tre’Davious White, Taco Charlton, T.J. Watt, and Reuben Foster.

All told, the 19 defensive players drafted in round 1 were selected with picks holding 333 points of value on my chart. Since 1992, only one year — the ’06 draft — saw more draft value spent on defensive players in the first 32 picks.
[continue reading…]

{ 1 comment }

Two of the top three picks in the 2017 Draft.

There were six trades in the first round of the 2017 Draft, so let’s do some quick analysis of those moves. To do so, I will be using two draft calculators used: the one I created and the traditional one referenced as the Jimmy Johnson chart.

Football Perspective calculator
Traditional calculator

1)
49ers trade: 2nd overall
Bears trade: 3rd overall, 67th, 111th, and 2018 3rd round pick

Chicago traded up for UNC quarterback Mitch Trubisky. The 49ers moved down 1 spot and still grabbed Solomon Thomas, the player most expected San Francisco to take at #2.

If you value a 2018 3rd round pick as equivalent to the 100th overall pick, The 49ers traded 30.2 points of value, and received 45.3 points of value, meaning San Francisco received 150 cents on the dollar. On the traditional chart, SF traded 2600 points for 2627 points, making it a nearly perfectly even trade. If you valued a 2018 3rd as equivalent to the 110th pick, it’s a perfectly even trade.

In other words, this is a sign that teams used the traditional chart.  But we know that on average, the FP chart will provide a more accurate representation of player value. As a result, this was an outstanding trade for the 49ers, and a very, very risky one for the Bears.  If Trubisky doesn’t turn into a star, this is going to be a bad trade for Chicago.

Good analysis available here from Bill Barnwell. [continue reading…]

{ 38 comments }

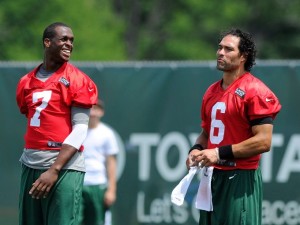
As it turns out, drafting Mark Sanchez brings with it a form of Draft PTSD. Since selecting the USC quarterback with the 5th overall pick in the 2009 NFL Draft, the Jets have used 8 consecutive picks on defensive players.  That includes four busts (Wilson, Coples, Milliner), two hits (Wilkerson, Richardson), and three players where it’s probably still too early to evaluate.  Richardson has been great at times, but has also been frustrating on and off the field; in any event, his tenure with the team is likely coming to an end soon.  Pryor and Lee are still works in process, so it’s been mostly a mixed bag for the Jets over the last seven years:

Drafted Players Table
Rk Year Rnd Pick Pos DrAge From To AP1 PB St CarAV G GS Int Sk College/Univ
1 2016 1 20 Darron Lee OLB 21 2016 2016 0 0 1 4 13 9 1 Ohio St. College Stats
2 2015 1 6 Leonard Williams DE 21 2015 2016 0 1 1 19 32 31 10 USC College Stats
3 2014 1 18 Calvin Pryor DB 22 2014 2016 0 0 3 14 44 38 2 0.5 Louisville College Stats
4 2013 1 9 Dee Milliner DB 21 2013 2015 0 0 1 6 21 14 3 Alabama College Stats
5 2013 1 13 Sheldon Richardson DT 22 2013 2016 0 1 2 26 58 55 18 Missouri College Stats
6 2012 1 16 Quinton Coples DE 22 2012 2015 0 0 2 20 62 32 16.5 North Carolina College Stats
7 2011 1 30 Muhammad Wilkerson DT 21 2011 2016 0 1 5 60 92 89 1 41 Temple College Stats
8 2010 1 29 Kyle Wilson DB 23 2010 2015 0 0 1 15 95 32 4 1 Boise St. College Stats

Will that streak end tonight? If not, the Jets will set a record by becoming the first team to use 9 consecutive draft picks on players on one side of the ball. Right now, New York shares the distinction with three other franchises who have used eight consecutive first round picks in the NFL draft on efforts to rebuild one side of the ball. [continue reading…]

{ 4 comments }

Peterson with a rare cameo by a good quarterback.

After a ten-year career with the Vikings, Adrian Peterson is now headed to New Orleans where he will get to play with Drew Brees.  It will be the second time Peterson has played with a Hall of Fame quarterback, after Brett Favre’s stint with the team beginning in 2009.

In ’09, the Vikings had a Relative ANY/A of +2.05, easily the best passing game the franchise has produced in the last decade.  In fact, the only other time in the last ten years that Minnesota had an above-average ANY/A was last year, when Peterson rushed for just 72 yards in three games.

Most of his time in Minnesota, though, the team’s passing attack has been below-average — or outright bad.  For example, in 2012, Peterson rushed for 2,097 yards.  That represented 17.9% of his career total, and it came when the Vikings had a Relative ANY/A of -0.94.  Overall Peterson has a weighted average RANY/A — i.e., the Vikings RANY/A in each season of Peterson’s career, weighted by the number of rushing yards Peterson had — for his career of -0.52.  Take a look. [continue reading…]

{ 6 comments }

Matt Waldman 2017 Rookie Scouting Portfolio

Every April 1st, friend-of-the-program Matt Waldman (@MattWaldman) releases his Rookie Scouting Portfolio. The RSP is, well, insane. It’s a 395-page draft guide that not only provides rankings and analysis of 158 players, but also provides 1,684 pages of scouting checklists and play-by-play notes.

Matt does top-notch work year round, and I can confidently state that the Rookie Scouting Portfolio is the most comprehensive analysis of rookie draft prospects at the offensive skill positions I’ve ever seen. But it’s not just about rankings and his analysis; he makes the evaluation process as transparent as possible to the reader, by identifying:

Matt documents what he sees with play-by-play detail. Yes, that’s a lot of work. No, you don’t have to read that part of the book to get tremendous value from the RSP. And here’s something pretty neat: Matt ranks every player graded by position and then writes a post-draft analysis with rankings assembled in a tiered cheat sheet. This is free with the RSP purchase and available a week after the NFL Draft.

The RSP is $21.95 and available at www.mattwaldman.com. Matt donates 10 percent of every sale to Darkness to Light, a non-profit that combats sexual abuse through individual community and training to recognize how to prevent and address the issue. You can read more about why to buy the RSP here.

{ 0 comments }

Winning The Turnover Battle

It’s one of football’s oldest maxims: the key to winning the game is to win the turnover battle. This works better as an explanation for why a team won rather than as a cause of success — correlation doesn’t equal causation, of course — but that doesn’t mean the stat is useless.

We know that turnover rates have declined significantly over the last several decades. So here’s the question of the day: does winning the turnover battle matter more or less now than it used to?

As it turns out, the importance of winning the turnover battle has been remarkably static throughout NFL history. Last year, teams that won the turnover battle won 78% of their games. And from 2007 to 2016, teams that won the turnover battle won 78% of their games. In the decade of the ’70s, when turnover rates were much higher, teams that won the turnover battle won 78% of their games. From 1950 to 2016, the average winning percentage of teams that won the turnover battle was 78%, too. Take a look: [continue reading…]

{ 9 comments }

Are Division Games Being Scheduled Later Now?

The Atlanta Falcons play zero division games in September and October. Atlanta travels to Carolina in week 9, and doesn’t play another division game until hosting the Bucs in week 12. Atlanta’s schedule finishes with the Saints, Bucs, Saints, and Panthers in the final four weeks of the season. The six NFC South games for Atlanta occur in weeks 9, 12, 14, 15, 16, and 17, which produces an average of 13.8.

The Patriots have a similar story, with an average of 13.0. New England travels to MetLife Stadium in week 6, before matching Atlanta with five of the six division games coming in the final six weeks: the Patriots final six games are, in order, Miami, @Buffalo, @Miami, @Pittsburgh, Buffalo, New York. Tampa Bay isn’t far behind, with its six division games coming in an average of week 12.8.

On the other hand, you have the Jets. New York’s average division game last year was week 11.8, which was the latest in the NFL. This year, the Jets have the earliest slate, at 7.2. New York travels to Buffalo in week 1 and the team’s home opener comes in week 3 against the Dolphins. The Jets play New England in weeks 6 and 17, but gets Miami in week 7 and Buffalo in week 9 on Thursday night. That means from November 3rd through December 30th, the Jets don’t play a single division game.

Here’s that data for every week, showing which week their division games are played. The table is fully sortable, so you can see, for example, that three teams have their 4th division game in week 15, and therefore their final three games are against division opponents: [continue reading…]

{ 11 comments }

Eli thinks the Giants schedule is fraudulent.

The Chiefs have a very friendly schedule this year when it comes to rest. Kansas City doesn’t have a single game this year when it played a game more recently than its opponent. The only other team that received that scheduling break is the Rams.

On the other hand, you have the Giants. New York has four games against opponents with extra rest, including three where the opponent is coming off of a bye. Denver has a bye in week 5, and plays the Giants at home in week 6; Seattle has a bye in week 6, then travels to New York in week 7; Kansas City has a bye in week 10, then travels to MetLife to face the Giants in week 11. The Giants have a fourth game against an opponent coming off of a bye — against the Rams in week 9 — but both New York and Los Angeles have a bye in week 8. Finally, the Cowboys play on Thanksgiving in week 12 and on TNF in week 13 before facing the Giants on the road in week 14; that gives Dallas 10 days of rest before that December matchup, compared to 7 for the Giants.

So the Giants got a raw deal there: the 49ers (Arizona week 9, Dallas week 7, Washington week 6) and Lions (NO week 6, Cle week 9, GB week 8) are the only other teams to face three opponents coming off an extra week’s rest. Washington has a week 5 bye and hosts San Francisco in week 6, Dallas has a week 6 bye and travels to San Francisco in week 7, and Arizona has a week 8 bye before going to San Francisco in week 9. Detroit travels to New Orleans in week 6 after the Saints week 5 bye, heads on the road to face the Packers in week 9 after Green Bay’s week 8 bye, and hosts the Browns in week 10 after Cleveland’s week 9 bye.

Okay, so the Chiefs and Rams get a break when it comes to their opponents’ rest days, and the Giants, Lions, and 49ers are victims of poor scheduling. What about the other side — i.e., each team’s own rest? Well, Kansas City is the big winner here, too.

Because the Chiefs have two Thursday night games — the kickoff game and week 7 in Oakland — Kansas City has 10 days of rest before its game in weeks 2 and 11 days of rest before its Monday Night game in week 8, giving the Chiefs three more days of rest than the Eagles and Broncos, respectively. And since the Chiefs face the Giants after Kansas City’s bye, that’s a third game with extra rest.

Meanwhile, a few teams — including the Giants — are in worse shape. Because New York plays the previously idle Rams after the Giants own bye, New York doesn’t have any games with a long rest advantage. The Giants only rest advantage comes when — after playing on Thanksgiving in week 12 — New York has three extra days in advance of a trip to Oakland. [continue reading…]

{ 6 comments }

The 2017 NFL Schedule

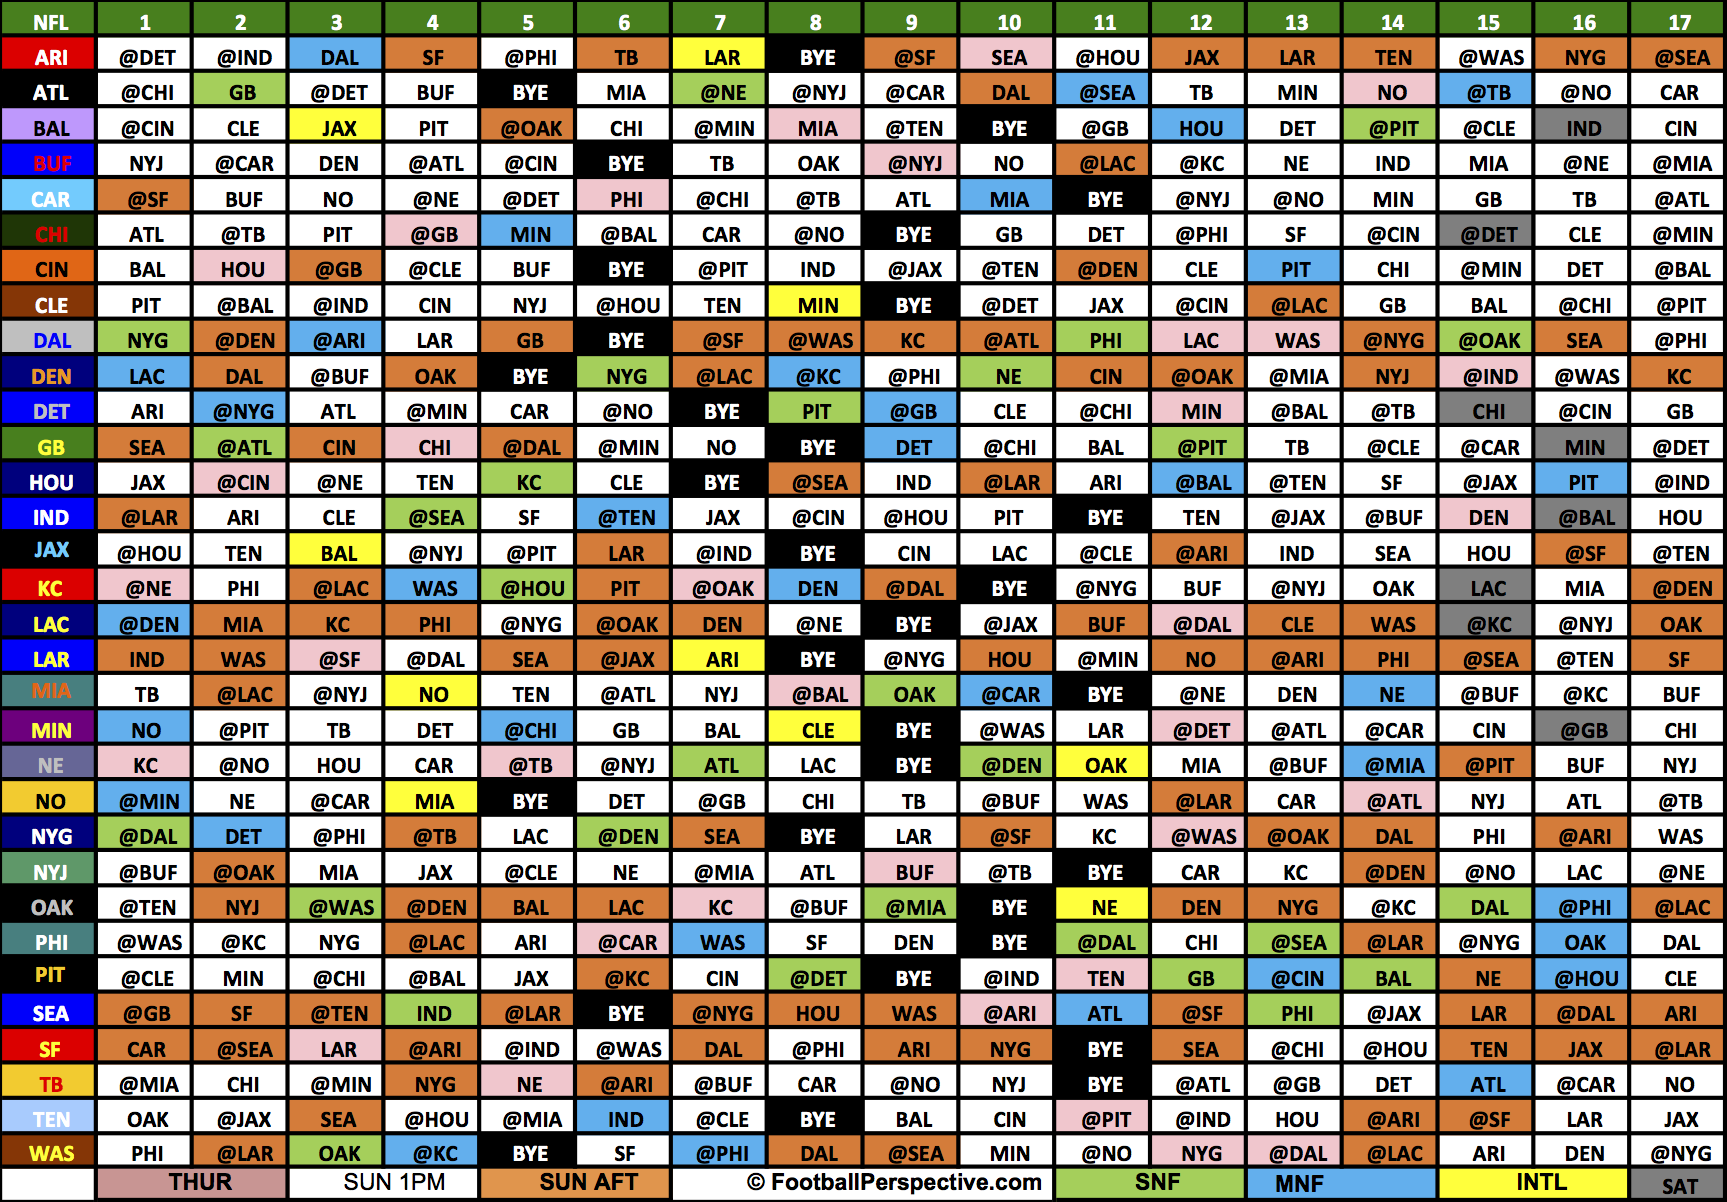
The color-coded schedule is back!

Download the Excel file here

Best version for an iPhone 6s

Who Plays On What Days?

There are 17 games on Thursdays this year, which matches the number of weeks of the season. There is one game each week of the season most weeks, but there are no Thursday games in weeks 16 and 17, and three on Thanksgiving (week 12). The three Thanksgiving games: Vikings at Lions, Chargers at Cowboys, and Giants at Redskins. The Browns and Jaguars do not get one, but the other 30 teams get at least one Thursday game. That means four teams play twice on Thursday: the Chiefs (week 1 at New England, week 7 at Oakland) and Patriots (week 5 at Tampa Bay) play in both the NFL Kickoff Game and during the regular Thursday night schedule. And Washington and Dallas — who play different opponents on Thanksgiving — play against each other on Thursday the following week.

Once the college regular season ends, the NFL does take over two Saturdays: December 15th and December 23rd. Those games are all rivalry games: Bears/Lions and Chiefs/Chargers in week 15, and the Colts going back to Baltimore and the Vikings and Packers the following week.

There are 17 games on Monday night football, and 18 games on Monday: one each week for 16 weeks, with no week 17 game, but two in weeks 1 and 16. The Saints travel to Minnesota in the early MNF game in week 1, while the Chargers visit Denver in the last game. At the end of the year, the Steelers head to Houston on Christmas Day, which falls on a Monday, to play in the 4:30 time slot. That night, the traditional MNF game is Raiders/Eagles, which is sure to feature a pair of merry fanbases.

Neutral Site Games

There are five special site games: the Patriots play “at” Oakland at 4:25 on the east coast in week 11 in a game in Mexico City, to go along with the four London games. The Jaguars, Dolphins, Rams, and Browns all lose home games, too, to face the Ravens, Saints, Cardinals, and Vikings respectively. Those London games take place in weeks 3, 4, 7 and 8: all but the Rams-Cardinals game in week 7 kick off at 9:30 on the east coast, while the NFL thankfully isn’t making west coast fans wake up at 6:30 to see the Rams/Cardinals, which kicks off at 1:00 on the east coast.

{ 24 comments }

Games Are Closer Than Ever Now, Part III

Part I

Part Ii

Last season, Washington and Detroit each played in 9 games where there was a 4th quarter score to take the lead (i.e., the game was either tied, or the team that scored was trailing before the score and leading after the score). On the other side, the 49ers played in just two such games.

The record for games with a 4th quarter score to take the lead is 11, set by the 1989 Chargers, and matched by the 1997 Cardinals and 2013 Lions.

Yesterday, I looked at 4th quarter comebacks using a narrow definition: I only included games where the winning team trailed after three quarters, which was the case in about 16% of all games. That number doubles if you use today’s broader definition: the graph below shows the number of games where a team scored in the 4th quarter to take the lead:
[continue reading…]

{ 1 comment }

Games Are Closer Than Ever Now, Part II

Part I

The Detroit Lions went 9-7 in 2016, but it was a remarkable 9-7. That’s because quarterback Matthew Stafford recorded 8 fourth quarter comebacks and 8 game-winning drives! That’s right: in all but one win for the Lions (and therefore, all but one game), Detroit trailed at some point in the 4th quarter.

That makes those 4th quarter comebacks sound impressive: if not for those 4th quarter comebacks, the Lions would have gone 1-15. And they were impressive! But here’s a way to make them appear less impressive: Detroit won just a single game last season where the team trailed entering the 4th quarter.

No, really. The Lions trailed by 3 points entering the 4th quarter in a home game against Jacksonville, and won 26-19. The Lions were 1-6 when trailing after three quarters in 2016. Detroit did win two games when tied after three quarters, and went 6-1 when leading after three quarters.

This isn’t intended to diminish Stafford’s performance last year, but rather to put some perspective around the idea of 4th quarter comebacks/game-winning drives. In a lot of competitive games, there are a number of lead changes in the 4th quarter, and it makes sense to call all lead-changing drives a comeback.

That said, let’s look at a different definition of a 4th quarter comeback: one where a team won after trailing while entering the 4th quarter. By that measure, Oakland led the NFL with 5 such comebacks, and the Raiders went 5-4 when trailing after three quarters. Although maybe pump the brakes a little bit if this fact alone causes you to elevate Derek Carr in your brain: the Raiders trailed entering the final frame by 1, 1, 3, 4, and 11 (opening day against New Orleans) points in those games.

In 2016, just 39 games saw a team trail entering the 4th quarter and go on to win; another two ended in ties. For context, there were 245 games overall in 2016 where a team trailed entering the 4th quarter overall. [1]Said another way, there 11 games that were tied entering the 4th quarter. That means teams won [2]Counting ties as half-wins. 16.3% of games when trailing entering the 4th quarter. That’s not remarkable at all, and matches the long-term average throughout football history. The graph below shows the winning percentage, by season, among teams that trailed entering the 4th quarter: [continue reading…]

References

References
1 Said another way, there 11 games that were tied entering the 4th quarter.
2 Counting ties as half-wins.
{ 12 comments }

The Jets, And Draft Capital Spent On QBs Since 2009

Drafting quarterbacks is more art than science. And by art I mean film noir.

The Jets have drafted a quarterback in each of the last four drafts, and six quarterbacks since the 2009 draft. And yet the Jets still — unless they already do have their guy in Penn State’s Christian Hackenberg — are trying to solve the quarterback riddle.

Let’s be clear: this sort of analysis is mostly trivia in nature.  That’s because past draft picks are simply sunk costs, although that’s generally only clear after a team has reached an evaluation on a player.  The Jets drafted Mark Sanchez in 2009, and that didn’t work out.  Four years later, the team selected Geno Smith in the second round, and that didn’t work out, either. In between, the Jets spent a 7th round pick on Greg McElroy, but spending much time lamenting the use of a 7th round pick is not productive.  Similarly, a year after drafting Smith, the Jets selected Clemson’s Tajh Boyd in the 6th round. New York then upped the ante by grabbing Bryce Petty in the fourth round in 2015, a move which seems unlikely to pay off.

And while those picks may not have been good, they were old made under an old regime. General manager Mike Maccagnan came on board in 2015, and while he didn’t draft a quarterback that year, he did trade a 7th round pick for Ryan Fitzpatrick, a moved that was heralded as a steal last December.  So far, the only quarterbacks drafted by Maccagnan were Petty in ’15 and the second round pick used on Christian Hackenberg last year.  Petty has underwhelmed in limited action, while there has been no ability to grade the Hackenberg pick so far, as he (intentionally) did not see the field last year.

So yeah, the Jets have drafted a lot of quarterbacks.  And for the most part, those picks have been bad.  But that doesn’t mean the Jets should stop drafting quarterbacks or that drafting quarterbacks is a bad idea. It just means the team hasn’t found its quarterback yet — unless, again, they already have in Hackenberg (or perhaps Petty).

Two years ago, I looked at the draft capital spent on quarterbacks from 2000 to 2014.   Today I want to do the same thing but from 2009 (when the Jets drafted Sanchez) to 2016.  Again, I’ll be assigning draft picks value based on the Draft Pick Value Calculator, which comes from the values derived here and shown here. If we assign each draft pick its proper value, and then sum the values used to select quarterbacks by each team over the last eight years, we can see which teams have devoted the most draft capital on quarterbacks.

And while the Jets have used six picks on quarterbacks over that time period, New York isn’t alone. The Broncos have, too, and Denver may not be much closer than the Jets are when it comes to finding their franchise quarterback of the future. The table below is sorted by total value, and the Jets rank “only” 4th in that regard, behind the Rams (who have spent two number one picks on passers during this time frame), the Bucs (a #1 and another first) and the Titans (a #2 and a #8). I hvae also listed each quarterback selected by each team during this time frame, from most valuable pick used to least. Take a look: [continue reading…]

{ 7 comments }

Today’s guest post comes from Damon Gulczynski, a longtime reader, Seattle sports fan, and part-time writer. He also wrote this book on baseball names. As always, we thank our guest posters for contributing.


A journeyman quarterback appears here

When the New York Jets exercised an option to void the contract of quarterback Ryan Fitzpatrick in February, they paved the way for yet another stop on his already lengthy tour through the cities of the NFL.  If the hirsute Harvardian plays in at least one game this upcoming season with a new team, it will mark the seventh time he has done so.  To my knowledge, this would tie the all-time record among NFL quarterbacks.  That is, unless his replacement in New York takes a snap before him.  Josh McCown has already played with seven different NFL teams; the Jets will be his eighth.

At this point, both McCown and Fitzpatrick have surely already attained the venerated title of “journeyman,” but it goes beyond this.  I contend that by the end of the 2017 NFL season, McCown and Fitzpatrick will be the two journeyman-est quarterbacks in NFL history.  To support this contention, I introduce a new metric I developed called Journeyman Score (JM score). [continue reading…]

{ 22 comments }

Games Are Closer Than Ever Now

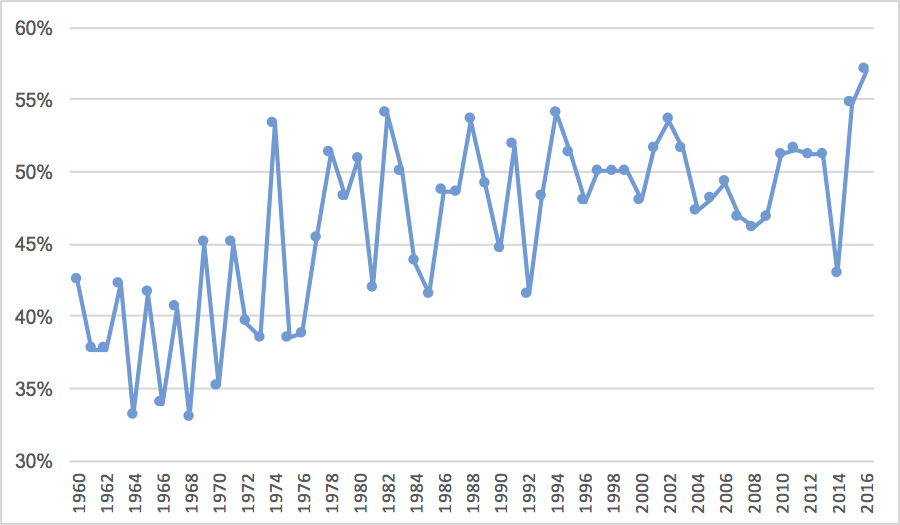
In 2016, 146 of 256 regular season games finished with a margin of victory of 8 or fewer points. That’s an incredible 57.0% of all games being decided by one score, which makes the 2016 season one of the most competitive in NFL history. If not the most competitive. In 2015, 54.7% of all games were decided by 8 or fewer points; prior to that, no other season since 1960 finished with 54.1% or more games being decided by one score.

The graph below shows the percentage of all games since 1960, by year, where the final margin was 8 or fewer points:

[continue reading…]

{ 15 comments }

Trivia of the Day – Saturday, April 15

Texas A&M defensive end Myles Garrett is likely going to be the first overall pick in the draft, especially after his dominant performance at the NFL Combine.  He would be the second front seven player from the SEC to go number one in three years, after Jadeveon Clowney was the first overall pick in 2014.

But only one other front seven player from the SEC has gone first overall.  Can you name him?

Trivia hint 1 Show


Trivia hint 2 Show


Trivia hint 3 Show


Click 'Show' for the Answer Show

{ 4 comments }

Myles Garrett Is Your 2017 Combine Champion

Myles Garrett is in good shape.

Over the last few days, we have looked at how the top college athletes performed in various drills at the NFL combine, after adjusting for height and weight. Today, we look at the full results and crown a combine champion.

That is a pretty easy thing to do, as it turns out. Texas A&M defensive end Myles Garrett is likely going to be the first overall pick in the draft, and his performance in Indianapolis cemented such a distinction. Garrett had the 2nd best performance in three separate drills: the 40-yard dash, the bench press, and the vertical jump. Then, he produced a 5th-place finish in the broad jump, while sitting out the 3-cone drill. Garrett competed in four of these five events and his averaged finish was 2.8. That’s tremendous.

The table below shows the results in these five drills. I have also included an average rank, excluding all events where a player didn’t participate. That’s not the best way to do this, but I don’t know of a simpler method to rank them. The far right column shows how many of the 5 events each player competed in, so that can be a useful guide. It’s clear to me that the runner up for Combine King is Solomon Thomas rather than Aviante Collins. Thomas had an average rank of 7.6, but he competed in all five events. Collins has a higher rank at 5.0, but the TCU tackle only competed in the 40 and the bench press. To me, a 1-7-8-8-14 is more impressive than a 5-5-dnp-dnp-dnp, but to keep things simple, I just used a simple average. [continue reading…]

{ 1 comment }

Thomas was a combine superstar

As you can imagine, heavier players fare much worse in the 3-cone drill, and taller players have a slight advantage, too. Here was the best-fit formula from the 2017 combine:

7.3397 -0.0317 * Height (Inches) + 0.0091 * Weight (Pounds)

Stanford running back Christian McCaffrey is one of the more interesting prospects from this draft, and he dominated in the 3-cone drill, finishing in 6.57 seconds, just one hundredth of a second behind the leader. Given his dimensions — 71 inches, 202 pounds — he’d be expected to complete the drill in 6.93. McCaffrey therefore finished the drill in 0.36 seconds more than expected, the 7th-best adjusted performance in this drill.

The top performance belonged to a different Stanford player, defensive end Solomon Thomas, who finished a full 0.50 seconds above expectation. The full results, below: [continue reading…]

{ 1 comment }

Hey, look who it is again.

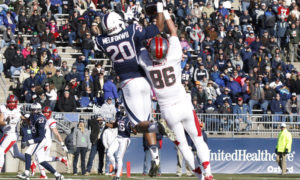
Yesterday, we looked at the vertical jump, which is biased towards lighter players. The star at the combine was Connecticut safety Obi Melifonwu, who had both the top vertical jump and the top weight-adjusted vertical jump. Well, Melifonwu also had the longest broad jump at the combine.

The broad jump is also biased in towards lighter players, but it’s also biased towards taller players. As a result, we need to adjust broad jump results for both weight and height: the best-fit formula from the results of the 2017 combine is:

Broad Jump = 84.14 + 1.0766 * Height (Inches) – 0.1940 * Weight (Pounds)

For Melifonwu, he weighed 224 pounds and was 76 inches tall; that means he’d be projected to jump a solid 122.5 inches. That’s a pretty high projection, showing that Melifonwu’s body is well-tailored for this drill. But even still, he exceeded that jump by 18.5 inches, courtesy of his remarkable 141 inch jump. As a result, he once again had both the top jump and the top adjusted jump: [continue reading…]

{ 0 comments }

Being able to jump high might be useful for a safety

Let’s begin with the most remarkable of today’s feats: Myles Garrett is getting pretty good at this number two thing. After finishing second in the weight-adjusted 40 and second in the height and weight adjusted bench press, Garrett has again finished second in a combine drill, this time the weight-adjusted vertical.

When it comes to the vertical jump, weight is by far the most important thing that matters. For every additional 16.7 pounds a player weights, his expected vertical declines by one inch. That’s because the best-fit formula for projecting the vertical jump at the 2017 combine was 46.38 – 0.0597 * weight (pounds). Connecticut safety Obi Melifonwu weighed 224 pounds in Indianapolis, which would project him to jump an even 33 inches if he was average at this drill.

Well, Melifonwu was anything but average. He jumped an incredible 44 inches: for comparison’s sake, Florida State / Jacksonville safety Jalen Ramsey had a 41.5 inch vertical last year, tied for the most of any player at the 2016 combine. And that was at 209 pounds. Melifonwu was 15 pounds heavier and jumped 2.5 inches higher. That’s a remarkable feat, and brings to mind some of the great verticals from the 2015 combine.

And while Melifonwu was 11 inches better than expected, Garrett was right on his heels at +10.9 inches. Garrett weighed 272 pounds at the combine, but still jumped an insane 41 inches. That’s only three fewer inches than Melifonwu at 48 pounds heavier. Now because the average player lost 16.7 inches for every pound, that makes Melifonwu’s jump just slightly better, but the two of them were far ahead of the rest of the pack. Below are the full results: [continue reading…]

{ 1 comment }

Lawson, when he’s not on the bench press

Yesterday, I looked at the best weight-adjusted 40-yard dash times at the 2017 NFL Combine. The Browns are expected to select Texas A&M defensive end Myles Garrett with the first overall pick, and with good reason: he had the 2nd best weight-adjusted 40-yard dash time, and he comes in 2nd place again today in the height and weight adjusted bench press.

In 2015, Clemson/Atlanta Falcon Vic Beasley was the bench press champion, using a formula involving expected bench press reps based on a player’s height and weight.  That turned out to be pretty predictive of future success; on the other hand, last year’s winner was Nebraska fullback Andy Janovich, who wound up being a 6th round pick and a minor contributor as a rookie with the Broncos.

The best-fit formula to project bench press reps for the 2017 Combine was:

17.401 -0.3354 * Height (Inches) + 0.1075 * Weight (Pounds)

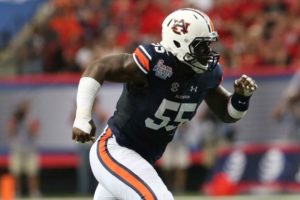
Using that formula, Garrett — at 76 inches and 272 pounds — would be projected to bench press 225 pounds for 21.1 reps. In reality, Garrett produced a whopping 33 reps, or 11.9 more than expected. The only way to top him was Auburn’s Carl Lawson, who measured at 74 inches and only 261 pounds. Being shorter is better, but being lighter is worse, and Lawson would be projected using the regression to have 20.6 reps on the bench press. Instead, he had 35, or 14.4 more than projected, easily the largest margin at the combine.
[continue reading…]

{ 0 comments }

O.J. Howard is fast.

As I have done for the last few years, this week I will be using the raw NFL combine data and adjusting them various metrics.  With respect to the 40-yard dash, the only adjustment I’ve made is for weight, as no other variable (e.g., height) impacts a player’s 40 time quite like weight.  The best-fit formula to predict 40-yard dash time during the 2017 combine was 3.283 + 0.00606 x weight. ((This time around, I excluded punters, kickers, and long snappers when running regressions, as those players aren’t invited to their combine for their raw athleticism (and removing them made the numbers a little tighter). As you can see

Let’s use Alabama tight end O.J. Howard as an example.  He weighed 251 pounds at the combine, which means he would be projected to run the 40-yard dash in 4.81 seconds. Instead, he ran it in just 4.51 seconds, a full 0.30 better than expected.

That was the best performance of any player at the combine. A very close second was produced by the presumptive number one pick in the draft, Myles Garrett. The Texas A&M defensive end weighed 272 pounds, so using the formula above, a player of Garrett’s size should run the 40 in 4.93 seconds.  But Garrett was 0.29 seconds better than expected, completing the drill in 4.64 seconds. Garrett reportedly bested that time by running 40 yards in 4.57 seconds at his Pro Day, too. [continue reading…]

{ 4 comments }

The Broncos thought they had found their heir apparent.

The Giants, Saints, Steelers, and Chargers all have older franchise quarterbacks, leading many to speculate that one or more of those teams will spend an early pick on a quarterback. That could even include a first round pick, which made me wonder: how often do teams do that?

I looked at all teams since 1967 that:

  • Used a first round pick on a quarterback;
  • Had a QB on the roster the year before and that upcoming season who was at least 32 years old in the upcoming season;
  • That QB threw at least 100 passing touchdowns with that team.

There are 15 examples that fit those specific criteria.  Let’s review: [continue reading…]

{ 9 comments }

In 1973, the 14 AFC teams housed 8 Hall of Fame quarterbacks. The AFC East had Joe Namath and Bob Griese with the Jets and Dolphins, the AFC Central had Pittsburgh’s Terry Bradshaw, and the AFC West had five HOF QBs: Len Dawson was with the Chiefs, while the Chargers had a first-year Dan Fouts and a last-year Johnny Unitas. The Raiders? They had Ken Stabler and George Blanda. And in the NFC, Sonny Jurgensen and Roger Staubach were the signal callers for Washington and Dallas, while Fran Tarkenton was the Vikings quarterback. That means the ’73 NFL (along with the ’70 and ’71 versions, which didn’t have Fouts but did have Bart Starr) housed 11 future Hall of Fame passers. And that excludes Ken Anderson, of course, who entered the league in ’71.

Meanwhile, in ’81 and ’82 — at a time, I’ll note, when Ken Anderson was doing pretty darn well — there were just four active HOF QBs. Stabler, who finally made it as a seniors’ nominee last year, Fouts, Bradshaw, and Joe Montana. On average, there have been about 7-8 active HOF quarterbacks at any one time. [continue reading…]

{ 17 comments }

2016 Postseason Game Scripts

With one massive exception, the 2016 playoffs were not very interesting. The home team usually won, the favorite usually won, and usually by a large margin. In 8 of 10 games (ignoring the neutral site Super Bowl), the home team was the favorite and won by 13+ points.

And the Game Scripts weren’t all that exciting, either. Most of the games weren’t Super Bowl, and there was just one comeback. Of course, it wasn’t just any comeback; it was perhaps the comeback. Take a look: [continue reading…]

{ 7 comments }

Tony Romo Has Borderline HOF Stats (Era-Adjusted)

This photo probably has one HOF QB

Yesterday, Tony Romo announced that he was retiring from football after an excellent career with the Cowboys. Now here are two interesting questions: will he be a Hall of Famer? And should he be a Hall of Famer?

Regular readers will recall that in 2014, I looked at how Eli Manning’s stats compared to other Hall of Fame passers. I used a quick-and-dirty method to measure quarterback dominance, reprinted below.

  • Step 1) Calculate each quarterback’s Adjusted Net Yards per Attempt (ANY/A) for each season of his career where he had enough pass attempts to qualify for the passing title (14 attempts per team game). ANY/A, of course, is calculated as follows: (Passing Yards + PassTDs * 20 – INTs * 45 – Sack Yards Lost) / (Pass Attempts + Sacks).
  • Step 2) For each quarterback, award him 10 points if he led the league [1]For purposes of this post, I have combined all AFL, NFL, and AAFC Stats. in ANY/A, 9 points if he finished 2nd, 8 points if he finished 3rd, … and 1 point if he finished 10th. A quarterback receives 0 points if he does not finish in the top 10 in ANY/A or does not have enough pass attempts to qualify. This is biased in favor of older quarterbacks to the extent he is playing in a smaller league. For example, Charlie Conerly
  • Step 3) For each quarterback, add his “points” from each season to produce a career grade.

[continue reading…]

References

References
1 For purposes of this post, I have combined all AFL, NFL, and AAFC Stats.
{ 123 comments }

Dan Fouts, and Winning vs. Stats Part 4

On Thursday, I looked at quarterbacks from 2016 who started at least 8 games and threw at least 150 passes. For those passers, I calculated how many standard deviations above average they were in Relative ANY/A (i.e., how much better they were, statistically, than average) and in winning percentage. I sorted the list by the difference between the two, to find the quarterbacks whose stats and winning percentages diverged by the largest amounts. And Friday, I looked at the quarterbacks whose passing stats most greatly exceeded their winning percentage in any given season.  On Saturday, I looked at the reverse: the quarterbacks whose winning percentages greatly exceeded their stats.

Today, let’s look at some career ratings.  One key note: This is a “career” rating but it excludes all seasons where a quarterback started fewer than 8 games, or threw fewer than 150 pass attempts.  So this excludes partial seasons, making it not a true snapshot of a player’s career, but rather a quarterback’s career as his team’s main starter.

The main leader here is Dan Fouts, and it’s not particularly close.  Over the course of his “career” — which spans 13 seasons as a starter with 150+ attempts — Fouts was a total of 13.8 standard deviations above average in ANY/A. However, he was barely above average in winning percentage, at just 0.23 standard deviations. Remember, Fouts had two top-30 seasons and four top-100 seasons in terms of his stats exceeding his record. As a result, his total “Diff” is 13.57, easily the most of any quarterback in this study, with Dan Marino, Boomer Esiason, and Drew Brees.

But since this is a cumulative stat, I wanted to also look at things on a per season basis.  So Fouts was, on average, 1.06 standard deviations above average in ANY/A, and just 0.02 in winning percentage, for an average difference of 1.04.  So is it better to sort the list based on cumulative difference, which is biased towards longevity, or average difference, which can be skewed by players who only played a few seasons? To combine the two ideas, I came up with a third column called Adj Diff.  That’s calculated by adding 6 seasons of average (i.e., 0.00) play to every player’s total diff, and re-calculating their average on a per-season (with 6 additional seasons) basis.  This helps blend both ideas, in my opinion.  If you have only a few seasons, 6 seasons of average play will drop you down significantly, but it also limits the value given to compilers.  Anyway, here’s the list: [continue reading…]

{ 51 comments }

Today’s guest post comes from James “Four Touchdowns” Hanson, a relative new reader to the site. As always, we thank our guest posters for contributing.

[Editor’s note: There were a couple of minor bugs in the original data. This post has now been updated.]


There may be no two quarterbacks more often measured against each other than Tom Brady and Peyton Manning. One simply has to do a Google search of the topic to see that fans and sports writers have compared the two numerous times, using a vast array of criteria from the simple counting of championships to using advanced analytics to make their case.

So it’s surprising to me that I still haven’t come across a comparison of Manning and Brady against the same defenses. It’s an idea that occurred to me when Manning critics pointed out that much of his record-breaking 2013 season came against the mediocre teams of the 2013 NFC East and AFC South, while Tom Brady’s record-breaking 2007 was against a tougher strength-of-schedule. [1]While I am a Peyton Manning fan, I feel the point is valid and logical. We compare stats so often but don’t always take into account that most of those numbers were earned against different teams … Continue reading If we’re genuinely after the fairest assessment possible – which is why I assume fans of advanced analytics prefer to measure individual players by their own production rather than team results like wins and championships – what better way to measure each player than by how they performed against the same competition?

So I decided to take a look at the seasons in which Manning and Brady were both active and played against the same teams in the same season. Of course, like any statistical analysis, this one comes with its own set of flaws. When the two quarterbacks play each other’s divisions or one plays the same team in the regular season and the playoffs, one of them may have played the same team twice or even three times in a single season while the other has played them only once.

This can be good or bad for the player’s results – sometimes it allows the opposing defense to learn from the first encounter and make life difficult for the passer the second time around. One example is Peyton Manning’s encounters with the Steelers in 2005; he defeated Pittsburgh with a 102.9 rating and 8.67 ANY/A during the regular season, only to see his performance suffer the second time around during the post-season with a 90.9 rating and 6.21 ANY/A in a loss. Meanwhile, Tom Brady’s single game against the Steelers, where he won with a 92.7 rating and 6.84 ANY/A, stands alone – could he have done better or worse in a second encounter? We’ll never know.

Other times, it can allow the quarterback another opportunity to do well against that defense. When Brady played the Jets for the first time in 2010, he earned a mediocre 72.9 rating and 5.11 ANY/A in a loss. He bounced back to win with an extraordinary 148.9 rating and 12.00 ANY/A in their second meeting and then fell somewhere in between when they met in the playoffs, losing with an 89 passer rating and 5.08 ANY/A. Meanwhile, Manning met the Jets just once in the post-season, where he suffered a loss despite earning a 108.7 rating and 8.85 ANY/A in his last game wearing a Colts uniform. How would he have done if he played the Jets three times? Again, we’ll never know.

In fact, the sometimes vast difference in which each QB has performed against the same defense in the same season should encourage us to take these results with a grain of salt – in-game conditions, game plans from coaches, the play from supporting casts, how one team’s strengths and weaknesses match differently with an opponent, playing at home or away, key injuries on either side, etc. can all effect a player’s performance in any given game.

And there’s always the possibility that Brady or Manning just had a bad day and their performance isn’t indicative of their true abilities: the small sample size of a football season made even smaller by singling out common opponents isn’t ideal in determining a fair and scientific measurement for how good each player actually is. On the other hand, it’s the only evidence we have available, so we’ll have to roll with it.

I bring this up because I don’t intend this to be a definitive attempt at determining which player is better – most people already have made up their minds (and I personally tend to rate quarterback on tiers anyway). Some say Manning would have more championships if he had Belichick and the Patriots organization at his side, while others say Brady would have bigger numbers if he had the receiving talent Manning had during his career. I think both can be true.

I’d also like to mention that I pulled this list manually and despite several reviews, there still may be errors in the data – this is unintentional and I welcome any corrections.

So without further ado, here’s a list of the common opponents they faced in each season, with both 2008 (Brady played one game) and 2011 (Manning was inactive) removed as both players weren’t active during those seasons:

• 2001: Jets, Bills, Dolphins, Raiders, Saints, Falcons, Broncos, Rams
• 2002: Dolphins, Jets, Steelers, Titans, Broncos
• 2003: Dolphins, Jets, Bills, Browns, Broncos, Jags, Texans, Titans, Panthers
• 2004: Ravens, Chiefs
• 2005: Steelers, Jaguars, Chargers
• 2006: Bills, Jets, Dolphins, Titans, Jags, Texans, Broncos, Bengals, Bears
• 2007: Chargers, Ravens, Jaguars
• 2009: Bills, Jets, Dolphins, Titans, Jags, Texans, Ravens, Broncos, Saints
• 2010: Chargers, Jets, Bengals
• 2012: Texans, Ravens
• 2013: Colts, Ravens
• 2014: Bills, Jets, Dolphins, Raiders, Chiefs, Chargers, Colts, Bengals, Seahawks
• 2015: Colts, Steelers, Chiefs

And here are their career averages against common opponents from 189 total regular season and playoff games played (93 Manning, 96 Brady):

Except for interception percentage, Manning seems to have a slight advantage across the board. Most differences are so small that I personally consider them basically even in most categories. The biggest differences seem to be that Manning’s interception rate is substantially higher, while Brady’s sack numbers are substantially higher – and in Brad Oremland’s TSP and Career Value metrics, where Manning holds a commanding lead.

To delve a little further into the numbers, let’s look at the advanced stats of each player by season. The highlights indicate which player did better that year in each metric, while the bolded numbers indicate that season’s number marks a career best (against common opponents) –

The leader in both ANY/A and Passer Rating match in every season, with Manning’s rates beating Brady’s in 8 of the 13 seasons compared. QBR results are also is very similar, with the only difference being Brady having the edge in 2014, putting them even at 4-4.

Interestingly, it seems that for most seasons, one player clearly played better against common opponents by a substantial amount – in Passer Rating, the two only play at a similar level in 2001 and 2007, while the rest of the time the winner often beats the other by ten points or more! What’s really surprising to me is that Manning surpasses Brady in every metric for 2007, which was when Brady led perhaps the greatest offense of all time to a record-breaking season and an AFC Championship.

I also wanted to compare their performances against common opponents in each season by TSP but since it’s a raw sum instead of an average like the other advanced stats, I needed to take each season’s statistical averages and multiply them to get 16 games worth of production. The results were –

The first thing that jumps out at you is Manning’s preposterous 2013 prorated across 16 games – over 6,500 yards and 75 TDs with only 5 INTs. That alone tells us to take these results with a grain of salt.

But accepting the numbers for what they are, we see that the leader in TSP for each season matches the leader in Passer Rating and ANY/A. We also see that Manning’s highs and lows are quite extreme in comparison to Brady’s – Brady doesn’t have a season that matches Manning’s 2004 and 2013, but Brady’s TSP never dips into negative numbers as Manning’s does in 2002 and 2015.

And again, Manning’s 2007 results manage to top Brady’s numbers for his most legendary statistical season (though that probably means nothing since the sample size we’re working with is so small).

So what does this all prove? Well, nothing really. As said, I think the majority of people already have their opinions set for these players – this is just for fun. Hope you enjoyed!

References

References
1 While I am a Peyton Manning fan, I feel the point is valid and logical. We compare stats so often but don’t always take into account that most of those numbers were earned against different teams of varying quality – after all, it’s not fair to compare passing numbers if one guy is going up against the 2002 Bucs while the other is playing the 2015 Saints, right?
{ 207 comments }

Thoughts on the 2016 NFL Playoffs

The cherry on top of a boring dessert

There were really only three notable games in this year’s playoffs. The Super Bowl, of course, was a classic game, if not necessarily a good one to watch from start to finish. The Patriots completed a historic comeback and won in overtime, 34-28.

And there were two upsets: the Packers went into Dallas and won, 34-31, in what was the best game of the playoffs. And the Steelers went into Kansas City and won in a sloppy game, 18-16, where Pittsburgh kicked six field goals.

The other 8 games? All were won by the favorites, and all were won by at least 13 points. That matched the number of times the favorite won by over 10 points in the three previous years combined.

Since 1990, the favorites have won 7.6 of 11 games, on average, in the postseason. With 9 wins by favorites in 2016, that matches the most times the favorite has won in the playoffs, but it happened six other times, too. So 2016 wasn’t all that notable in that regard.

And since 1990, teams have won by over 10 points in just over half of all playoff games. With 8 such wins, that is the most ever, but it happened four other times, too (although not since 2002). But what makes the 2016 playoffs stand out is the combination of the two factors: 8 times the favorite won and won by over 10 points, compared to just 4.4 times on average. The only other time that happened was in 1996. [1]And 8 of the 10 times, the home team won, which is high, but also not particularly unusual (the home team won 6.8 games on average).

The table below shows the average results (from the perspective of the winning team) in every playoff year since 1990: [continue reading…]

References

References
1 And 8 of the 10 times, the home team won, which is high, but also not particularly unusual (the home team won 6.8 games on average).
{ 1 comment }

On Thursday, I looked at quarterbacks from 2016 who started at least 8 games and threw at least 150 passes. For those passers, I calculated how many standard deviations above average they were in Relative ANY/A (i.e., how much better they were, statistically, than average) and in winning percentage. I sorted the list by the difference between the two, to find the quarterbacks whose stats and winning percentages diverged by the largest amounts. And yesterday, I looked at the quarterbacks whose passing stats most greatly exceeded their winning percentage in any given season.

Today, the reverse: the quarterbacks whose winning percentages were much more impressive than their passing numbers. And the 1973 season had by Terry Bradshaw stands out as the most extreme example. In ’73, Bradshaw went 8-1, despite passing stats that were bad even by 1973 standards: he threw 10 TDs, 15 interceptions, and averaged just 4.89 NY/A. Bradshaw ranked 21st in ANY/A at just 2.56 out of 24 qualifying passers. [continue reading…]

{ 14 comments }