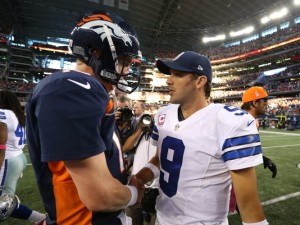
by Chase Stuart
on April 5, 2017

This photo probably has one HOF QB
Yesterday,
Tony Romo announced that he was retiring from football after an excellent career with the Cowboys. Now here are two interesting questions: will he be a Hall of Famer? And should he be a Hall of Famer?
Regular readers will recall that in 2014, I looked at how Eli Manning’s stats compared to other Hall of Fame passers. I used a quick-and-dirty method to measure quarterback dominance, reprinted below.
- Step 1) Calculate each quarterback’s Adjusted Net Yards per Attempt (ANY/A) for each season of his career where he had enough pass attempts to qualify for the passing title (14 attempts per team game). ANY/A, of course, is calculated as follows: (Passing Yards + PassTDs * 20 – INTs * 45 – Sack Yards Lost) / (Pass Attempts + Sacks).
- Step 2) For each quarterback, award him 10 points if he led the league in ANY/A, 9 points if he finished 2nd, 8 points if he finished 3rd, … and 1 point if he finished 10th. A quarterback receives 0 points if he does not finish in the top 10 in ANY/A or does not have enough pass attempts to qualify. This is biased in favor of older quarterbacks to the extent he is playing in a smaller league. For example, Charlie Conerly
- Step 3) For each quarterback, add his “points” from each season to produce a career grade.
[continue reading…]
Tagged as:
Tony Romo
{ }
by Chase Stuart
on December 15, 2013

The Cowboys have allowed a lot of yards this year.
Dallas has been out-gained by 1,280 yards this season, the worst margin in the NFL. But with a 7-6 record, the Cowboys are hardly considered a bad team. So how can we reconcile these two facts?
In general, gaining yards and preventing opponents from gaining yards are correlated with success. The other teams in the bottom five in yards margin (the Jaguars, Vikings, Bucs, and Rams) are a combined 16-35-1, while the top three teams in yards margin are 32-8 (the Broncos, Saints, and Seahawks). On the other hand, as a statistic, “yards” is a flawed measure of team success. So let’s begin our investigation with a threshold question:
1) Are the Cowboys a bad team with a good record, or a good team with a bad yardage differential?
[continue reading…]
Tagged as:
Cowboys,
Tony Romo
{ }
by Chase Stuart
on September 5, 2012

The third and fourth most popular quarterbacks in New York this week.
There are few nights as precious as tonight, the official start of the 2012 regular season. Even after tonight, 255 regular season games remain for us to enjoy. As usual, the defending Super Bowl champion hosts the opening game, and it didn’t take the NFL schedule makers long to decide on an opponent. This will be the 6th time in 8 meetings that the Giants and Cowboys will meet on primetime television. And as usual, the media will turn this game into another referendum on
Tony Romo and
Eli Manning.
Public perception says that Manning is the better quarterback, based largely exclusively on his post-season success and reputation as a clutch quarterback. And there’s a good reason he has such a reputation: Manning has won 8 of his last 9 playoff games and tied NFL single-season records with seven 4th-quarter comebacks and eight game-winning drives in 2011. Romo has a reputation as the chokiest of chokers, is 1-3 in playoff games, and has been less stellar than Manning late in games. While Manning has 21 career 4th quarter comebacks and is 21-22 in games where he had an opportunity for a 4th quarter comeback, Romo is just 13-20 in 4th quarter comeback opportunities. But let’s leave that to the side for now.
Because based on their regular season statistics, Romo absolutely crushes Manning, at least statistically. The gap shrunk significantly in 2011, but Romo’s track record of production and efficiently is considerably more impressive. Manning entered the league in 2004 but struggled his first three years; Romo first started in 2006 and was above average immediately. But let’s just focus on the past five seasons. The table below displays the statistics each quarterback produced from 2007 to 2011. Note that since Romo has missed time due to injury, I have added a third row, which pro-rates Romo’s numbers to 80 starts:
[continue reading…]
Tagged as:
Cowboys,
Eli Manning,
Giants,
NFC East,
Tony Romo
{ }
by Chase Stuart
on July 4, 2012
Happy 4th of July! Before you head to your barbecue, I’d recommend you take a look at the incredible document our founders signed 236 years ago.
As far as football goes, today’s a good time for a data dump. The table below shows the career passing leaders for each franchise, organized by when the current leader last played for that team.
[continue reading…]
Tagged as:
Ben Roethlisberger,
Eli Manning,
Jay Cutler,
John Elway,
Mark Sanchez,
Matt Stafford,
Mike Vick,
Peyton Manning,
Robert Griffin III,
Sam Bradford,
Tim Tebow,
Tony Romo
{ }


