≡ Menu

The 2013 Game Scripts record was broken not once but twice in week eight. In an unsurprising turn, the 49ers obliterated the Jaguars in London 42-10, holding an average lead of 21.3 points, breaking the largest average margin previously held by… Seattle against Jacksonville. But it was the Bengals demolition of the Jets in Cincinnati that set the new Game Scripts record.

The Bengals took a 14-0 lead with 4:26 left in the first quarter; by halftime, the score was 28-6. The first play from scrimmage in the second half was an interception of a Geno Smith pass that was returned for a touchdown by Chris Crocker, and Marvin Jones’ fourth touchdown reception of the day brought the Bengals lead to 42-9 before the end of the third quarter. The final score of the game was another pick six of Smith, this time by Adam Jones, at the start of the fourth quarter. The game was every bit as ugly as this paragraph makes it sound. For the record, both San Francisco and Cincinnati had Moral Margins of Victory of over 30 points, which puts them in the top five for the season.

Last week, the Patriots were the only team with a positive Game Script to lose; this week, New England is one of just two teams with a negative Game Script to win. That game was a pretty weird one: New England rushed on 37 of the team’s 59 plays from scrimmage against Miami. The Patriots threw just 22 passes, the lowest by New England in a game since a extremely windy week 17 visit to Buffalo in 2008. For Tom Brady, this was the fewest attempts in a game for him — excluding games where he was injured or meaningless games where he was benched — since 2005. And this came in a game where the Patriots had a negative Game Script! Brady and the passing game are really struggling — the Patriots rank 31st(!) in Net Yards per Attempt — but it’s still just weird to see New England be so run heavy. Then again, the Patriots had 100 net passing yards on 25 dropbacks against the Dolphins, while Stevan Ridley and LeGarrette Blount had 125 yards on 25 carries.

Below are the week 8 Game Scripts:
[continue reading…]

{ 2 comments }

New York Times: Post-Week 8, 2013

It’s mid-season awards time at the New York Times!

OFFENSIVE PLAYER OF THE FIRST HALF (NON-QB EDITION) Jamaal Charles, Kansas City Chiefs. Honorable mention: LeSean McCoy, Jimmy Graham, Calvin Johnson.

No offense is as dependent on one player as the Chiefs are on Charles. He leads the league in carries on first-and-10 and has produced a higher percentage of his team’s offensive yards than anybody else. He has scored eight of the Chiefs’ 16 offensive touchdowns and gained at least 100 yards from scrimmage and scored a touchdown in each of his first seven games, making him the second N.F.L. player to do so (O. J. Simpson, 1975). In Week 8, he did not score, but picked up 120 yards in a victory over Cleveland.

DEFENSIVE PLAYER J. J. Watt, Houston Texans. Honorable mention: Richard Sherman, Robert Mathis, Justin Houston.

Watt had one of the N.F.L.’s best defensive seasons in 2012. He has been nearly as productive this year despite not capturing headlines. According to Football Outsiders, he has eight tackles for loss on running plays in seven games (and five more tackles for no yards); this time last year he had nine tackles for loss and four more on runs for zero yards. His sack totals are down this year — although 4.5 is respectable for a 3-4 defensive end — but Football Outsiders credits him with 12 hits on quarterbacks (not including sacks), compared with six at this point in 2012.

OFFENSIVE COORDINATOR Ken Whisenhunt, San Diego Chargers. Honorable mention: Adam Gase, Jay Gruden.

Coach Mike McCoy and the offensive coordinator Whisenhunt have revived the career of quarterback Philip Rivers. Before the team’s Week 8 bye, San Diego ranked second in points per drive and trailed only Denver in first downs per game. Rivers has completed a league-leading 73.9 percent of his passes. More impressive is that the San Diego offense has endured key injuries and succeeded with castoffs. Running back Danny Woodhead (a former Jet and Patriot) has 40 receptions, and the former Broncos receiver Eddie Royal has six touchdowns, easing the loss of the starting wide receivers Danario Alexander and Malcom Floyd.

DEFENSIVE COORDINATOR Bob Sutton, Chiefs. Honorable mention: Rob Ryan, Dan Quinn.

The Chiefs (8-0) lead the league in points allowed (12.2 per game), third-down conversion rate (25 percent) and sacks (36). They are the first team since the 1977 Falcons to hold each of their first eight opponents to 17 or fewer points. This is Sutton’s first year in Kansas City after more than a decade with the Jets; in 2012, without Sutton, the Chiefs finished 25th in points allowed and last in passer rating allowed.

You can read the full article here.

{ 9 comments }

Cowboys defense know the back of their hands like the back of Megatron's jersey

Cowboys defenders know the back of their hands like the back of Megatron's jersey.

On Sunday, 
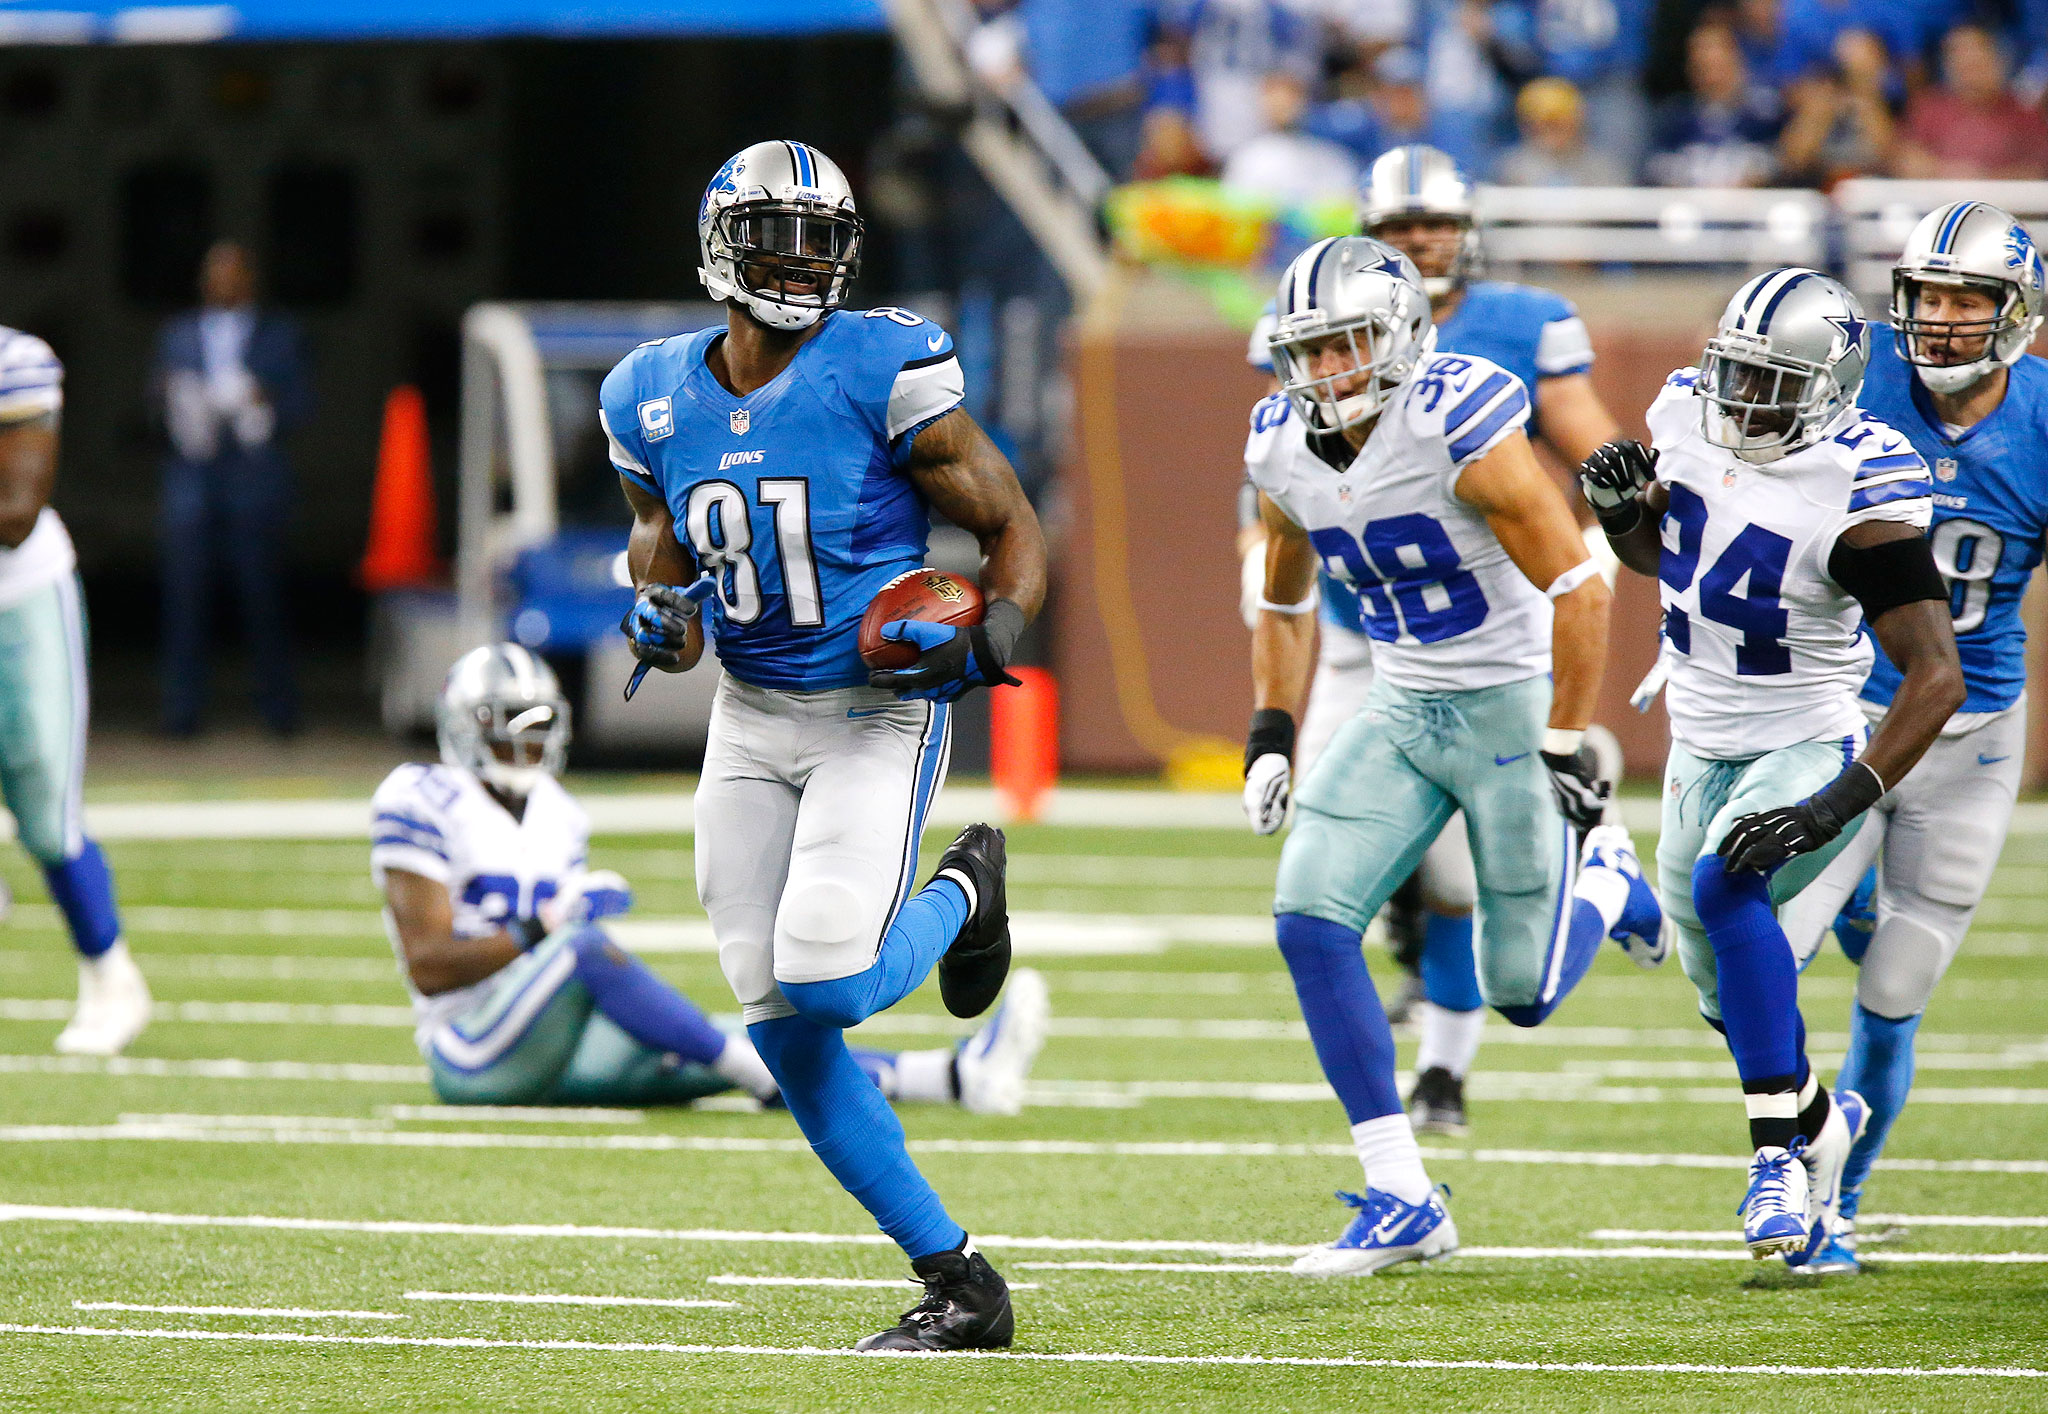
Calvin Johnson picked up 329 receiving yards against the Cowboys, the second most receiving yards in a single game after Flipper Anderson’s 336 yards in 1989 against the Saints. But when I think of the greatest games by a receiver of all time, my mind instantly goes to a performance by Kansas City’s Stephone Paige in a game in December 1985 against the Chargers. Regular readers will recall that this summer, Neil Paine and I developed a statistic known as True Receiving Yards. You can see a list of the leaders in TRY since 1950 here, but today I want to apply that same methodology on the single-game level. After crunching the numbers, Paige comes in at #2, Megatron’s performance comes in at #11, and Anderson is all the way down at #26. Why? How? Glad you asked. And I’ll keep the top spot a secret for now, in case anyone wants to guess.

1) First, we convert receiving yards into Adjusted Catch Yards by giving a five-yard bonus for receptions and a 20-yard bonus for touchdowns. Johnson had 419 ACY against the Cowboys, tied with Jerry Rice (against the ’95 Vikings) for the third highest mark since 1960.  The top spot belongs to Anderson at 431 (and personal favorite Jimmy Smith holds the number two spot for his performance against the 2000 Ravens). Paige — who produced an 8-309-2 stat line — totaled 389 Adjusted Catch Yards.

2) Next, we convert back to receiving yards by multiplying each receiver’s ACY by the league average ratio of receiving yards to Adjusted Catch Yards in that season. The point of using ACY instead of receiving yards is to include things other than receiving yards, but we still want to convert back into receiving yards. In 1985, the ACY/RecYd ratio was 0.66, in ’89 it was 0.66, and through eight weeks, that number is 0.65 in 2013, so not much is changing here. After step two, Anderson is at 286.6 receiving yards, Johnson 270.9 yards, and Paige 258.0 yards.

3) The third step is the pass attempts adjustment. The league average team team this year has averaged 38.7 attempts (including sacks) in 2013, while Matthew Stafford had 49 dropbacks yesterday. This means the Lions passed 26.6% more often than the average team. So what sort of adjustment do we make? In True Receiving Yards version 2.0, we split that number in half. I tried that here, and honestly, the numbers just didn’t look right — the top of the list was almost exclusively players on teams that had 10 or 12 pass attempts in that game. So instead of contracting the difference between pass attempts and league average pass attempts by two, I’m going to do it by three. So Johnson only gets downgraded to 91.1% of his production, or 246.9 yards.

Anderson’s record-breaking performance came in overtime in a game the Rams trailed by 14 entering the fourth quarter. As a result, Jim Everett had 57 dropbacks in a time period when 34.5 attempts was the norm.  So with Los Angeles having 65.3% more attempts than the average team that year, we have to lower Anderson from 286.6 to 224.1.

Paige, meanwhile, goes far in the other direction. The Chiefs took a 35-3 second quarter lead that day — in no small part due to Paige’s touchdown receptions of 56 and 84 yards — so Kansas City was limited to just 24 dropbacks. The average number of dropbacks in ’85 was 35.1, putting the Chiefs at just 68.4% of league average. Therefore, we bump up Paige by 15.4%, vaulting him from 258 yards to 297.9.

4) The final adjustment is the era adjustment. I’m going to use a different way to incorporate era adjustments here, because while passing yards have shot through the roof, the value of a team’s #1 wide receiver has been much less volatile. So I used the following baseline for each year: the number of Adjusted Catch Yards in the Nth best receiving game, when 2N = the number of team games in that season. So in modern times, with 512 games, this means the 256th highest ACY total in that season is the baseline; in 2011 and 2012, that was 135 Adjusted Catch Yards. From 1960 to 2012, the average was 124.3. [1]Note: I was lazy, and combined the AFL and NFL. I know, I know.

So what we do now is multiply each receiver’s score from step three by the baseline for that year, and divide by 124.3. I will use the same 135 as the baseline for 2013, which brings Megatron to 227. The baseline in ’89 was 130, so Anderson goes to 214.3, and in ’85, the baseline was 125, so Paige only drops to 296.2.

If you’ve made it this far, then maybe I’m not a complete idiot for putting the fine print up front. Without further ado, here are the top 250 [2]Note. I excluded two games during the 1987 strike played with replacement players: Anthony Allen had 262 TRY against the Cardinals, and Steve Largent had 260 TRY in Detroit. performances since 1960 using this formula:
[continue reading…]

References

References
1 Note: I was lazy, and combined the AFL and NFL. I know, I know.
2 Note. I excluded two games during the 1987 strike played with replacement players: Anthony Allen had 262 TRY against the Cardinals, and Steve Largent had 260 TRY in Detroit.
{ 7 comments }

Moral Margin of Victory

Debating whether Moral Margin of Victory is the most superior model ever devised

Our Moral Margin of Victory is what's important, Bill.

Suppose you watch an entire football game. Your job is to put a single number on the degree to which the winning team beat the losing team. Qualitatively, the scale runs from “had any number of things gone differently at the end, the winning team would have lost” to “the winning team was in control for most of the game” to “this game was never in question.”

I want to quantify that qualitative scale. And I want to do it in a retrodictive way. In other words, I’m not as interested in the degree to which the winning team outplayed the losing team as I am in the degree to which the winning team was in control of the game. To see the difference, imagine a game where one team opens up a 14-0 lead on a kickoff return touchdown and a fluke turnover that leads to a score, then cruises to an uneventful 31-17 win. The advanced stats might even show that the losing team was more efficient. The predictive measures might give the losing team a better grade, because the reasons the winning team won were not things that are likely to carry over to future games. I don’t care about any of that. The kick return happened, and the turnover happened, and the result was that the game was never in any serious doubt.

The easiest way to do this is to use margin of victory, and that works well in most cases, but there are obvious outliers. Consider the Green Bay – Washington game from week two, which was 24-0 midway through the second quarter and never really got any closer, and the Colts-49ers game, which was a one-score game with five minutes remaining. The latter game finished with a larger margin of victory. Again, if you’re interested in predictive measures, you probably do want to record that Robert Griffin III was able to generate a couple of late TDs and that the Colts were able to put away the 49ers so quickly and thoroughly. But I’m not interested in that here.

Another natural answer would be to use Chase’s game scripts. Or, if you wanted to fancy up the same concept, you could compute the average win probability throughout the game. This too would work in the majority of cases, but not always. If a game is tied with two minutes left, that’s really all I need to know: the game should be graded as “could’ve gone either way.” But game scripts (or average WP) would be sensitive to how the game progressed for its first 58 minutes. Whether one team went up 21-0 and then the other team came back to tie it, or the game was a seesaw affair, all that really matters that the game was still very much in question at the end.

In 2008, I borrowed an idea that the great Matt Hinton called Time of Knockout. Chase later refined the idea with these two posts. Those were a couple more attempts to get at what I’m trying to get at above. These are fun, but they are flawed in ways similar to margin of victory and game script. The comments to Chase’s posts contain a lot of the ideas in the discussion above.

Now I’m going to tell you my answer. Then you’ll use the comments to tell me how to improve it. [continue reading…]

{ 31 comments }

Shaw helped USC win the Battle of The Columbias Trophy. Yes, that is a real thing.

Shaw helped USC win the Battle of The Columbias Trophy. Yes, that is a real thing.

Last week, five teams emerged as the upper crust of college football. That number has dropped to four, after Missouri lost to South Carolina in typical heartbreaking style. The Tigers led 17-0 entering the fourth quarter, but that was before USC starting quarterback Connor Shaw — who had been held out due to injury — was inserted into the game. Shaw led the Gamecocks on a furious comeback to force overtime. After MIZZOU scored a touchdown on the first possession, Shaw threw his third touchdown pass on 4th-and-goal from the 16 yard line. On the second possession, USC was up first and kicked a field goal. Missouri looked to match South Carolina, but a 24-yard field goal bounced off the left upright, giving Tigers fans the gut punch loss of the season.

Elsewhere, most things went according to plan. Johnny Manziel played like a Heisman Trophy winner (25/35, 305 yards, 4 TDs, 1 INT), while Teddy Bridgewater (25/29, 344, 3, 0), Bryce Petty (20/32, 430, 3/0), and Jameis Winston (16/26, 292, 3/1) continued their dominant seasons. A couple of embattled schools pulled off impressive wins over conference rivals: Michigan State won 42-3 against Illinois, while Texas continued to put September in the rear-view mirror by stomping TCU, 30-7.

Below are the SRS ratings through nine weeks. As a reminder, you can read about the methodology here. As always, thanks to Dr. Peter Wolfe for providing the final scores for every college football game.
[continue reading…]

{ 5 comments }

Requesting Feedback: Mid-season awards

Okay, Peyton Manning is the MVP through eight weeks (even though we’re still in week eight). Glad we cleared that up. But for my New York Times article this week, I’m going to naming some mid-season awards. And so I’m requesting feedback from you guys, as to both whom you would select for each award and any other categories you might consider creating. For now, I’ve got:

Most Valuable Player:

Offensive Player of the First Half (non-QB edition):

Defensive Player of the First Half:

Best Offensive Coordinator:

Best Defensive Coordinator:

Best Head Coach:

Breakout Player:

Offensive Rookie:

Defensive Rookie:

Comeback Player:

I’m also going to do a “worst of the year” awards section for each of these categories, probably to post on Tuesday (tomorrow we have a SUPER exciting guest post). If you want to throw in your nominees for those categories, you can do that here, too.

College football SRS ratings will come out later today.

{ 18 comments }

Trent Richardson and 400 carries

Richardson powers through for three yards

Richardson powers through for three yards.

Trent Richardson has been a frequent topic of discussion at Football Perspective. In about 14 months, I’ve written the following articles:

  • How often does the first running back selected in the draft become the best running back from his class? The field is always a better bet than one player: Only about 40% of the highest-drafted backs led their class in rushing yards as a rookie, with that number dropping to about 33% on a career basis. On the other hand, that’s better than the production of the first-drafted wide receiver.
  • In 2012, the field won, as both Doug Martin and Alfred Morris rushed for more yards than Richardson. I then tried to project the number of yards for all three players for 2013 based on their draft status and rookie production; as it turns out, draft status remained extremely important, and Richardson projected to average the most yards per game in year two out of that group (a projection that doesn’t look very good right now).
  • In July, I continued to voice my disdain for the use of yards per carry as the main statistic for running backs, when I argued that Richardson’s 3.6 average last year was not important. More specifically, I said if you loved Richardson as a prospect, his 3.6 YPC average in 2012 was not a reason to downgrade him (of course, if you didn’t like Richardson, that’s a different story). Richardson still received a huge percentage of Cleveland carries and had a strong success rate, and I argued that his low YPC was simply a function of a lack of big plays. For a more in-depth breakdown of his rookie season, Brendan Leister compiled a good film-room breakdown of some of Richardson’s mistakes in 2012. Leister noted that Richardson had some mental mistakes, which isn’t atypical of a rookie, and still fawned over the former Alabama star’s physical potential.
  • After the trade to Indianapolis, I wrote that Richardson’s ability as a pass blocker was tough to analyze, and advised you to view some of the numbers thrown around in support of Richardson with skepticism. Believe it or not, I still have thoughts on that trade that I just haven’t gotten around to finishing, so look for my hot take on the Richardson deal to be published in say, March.

In 75 carries with the Colts, Richardson is averaging just 3.0 yards per carry. Even though I find yards per carry overrated, there is a certain baseline level of production needed for every running back, and 3.0 falls well short of that number. For his career, Richardson now has 1,283 yards on 373 yards, a 3.44 YPC average. He’ll reach 400 career carries in a couple of weeks, so I thought it might be interesting to look at the YPC averages of all running backs after their first 400 carries.

We can’t measure that exactly through game logs, but what we can do is calculate the career YPC average of each running back after the game in which they hit 400 career carries. The table below shows that number for all running backs who entered the league in 1960 or later and is current through 2012. Let’s start with the top 50 running backs:
[continue reading…]

{ 6 comments }

The most accurate passer in football

The most accurate passer in football.

It’s Friday, so I thought it might be fun to play around with some stats.  Net Yards per Attempt is probably my favorite predictive statistic to measure quarterbacks, but there are some problems with even that metric.  One issue is that Net Yards per Attempt — which is simply yards per attempt but includes sacks data — is pretty sensitive to outliers.  A quarterback who consistently pieces together short passes with a high completion percentage can be pretty valuable, and may end up undervalued compared to some mad bombers.

There are a couple of ways to deal with this.  One is to use a different measure of central tendency than the average production per dropback; for example, we could look at the median yards gained per pass attempt (including sacks).  Another is to measure the standard deviation on all of a quarterback’s pass plays. I thought I’d compile the data on both and see what you guys found interesting.

No matter how you splice the data, Philip Rivers looks outstanding. After a couple of down years, Rivers is experiencing a career revival under new head coach Mike McCoy.  The Chargers no longer rely on a downfield passing attack (and with Vincent Jackson gone and Malcom Floyd on IR, that may be more out of necessity than design), but Rivers has found a Darren Sproles replacement in Danny Woodhead.  As a result, Rivers has completed an incredible 73.9% of his passes this season.

Rivers ranks 27th in average length of pass (or average depth of target), reflecting the shorter passing attack, but Tony Romo, Chad Henne, Matt Schaub, Sam Bradford, Matt Ryan, and Alex Smith have lower average distances and worse completion percentages (among other stats).  The Chargers star has also been great at avoiding sacks: he’s completing passes on 70.8% of his dropbacks this year, a stat I’m calling Adjusted completion percentage (A_Cmp% in the table). In the table below, I’ve listed each quarterback’s number of attempts and sacks, his Adjusted completion percentage, his Net Yards per Attempt, and his standard deviation on pass plays. Since standard deviation would be biased towards quarterbacks with higher averages, I’ve sorted the table by the Ratio of each quarterback’s standard deviation to his NY/A average. Finally, I’ve also displayed the median number of yards gained for each quarterback on each dropback. All data excludes last night’s Carolina-Tampa Bay game.
[continue reading…]

{ 1 comment }

RG3 led a game-winning drive in week 7

RG3 led a game-winning drive in week 7.

After a week six in which no team won with a negative Game Script, only the Jets won with a negative Game Script in week seven, and that was in overtime. Only two quarterbacks led fourth-quarter comebacks this week: Robert Griffin III and Thaddeus Lewis. Three more quarterbacks — Andy Dalton, Ben Roethlisberger, and Geno Smith — led game-winning drives in tie games, but in general, it was a pretty uneventful week for comebacks. Overall, it’s been a quit few weeks in the NFL when it comes to fourth quarter craziness: the largest deficit entering the 4th quarter by a winning team in weeks 5, 6, and 7 was just five points.

Just like last week, Alex Smith and the Chiefs pulled out a late win in a game with a near-even Game Script. None of the 13 other games this week (excluding Jets/Patriots, Chiefs/Texans, and noting that the Saints and Raiders had byes) had a Game Script of fewer than 2 points.
[continue reading…]

{ 6 comments }

New York Times: Post-Week 7, 2013

This week at the New York Times, I look at how the Chiefs have gone from worst to first:

The Chiefs have found success in an unusual way. In the modern N.F.L., the best teams tend to be the best passing teams, but Kansas City has managed to succeed with a mediocre passing attack thanks to a great defense, excellent field position, a dynamic offensive talent and an easy schedule.

Kansas City’s defense has been dominant, ranking first in both points allowed and passer rating allowed. Bob Sutton, a defensive coach with the Jets from 2000 to 2012, has done a remarkable job transforming a defense that struggled in 2012 into the league’s best in 2013.

Inside linebacker Derrick Johnson made the Pro Bowl in each of the past two seasons and has been strong again this season, but he is just the third best linebacker on the team, behind outside linebackers Justin Houston and Tamba Hali.

Houston has 10 sacks and 2 fumble recoveries. Hali has nine sacks and four forced fumbles, and he has returned an interception for a touchdown. Hali has 40 hurries, the most in the N.F.L., according to Pro Football Focus. No. 2 on that list? Houston, with 28.

Houston and Hali made the Pro Bowl last year, but they are reaching new heights this season in part because of a greatly improved defensive line. Dontari Poe, Tyson Jackson and Mike DeVito were question marks entering the season, but the three have produced remarkable results through seven weeks.

I also discuss how Alex Smith has the lowest average depth of pass this season, but still has a mediocre completion percentage:

Smith’s average pass has traveled just 6.23 yards past the line of scrimmage this year, the shortest of any passer. Quarterbacks who throw shorter passes tend to produce high completion percentages — Smith, who frequently checked down with San Francisco, too, completed 70.2 percent of his passes last year — but this season, Smith has completed only 58 percent of his passes with Kansas City.

You can read the full article here.

{ 0 comments }

The Legion of Boom Has Long-Term Effects

The Legion of Boom Has Long-Term Effects.

In week 1, the Seahawks beat the Panthers. In week two, the Panthers lost to the Bills.

In week 2, Seattle crushed San Francisco. In week three, the 49ers lost to Indianapolis.

In week 3, the Seahawks suffocated the Jaguars; in week four, Jacksonville lost to the Colts.

In week 4, Seattle won at Houston; in week five, Houston was embarrassed by the 49ers.

In week 5, the Seahawks played a tight game with Andrew Luck’s Colts, but lost 34-28. In week six, Indianapolis was upset in San Diego.

In week 6, Seattle defeated the Titans; in week seven, Tennessee lost against San Francisco.

As a result, NFL teams are 0-6 this year in games played the week after facing Seattle. Surely this is because of the physical style employed by the Seahawks, and not a quirky stat aided by the fact that four of those games came against the 49ers and Colts. Carolina nearly ended this streak before it began, but was too bruised up to prevent EJ Manuel from finding Steve Johnson alone in the end zone with six seconds left, giving the Bills a 24-23 win. And while at first glance, the Colts loss in San Diego is your classic let-down/look-ahead sandwich (after beating Seattle in week 5 and getting ready for the Peyton Manning return in week 7), the truth is, Indianapolis was just incapable of mustering the physical temerity necessary to beat the rugged Chargers.

Seattle beat the Cardinals in week seven, but the circumstances ensure that this streak will continue to be discussed. If Arizona loses to Atlanta in week eight, that would run the record to 0-7; if the Cardinals win, well, they had an extra three days of rest, so teams would still be winless in games on normal rest after playing the punishing Seahawks.

The “record” for worst record by teams after playing Team X the prior week is 1-13, with the ’97 Packers being Team X. The lone win came when the Vikings, after losing in Green Bay in week four, rebounded to overcome Ty Detmer and the Eagles in week five. You might think there’s something legitimate here — after all, the Packers had Brett Favre, Reggie White, and were the defending Super Bowl champions. Perhaps teams were so “up” to play Green Bay that they were very prone to let downs the following weeks. I’m not convinced.
[continue reading…]

{ 7 comments }

(I originally posted this at the S-R Blog, but I thought it would be very appropriate here as well.)

Just a quick hit of a post to let you know that tonight’s MNF matchup between the 0-6 Giants and the 1-4 Vikings is, in fact, the worst ever this late in the season by combined winning percentage:

game_idhomeWLTPFPAroadWLTPFPAyear_idweek_numgame_datecomb_wpctcomb_pt_diffwinner
201310210nygnyg060103209min1401251582013710/21/2013.091-12.6NULL
197512150sdgsdg1110148282nyj39022137819751312/15/1975.167-12.1sdg, 24-16
199411210otioti190147218nyg37017122019941211/21/1994.200-6.0nyg, 13-10
197211060nwenwe25092220clt160941451972811/6/1972.214-12.8clt, 24-17
197011020pitpit2407194cin150931561970711/2/1970.250-7.2pit, 21-10
198110190detdet240118126chi150891331981710/19/1981.250-4.3det, 48-17
199710200cltclt06088155buf3301221591997810/20/1997.250-8.7buf, 9-6
201211260phiphi370162252car28018424320121211/26/2012.250-7.5car, 30-22
200001030atlatl4110251351sfo41102664191999171/3/2000.267-8.4atl, 34-29
200512190ravrav490171253gnb310025525520051512/19/2005.269-3.2rav, 48-3
198310240crdcrd250137218nyg2501261561983810/24/1983.286-7.9tie (20-20)
201112120seasea570216246ram210014029620111412/12/2011.292-7.8sea, 30-13
201011290crdcrd370188292sfo37016021920101211/29/2010.300-8.2sfo, 27-6
200911160clecle17078209rav44020615420091011/16/2009.313-4.9rav, 16-0
198011240nornor0110181341ram74029422819801211/24/1980.318-4.3ram, 27-7
201112050jaxjax380138200sdg47024927520111312/5/2011.318-4.0sdg, 38-14
198312120tamtam2120212345gnb77039640719831512/12/1983.321-5.1gnb, 12-9
198711020daldal330135134nyg150991421987711/2/1987.333-3.5dal, 33-24
199910250pitpit33011793atl150741531999710/25/1999.333-4.6pit, 13-9
200211180ramram450194196chi27018223220021111/18/2002.333-2.9ram, 21-16
200511210gnbgnb270201184min45015422820051111/21/2005.333-3.2min, 20-17
200012040nwenwe390192253kan57028327420001412/4/2000.333-2.2nwe, 30-24
200412130otioti480231294kan48034132620041412/13/2004.333-2.0kan, 49-38
200712100atlatl390171272nor57026627920071412/10/2007.333-4.8nor, 34-14
199112090miamia760256275cin211021137419911512/9/1991.346-7.0mia, 37-13
197311260sfosfo370180232gnb35213819819731111/26/1973.350-5.6sfo, 20-6
197811130cincin190110184rai64019316419781111/13/1978.350-2.3rai, 34-21
200711260pitpit730269145mia010018327420071211/26/2007.350+1.7pit, 3-0
199311290cltclt370154233sdg46016419519931311/29/1993.350-5.5sdg, 31-0
198010270nyjnyj160114164mia430991441980810/27/1980.357-6.8nyj, 17-14
199710270miamia520143124chi0701011991997910/27/1997.357-5.6chi, 36-33
199811020phiphi16079162dal4301741151998911/2/1998.357-1.7dal, 34-0
201211050nornor250190216phi3401201552012911/5/2012.357-4.4nor, 28-13
198311070detdet450202188nyg26116621419831011/7/1983.361-1.9det, 15-9
199111250ramram380181256sfo56021815519911311/25/1991.364-0.5sfo, 33-10
199211300seasea110073218den74017520719921311/30/1992.364-8.0sea, 16-13
200812010htxhtx470252293jax47022424020081312/1/2008.364-2.6htx, 30-17
197111150sdgsdg350150179crd3501351491971911/15/1971.375-2.7sdg, 20-17
197910290atlatl350160181sea3501721811979910/29/1979.375-1.9sea, 31-28
200611130carcar440137163tam26010217320061011/13/2006.375-6.1car, 24-10
200711120seasea440167141sfo26010418620071011/12/2007.375-3.5sea, 24-0
201211120pitpit530191164kan17013324020121011/12/2012.375-5.0pit, 16-13
199010290pitpit340109128ram2401641731990810/29/1990.385-2.2pit, 41-10
201212170otioti490271386nyj67024530620121512/17/2012.385-6.8oti, 14-10
197012070otioti371177249cle56023623619701212/7/1970.386-3.3cle, 21-10
197711210waswas540126132gnb2708315219771011/21/1977.389-4.2was, 10-9
200311170sfosfo450202152pit36017621720031111/17/2003.389+0.5sfo, 30-14
201011220sdgsdg450239197den36020325220101111/22/2010.389-0.4sdg, 35-14
199410170denden140108146kan32090801994710/17/1994.400-2.8kan, 31-28
199911290sfosfo370163281gnb55019220919991211/29/1999.400-6.8gnb, 20-3

It is not, however, the worst by combined PPG margin. That honor belongs to this 1972 game between the 2-5 Patriots and the 1-6 Colts (Baltimore ended up winning 24-17):

game_idhomeWLTPFPAroadWLTPFPAyear_idweek_numgame_datecomb_wpctcomb_pt_diffwinner
197211060nwenwe25092220clt160941451972811/6/1972.214-12.8clt, 24-17
201310210nygnyg060103209min1401251582013710/21/2013.091-12.6NULL
197512150sdgsdg1110148282nyj39022137819751312/15/1975.167-12.1sdg, 24-16
199710200cltclt06088155buf3301221591997810/20/1997.250-8.7buf, 9-6
200001030atlatl4110251351sfo41102664191999171/3/2000.267-8.4atl, 34-29
201011290crdcrd370188292sfo37016021920101211/29/2010.300-8.2sfo, 27-6
199211300seasea110073218den74017520719921311/30/1992.364-8.0sea, 16-13
198310240crdcrd250137218nyg2501261561983810/24/1983.286-7.9tie (20-20)
201112120seasea570216246ram210014029620111412/12/2011.292-7.8sea, 30-13
201211260phiphi370162252car28018424320121211/26/2012.250-7.5car, 30-22
197011020pitpit2407194cin150931561970711/2/1970.250-7.2pit, 21-10
199112090miamia760256275cin211021137419911512/9/1991.346-7.0mia, 37-13
198010270nyjnyj160114164mia430991441980810/27/1980.357-6.8nyj, 17-14
201212170otioti490271386nyj67024530620121512/17/2012.385-6.8oti, 14-10
199911290sfosfo370163281gnb55019220919991211/29/1999.400-6.8gnb, 20-3
197910150nyjnyj240128174min3301071421979710/15/1979.417-6.8nyj, 14-7
200611130carcar440137163tam26010217320061011/13/2006.375-6.1car, 24-10
199411210otioti190147218nyg37017122019941211/21/1994.200-6.0nyg, 13-10
200611060seasea430149177rai250921482006911/6/2006.429-6.0sea, 16-0
199710270miamia520143124chi0701011991997910/27/1997.357-5.6chi, 36-33
197311260sfosfo370180232gnb35213819819731111/26/1973.350-5.6sfo, 20-6
199311290cltclt370154233sdg46016419519931311/29/1993.350-5.5sdg, 31-0
198312120tamtam2120212345gnb77039640719831512/12/1983.321-5.1gnb, 12-9
201211120pitpit530191164kan17013324020121011/12/2012.375-5.0pit, 16-13
200911160clecle17078209rav44020615420091011/16/2009.313-4.9rav, 16-0
200712100atlatl390171272nor57026627920071412/10/2007.333-4.8nor, 34-14
199910250pitpit33011793atl150741531999710/25/1999.333-4.6pit, 13-9
201211050nornor250190216phi3401201552012911/5/2012.357-4.4nor, 28-13
198110190detdet240118126chi150891331981710/19/1981.250-4.3det, 48-17
198011240nornor0110181341ram74029422819801211/24/1980.318-4.3ram, 27-7
197711210waswas540126132gnb2708315219771011/21/1977.389-4.2was, 10-9
199510230nwenwe15069160buf510136951995810/23/1995.500-4.2nwe, 27-14
200611270seasea640203219gnb46018525220061211/27/2006.500-4.2sea, 34-24
201112050jaxjax380138200sdg47024927520111312/5/2011.318-4.0sdg, 38-14
200412060seasea650239223dal47019328920041312/6/2004.455-3.6dal, 43-39
198711020daldal330135134nyg150991421987711/2/1987.333-3.5dal, 33-24
200711120seasea440167141sfo26010418620071011/12/2007.375-3.5sea, 24-0
199010220clecle24098139cin4201541531990710/22/1990.500-3.3cin, 34-13
201110310kankan330105150sdg4201411362011810/31/2011.583-3.3kan, 23-20
197811060cltclt360120230was72018613519781011/6/1978.556-3.3clt, 21-17
200711190denden450153238oti63017815220071111/19/2007.556-3.3den, 34-20
197012070otioti371177249cle56023623619701212/7/1970.386-3.3cle, 21-10
200511210gnbgnb270201184min45015422820051111/21/2005.333-3.2min, 20-17
200512190ravrav490171253gnb310025525520051512/19/2005.269-3.2rav, 48-3
200512120atlatl750277237nor39018329520051412/12/2005.417-3.0atl, 36-17
200211180ramram450194196chi27018223220021111/18/2002.333-2.9ram, 21-16
199410170denden140108146kan32090801994710/17/1994.400-2.8kan, 31-28
197211130sdgsdg251152203cle5301411341972911/13/1972.469-2.8cle, 21-17
197710310crdcrd330124122nyg330911261977710/31/1977.500-2.8crd, 28-0
200512260nyjnyj3110189298nwe95032228920051612/26/2005.429-2.7nwe, 31-21
{ 9 comments }

Famous Jameis

Famous Jameis.

Last week, Florida State topped the SRS ratings. And that was before the Seminoles posted the single best performance of the season, winning at Clemson 51-14 on Saturday Night. They scored an 85.5 in the SRS against the Tigers, so FSU now has the top two games of the season (the team’s 63-0 shutout against Maryland had been the previous SRS leader). Freshman phenom Jameis Winston threw for 444 yards and 3 touchdowns on just 34 passes, and is vaulting to the front of Heisman leaderboards. How impressive was the win? Even if you ignore margin of victory, simply winning at Clemson stands as the most impressive road win of the season. The Tigers have an SRS of 53.5, and no team with a higher SRS score has lost at home this season. And it would be a surprise if the Seminoles didn’t finish the season undefeated.

Four of FSU’s final six regular season games come against teams outside of the top 75 in the SRS. FSU is a 29-point favorite this weekend against NC State, and should be similar favorites against Wake Forest, Syracuse, and Idaho (well, that game should be off the board). The only real challenges the rest of the way come from in-state rivals Miami and Florida, but for now, FSU seems like the best team not just in Florida, but in the country.

Of course, nothing is guaranteed in college football, a reality several teams were painfully reminded of this weekend. Louisville and Heisman/2014 No. 1 overall draft pick favorite Teddy Bridgewater lost, at home, to a sneaky good Central Florida team. If UCF can beat Houston in two weeks, the American Athletic Conference is likely theirs, along with an automatic BCS berth. Through eight weeks, the AAC has just three teams in the top half of the 125 FBS teams, so Central Florida’s path to a BCS Bowl won’t feature too many road blocks.

The one loss for the Knights was out of conference to South Carolina, a team who fell on SEC Upset Weekend. Despite a good game (and one monster hit) out of Jadeveon Clowney, the Gamecocks lost on a last-second field goal at Tennessee, 23-21.

That was one of five intraconference upsets in the SEC this weekend. Georgia lost on the road against Vanderbilt 31-27, despite the Bulldogs entering the game as 6.5-point favorites. Missouri had a higher SRS rating than Florida, but was a three-point underdog in Columbia against the Gators. The Tigers outgained Florida 500-151, and Henry Josey led the way with 18 carries for 136 yards and a score. LSU was a 9.5-point favorite in Oxford, but Zach Mettenberger threw three interceptions and Ole Miss jumped out to a 17-0 lead. The Tigers came back to tie the game, but the Rebels hit a 41-yard field goal as time expired to steal the win.

Johnny Manziel went down with an injury against Auburn, but you wouldn’t know it from his stat line: 28/38 for 454 yards, 4 TDs, 18 carries for 48 yards, 1 TD. Manziel also threw two interceptions, and missed one series with an injury, which might have made the difference in a shootout. Aggie wideout Mike Evans, who is a Vincent Jackson clone, caught 11 passes for 287 yards and four touchdowns. But Auburn, which entered College Station as 12.5-point underdogs, ultimately scored last, pulling out a 45-41 win. Tigers quarterback Nick Marshall had a great game, too, throwing for 236 passing yards and two touchdowns on 23 pass attempts, while adding 100 yards and two scores on the ground.

Only one game went according to script in the SEC, which is a pretty good way of describing just about every Alabama game ever. The Crimson Tide defeated Arkansas 52-0, in typical ruthless fashion. A.J. McCarron was 15/21 for 180 yards and 3 touchdowns, Kenyan Drake had 104 yards and two scores on 8 carries, and T.J. Yeldon had 88 yards and a score on 12 carries. Backup Derrick Henry even ran for an 80-yard touchdown in the final minutes, just because.
[continue reading…]

{ 3 comments }

On Tuesday, I look at the quarterbacks who have thrown the most pick sixes. As a follow-up, I wondered: what’s the record for pick sixes by a defensive player against a quarterback? Rod Woodson is the career leader in interception return scores with twelve, but only two of those came against the same quarerback (Steve McNair, thirteen years apart). As it turns out, there have been at least three defensive players who have scored interception returns against the same quarterback.


The first of three pick sixes.

The first of three pick sixes.

1) Ronde Barber vs. Donovan McNabb

Perhaps the most famous play of Barber’s career was his 92-yard pick six to clinch the 2002 NFC Championship Game in Philadelphia. The Eagles, trailing by 10, had driven down to the Tampa Bay 10-yard line with just under four minutes left in the game.  But Barber fooled McNabb into an easy interception, and raced down the right sideline for the game-clinching score. That was the second turnover of the day for Barber, who forced a McNabb fumble on a sack in the third quarter.

In 2006, Barber took back two McNabb passes for touchdowns in a defensive battle in Tampa Bay. The first pick six produced the only points in the first half, while the second gave the Bucs a 17-0 lead. But McNabb responded with three touchdowns, with the final one coming on a 52-yard reception by Brian Westbrook with less than a minute remaining. That gave the Eagles a 21-20 lead, which would have held…. except Matt Bryant hit a 62-yard field goal as time expired to give Tampa Bay the win. Philadelphia won the total yards battle 506-196, marking just the fourth time a team gained over 500 yards, allowed fewer than 200 yards, and still lost.

2) Bobby Bell vs. Charley Johnson
[continue reading…]

{ 2 comments }

Is that Bayes?

Is that Bayes?

Peyton Manning is not a 51 touchdown per-season quarterback, but that doesn’t mean he won’t average the necessary 2.9 touchdowns per game over his final ten games this season to break Tom Brady’s touchdown record. Before the season, Footballguys.com projected Manning as a 2.38 passing touchdown per game player.  And while he has looked unstoppable thus far, with 22 touchdown throws in six games, Manning has been known to have great spurts before, too.  All quarterbacks have hot and cold streaks, Manning included.  From 2003 to 2012, after removing games where he sat late in the season, Manning averaged 2.17 passing touchdowns per game with a standard deviation of 1.31 touchdowns. [1]That was after removing week 17 of the ’04, ’05, ’07, ’08, and ’09 seasons, and week 16 of the ’05 and ’09 seasons, when Manning left early. Why did I pick the last ten years? I don’t … Continue reading  In the ’04 season, Manning threw at least 20 touchdowns in each of his trailing six game stretches from week 7 all the way through week 15, with a peak of 27 touchdowns in his prior six games in weeks 11 and 12.  Manning also threw 19 touchdowns in his last two full regular season games of 2010 and his first four games of 2011.  White-hot streaks happen, even to the best players, so we shouldn’t just assume that he’s now a 3.67 touchdown per game player.

On the other hand, it would be naive to assume that we should ignore the first six weeks of the season and continue to project Manning as a 2.38 touchdown per game player for the rest of the year.  The question becomes, how much do we base projection over the final 10 games on his preseason projection and how much do we base it on his 2013 results? In Part I, after four games, a regression model produced a projection of 2.56 touchdowns per game the rest of the year. But the problem with a regression analysis is that Manning is an extreme outlier among NFL quarterbacks; to project Manning, it would be best if we could limit ourselves to just quarterbacks named Manning Peyton Manning.

Before continuing, I want to give a special thanks to Danny Tuccitto, without whom this article wouldn’t be possible. Danny provided this great link and also spent a lot of time walking me through the process. To the extent I’ve mucked it up here, you should blame the student, not the teacher. But after walking through some models online, I realized that the best explanation about how to use Bayes Theorem for these purposes was on a sweet site called FootballPerspective.com. And the smartest person on that website had already laid out the blueprint.

In the comments to one of his great posts, Neil explained that we can calculate Manning’s odds using Bayes Theorem if we know four things:

His Bayesian prior mean (i.e., his historical average):

His Bayesian prior variance (the variance surrounding his historical average):

His observed mean:

His observed variance:

Let’s go through each of these:

1) Manning’s Bayesian prior mean: this is simply what we expected out of Manning before the season. I will use 2.38, since Footballguys is the gold standard of football projections in my admittedly biased opinion. But you can use any number you like, as I’ll provide the full formula at the end.
[continue reading…]

References

References
1 That was after removing week 17 of the ’04, ’05, ’07, ’08, and ’09 seasons, and week 16 of the ’05 and ’09 seasons, when Manning left early. Why did I pick the last ten years? I don’t know, but he won his first MVP in ’03, so that seemed like a useful starting point.
{ 9 comments }

A comforting image

A comforting image.

Last night, the Seattle Seahawks defeated the Arizona Cardinals, 34-22. At the start of the fourth quarter, the Cardinals trailed 31-13, and faced 4th-and-goal from the Seattle four-yard line. Bruce Arians elected to kick a 22-yard field goal in that situation, which cut the lead from 18 to 15 points. On opening night, John Harbaugh made a similar decision trailing by 18 on 4th-and-4, although there was only 5:33 remaining (making it even less acceptable) and the ball was not at the four, but at the twelve-yard line (making it more acceptable).

Kicking a field goal down by 18 this late in the game is a poor decision unless it’s fourth and impossible. Since 1940, do you know how many teams have kicked a field goal, when trailing by 18 or more points in the second half, and went on to win the game? THREE. The “They Are Who We Thought They Were” game, when Chicago kicked a 23-yard field goal down 20-0 midway through the third quarter. After that field goal, Mike Brown, Charles Tillman, and Devin Hester scored touchdowns for the Bears, which doesn’t seem like the best model to follow in the future since none of those players played offense.

In 1998, the Rams kicked a field goal in Buffalo to make it 28-13 in the third quarter, ultimately winning 34-33 on a touchdown run in the final seconds. And in 1996, in Bill Parcells’ return to the Meadowlands to face the Giants, Adam Vinatieri kicked a third-quarter field goal down 22-0, and then Terry Glenn, Dave Meggett (on a punt return), and Ben Coates scored fourth quarter touchdowns.

You know what hasn’t happened? A team kicking a field goal, down by 18 or more points in the fourth quarter, and going on to win the game. Including the two teams this year, 117 teams since 1940 have kicked a fourth quarter field goal when trailing by more than 17 points, and none of them have ever won. I know, trailing by 18, it’s so comforting to kick a field goal and think “hey look, all we need to do is stop them, score a touchdown, stop them again, score a touchdown, convert a two-point conversion, and then win in overtime.” But that’s never, ever happened before.
[continue reading…]

{ 8 comments }

The Patriots and Pythagoras

Rob Ryan was told there would be math.

Rob Ryan was told there would be math.

With the exception of a blowout win over Tampa Bay, each Patriots game this year has been in doubt until the final minute. Against Buffalo, Stephen Gostkowski hit the game-winning 35-yard field goal with nine seconds left. In week two, the Jets had the ball, trailing by three, with 56 seconds remaining at their own 29-yard line, but a Geno Smith interception ended the comeback attempt. The Falcons failed on 4th-and-7 from the Patriots 10-yard line, trailing by a touchdown, with 41 seconds remaining. And last week, Tom Brady had not one, not two, but three chances to win the game in the final three minutes; eventually, he hit Kenbrell Thompkins with 10 seconds left for the game-winning touchdown.

To be fair, the Patriots sole loss was a nail-biter, too: it wasn’t until Adam Jones intercepted a Tom Brady pass at the Bengals three-yard line with 26 seconds remaining that Cincinnati sealed the 13-6 win. Still, New England has “only” outscored its opponents by 28 points so far this year. That’s a pretty low number for a 5-1 team.

From 1920 to 2012, 222 teams started the season with a 5-1-0 record. In an odd bit of trivia, the only one of those teams with a negative points differential through six games was a Super Bowl champion: the 1976 Oakland Raiders, who were blown out by the Patriots in week four but finished the year 16-1 (including a controversial revenge victory against New England in the playoffs).

If we limit ourselves to just post-merger teams, there are 148 teams that started 5-1-0 prior to 2013. If we throw out the strike seasons, that leaves us with 139 teams. This is the part of the post where you’d expect the teams with the highest points differential to perform the best over the rest of the season, but that actually hasn’t been the case.
[continue reading…]

{ 3 comments }

Week 6 Game Scripts

I’ve posted the Game Scripts data following every week this season, but week six was the first week that no team won with a negative Game Script. That includes New England: even though Tom Brady led a late comeback, finding Kenbrell Thompkins in the back of the end zone to pull out a last-second win, the Patriots posted a Game Script score of +3.6. New England led 17-7 at halftime and for most of the second half; in fact, the Saints only held the lead for about seven minutes of game time. The third closest Game Script in week six comes courtesy of the Kansas City-Oakland matchup, which might surprise any of you who just saw the final 24-7 score. Of course, quirky games like that one is one of the reasons I came up with concept of Game Scripts.

The first score of the game was Terrelle Pryor’s 39-yard touchdown pass to Denarius Moore, with 8:47 left in the second quarter. This means for the first 21.2 minutes, the game was tied. Kansas City answered with a Jamaal Charles touchdown run with 1:12 left in the half, so the Raiders held a 7-point lead for 7.6 minutes. The Chiefs didn’t take their first lead of the game until Charles scored again with 2:07 left in the third, which means the game was tied for another 14.1 minutes. That score held for nearly 15 full minutes: Ryan Succop hit a short field goal with 2:13 left in the game. Pryor then threw a pick six with 1:45 left and the team down by 10, providing the final points in the 24-7 Kansas City victory.

All told, however, the game was tied for 35.3 minutes and the Raiders had a 7-point lead for 7.6 minutes, while the Chiefs led by 7 for 14.9 minutes, by 10 for 0.5 minutes, and by 17 for 1.7 minutes. That’s why the Game Script was just +1.4 for Kansas City, which is a much better reflection of how the game unfolded than the 24-7 final score. The table below shows the Game Scripts data for each contest in week six:
[continue reading…]

{ 10 comments }

New York Times: Post-Week 6, 2013

This week at the New York Times, I look at the hard-to-read Carolina Panthers. Carolina has won six of nine games since I declared them a sleeping giant. On the other hand, the team has a losing record this season and has beaten teams with a combined one victory. In other words, as tends to be the case, you see what you want to see when looking at the Panthers.

We will have to check back in three months for the final answer, but there are signs that the Carolina Panthers, a disappointment at 2-3, could become one of the N.F.L.’s breakout teams.

First, Coach Ron Rivera, quarterback Cam Newton and the Panthers will have to overcome a well-earned reputation as a group that cannot beat good teams; that cannot win close games in the fourth quarter; and that is too conservative on fourth down. As a rookie in 2011, Newton dazzled N.F.L. fans, but the Panthers finished 6-10. Carolina was 1-7 against teams that finished with a winning record, and the Panthers won once in nine tries when they had the ball and were trailing by one score in the fourth quarter.

The same issues cropped up last year. Carolina started 3-9, with an 0-7 record in games decided by 7 or fewer points and a 1-5 mark against teams that finished with a winning record. With the season effectively over at the three-quarters mark, the Panthers finished 4-0, ensuring that Rivera would be back for another season.

This season, the Panthers defeated the winless Giants, 38-0, in Week 3 and won in Minnesota against the 1-4 Vikings, 35-10, on Sunday. But the Panthers have blown two fourth-quarter leads. And after a loss to Arizona, Carolina was 5-15 since 2011 in games that were within one score entering the fourth quarter, the worst mark in the league.

But there is reason to be optimistic about the Panthers. Carolina has outscored its opponents by 41 points this season, the most by a 2-3 team since 1921. There has been a strong relationship between points differential and the future performance of 2-3 teams. Of all the 2-3 teams from 1990 to 2012, 11 have outscored opponents by 20 or more points, with an average points differential of 28.5. Over the rest of the season, those 11 teams won 64.9 percent of their games.

You can read the full article here.

{ 1 comment }

Most Pick Sixes Thrown in NFL History

To pick six, or not to pick six

To pick six, or not to pick six.

Three years ago to the day, I crunched the numbers to see which quarterbacks had thrown the most pick sixes thrown in NFL history. With three more years of data, a robust play-by-play database, and, ya know, Matt Schaub, I figured it was time for an update. In case you haven’t noticed, Schaub became the first player to ever throw pick sixes (picks six?) in four straight games, and then on Sunday, T.J. Yates got the Texans into the record books as Houston had an interception returned for a touchdown in five straight games. But I thought it would be fun to look at the career leaders in pick sixes (and remind you that I discussed the rising rate of interception scores in the offseason).

Nobody has exact pick six data available, but we can do a reasonably job of answering the question of who has had the most passes returned for touchdowns in league history. That’s because we have:

  • Scoring logs for all scores, showing all interceptions returned for a touchdown, dating back to 1940
  • Play-by-play logs for all players dating back to 1999. So we have all the information we need from that point through week six of the 2013 season.
  • Individual game logs for all players, showing all interceptions thrown dating back to 1960.

For all pick sixes thrown since 1999, we have the precise data.  For any game from 1960 to 1998, we can do a very good job approximating who threw the pick-six. Most of the time, only one quarterback will throw an interception in any given team game. Fifty years from now, if you look at this box score from week six, you will be able to know for sure that Peyton Manning threw the interception that Paul Posluszny returned for a touchdown. The Broncos threw just one interception, and it was by Manning, so Manning must have thrown the pick-six. It doesn’t matter if the team has thrown five interceptions, as long as all were thrown by the same guy, such as Keith Null against the Titans in 2009.

The problem games are the ones where multiple players, usually quarterbacks, threw interceptions. For example, the record for defensive interception returns for touchdowns in a game is four, set by the Seattle Seahawks in 1984 against Kansas City. If you look at the boxscore, you’ll see that Todd Blackledge threw three interceptions, Bill Kenney threw two, and Sandy Osiecki added a sixth. So what do we do? Award Blackledge 2 pick sixes, Kenney 1.33, and Osiecky 0.67; obviously this isn’t perfect, but over the course of a player’s career, I think this will work well as an approximation. Because I’m running low on time, I’m going to just ignore pre-1960 data, although you could piece it together at the old link since obviously nothing has changed.

The table below includes all players who threw at least five pick sixes since 1960. It includes all postseason data, and unsurprisingly, Brett Favre is the career leader. He threw 10,960 career passes (including the playoffs), so he only threw a pick six on 0.32% of his passes (the leader in that category is Chris Redman, who threw a pick six once every 100 passes). Favre threw 366 career interceptions (again, including the playoffs), so he threw a pick six on “only” 9.6% of his interceptions. If you’re curious, Aaron Rodgers has thrown just one pick six in his entire career. That gives him a rate 0.032 pick sixes per pass attempt, the lowest among all passes with 1500 attempts since 1960.
[continue reading…]

{ 9 comments }

Mariota and the Ducks continue to roll

Mariota and the Ducks continue to roll.

After seven weeks, the idle Seminoles remain atop the SRS Ratings. New readers can read the background about the Simple Rating System here, but the SRS simply takes margin of victory for each team (with some minor tweaks to minimize running up the score and to give credit for close wins) and adjusts that differential for strength of schedule. The top three comprises the same teams as last week, but following a big win in Washington, Oregon leapfrogged Baylor into the number two spot. Quarterback Marcus Mariota now has 17 passing touchdowns, eight rushing touchdowns, and zero interceptions. Among players with at least 150 pass attempts, he leads college football in Adjusted Yards per Attempt, with presumptive number one pick in the 2014 Draft — Louisville’s Teddy Bridgewater — three tenths of a yard behind him. (If you lower the threshold to 100 attempts, both Bryce Petty (Baylor) and Jameis Winston (Florida State) would vault Mariota.)

The 4-5-6 spots are occupied by SEC teams, with newcomer Missouri sandwiched next to SEC stalwarts Alabama and LSU. Missouri was identified as a sleeper in last week’s ratings — the Tigers actually ranked ahead of Georgia entering that game — and then pulled off one of the weekend’s big upsets by winning in Athens. But with Mizzou, the other shoe never waits very long to drop: quarterback James Franklin was injured against Georgia, and is out at least six weeks with a separated shoulder. The Tigers have averaged 45.7 points per game this year, so Missouri is very much a team built around its dynamic offense. It’s hard to imagine Missouri beating both Florida and South Carolina the next two weeks, even with both games coming at home. On the other hand, if the Tigers can do that, there’s a good chance they’ll enter the final game of the regular season with an undefeated record. That game comes against Johnny Manziel and former Big XII rival Texas A&M. If they get to that game, we’re going to just have to assume that this 2013 is Jason Lisk’s year and we’re all just living in it. His Chiefs and Tigers are a combined 12-0 right now, and none of that makes any sense.

There were two other “big upsets” this week among ranked teams. Number five Stanford lost in Utah, in a game that wasn’t as surprising as you might think. Last week, Stanford was “only” 11th and Utah was 30th in the SRS; in fact, the Cardinal only drop to #13 in the SRS this week, while the Utes jump up to #21. The other big upset was in the Red River Shootout, in a game that was hard to see coming. Texas lost to #36 (in the SRS) Ole Miss by 21 points at home earlier this year, so who saw them winning in Dallas against Oklahoma on Saturday? Right now, Baylor is the only team in the top 20 in the SRS from the Big 12, although the Bears had their own struggles against #40 KSU in week seven.

The #7 team in the SRS is Clemson, and the Tigers host Florida State next week in a matchup of two teams ranked in the top five (albeit not in the SRS). That looks to be one of the best games of the year, and is where College Gameday will be in week eight. That’s an 8PM kickoff, so plan accordingly. And now, the week seven SRS ratings. As always, this is an ever-evolving picture, but after seven weeks, you can begin to feel pretty confident in these ratings. As always, thanks to Dr. Peter Wolfe for providing the final scores for every college football game.
[continue reading…]

{ 1 comment }

Bayes Theorem and the New York Giants

Eli, after reading this post

Eli, after reading this post.

The New York Giants are now 0-6. There are many reasons for the team’s struggles: questionable drafting, injuries, Eli Manning interceptions, injuries, coaching mistakes by Tom Coughlin, and injuries. But let’s say you have a buddy who is convinced that the Giants are not that bad: in fact, he thinks New York is just a .500 team that has been really unlucky.

Your first inclination might be to stop being friends with this person, but after that, you might wonder: “Hey, how likely is it for a .500 team to start off 0-6?” This is the same (ignoring strength of schedule, the fact that games are not independent, and several other variables) as asking the question “how likely is a coin to land on heads six times in a row?” The answer to both questions is pretty simple: 0.500^6, or 1.56%. Using the binomial distribution (in Excel, this would involve typing =BINOM.DIST(0,6,0.5,TRUE) into a cell) — which assumes that the talent level of NFL teams is normally distributed, an assumption I will make throughout this post — would give you the same result of 1.56%.

That answer is simple, but it actually answers a different question. What you want to know is the likelihood that the Giants are actually a .500 or better team. It’s a minor but crucial distinction: what we just determined was the likelihood that, given the assumption that the Giants are a .500 team, that they would start 0-6. To address the question of how likely the 2013 Giants are actually a .500 (or better) team despite the 0-6 start, we need to use Bayes Theorem.

Much of the math involved in this process is frankly over my head, but fortunately, Kincaid over at 3-D baseball already did much of the work (and thanks to Neil for giving me that link). I will be blatantly copying his article (with the only changes being stylistic and making this for, you know, football), so make sure to give him all the credit he deserves. It’s a fantastic piece that has many useful applications.
[continue reading…]

{ 37 comments }

Jets, Falcons pull off rare feat

Is a left-arm-only Geno better than Sanchez?

Next on First Take: Is a left arm only Geno better than Sanchez?

Under Mark Sanchez, the Jets were never very good at completing passes, because of, well, Mark Sanchez. The Jets ranked 29th, 30th, 24th, and 30th from 2009 to 2012 in completion percentage. Over that four year period, no team completed fewer passes (1,080) or had a lower completion percentage (55.2%) than the Jets. But as bad as the Jets offense has been at completing passes, the defense was even more extreme at preventing completions. Over the last four full years, the top two single seasons in completion percentage allowed were recorded by the ’09 and ’10 Jets. The 2011 Jets ranked 4th in completion percentage allowed, while last year’s team ranked second. From 2009 to 2012, no team allowed fewer completions (1,069) or at a lower rate (52.6%) than the Jets. In fact, the 2nd best team at completion percentage allowed over that period, the Packers at 56.9%, were closer to the 18th best team in opponent’s completion percentage than they were to the Jets.

If you average the completion percentages of the Jets and their opponents over that four year period, you get an average completion percentage in Jets games of 53.8%, easily the lowest rate in the league (Arizona, Kansas City, and Oakland are next at 57.6, 57.7, and 57.7%).

Under Geno Smith and without Darrelle Revis, things hadn’t changed much.  Through four weeks, the Jets defense ranked — you guessed it, 1st in completion percentage allowed at 51.4%, while the Jets offense ranked 26th in completion percentage.

Switching gears for a second, only three games in NFL history had ever seen both teams complete 80% of their passes in a single game. What were the odds, then, that the 2013 Jets would be involved in the fourth such game? I have no idea, but I know they were really, really, really low. Yet on Monday Night against the Falcons, that’s exactly what happened.
[continue reading…]

{ 6 comments }

Atlanta has been passing like no other team again in 2013

Atlanta has been passing like no other team again in 2013.

I’ve been posting the Game Scripts numbers each week this season, and now have a full page dedicated to the results from every game at the top right of your screen. But the best use of Game Scripts is to adjust Pass ratios for teams to understand their true Passing Identity. Here’s how you do it.

1) Calculate how many standard deviations above/below average each team is in Game Scripts. The average Game Script, of course, is zero. The standard deviation through five weeks is 4.69, so the Broncos (8.43 Game Script) are 1.80 standard deviations above average in Game Script.

2) Calculate how many standard deviations from average each team is in Pass Ratio, defined as pass attempts (including sacks) divided by total plays. The average Pass Ratio through five weeks is 59.8%, while the standard deviation among the thirty-two teams is 6.7%. The Giants (excluding last night’s game) lead the league in Pass Ratio at 71.8%, which is 1.79 standard deviations above the league-average Pass Ratio.

3) Add how many standard deviations above/below average each team is in both Game Scripts and Pass Ratio. To convert these into an Index (and a more intuitive number for folks), multiply that result by 15 and add it to 100. So a team that has a Pass Identity that is 1 standard deviation above average will be at 115, while a team that is 1.6 standard deviations below average will be at 76.

Here are the results:
[continue reading…]

{ 4 comments }

The Game Script limited the need for Kaepernick to do much

The Game Script limited the need for Kaepernick to do much.

Every week this season, I’ve posted the Game Scripts and Average Field Position data from the prior week. For new readers, you can read the background and how to calculate Game Scripts here, but the Game Scripts number simply tells us the average points differential for a team throughout a game. There are 3600 seconds in a game that does not go to overtime, and he Game Script is the sum of the score at each of those 3600 seconds, divided by 3600.

This week, the 49ers’ blowout victory against Houston produced the highest Game Script at 18.3, putting it just a hair behind the Seahawks victory over Jacksonville (18.4) on the list of highest Game Scripts in 2013. (We’ll see if Denver/Jacksonville gets the Game Script over 20. The highest Game Script of all time was the Patriots 59-0 blowout in the snow against the Titans, clocking in at 33.7.) Colin Kaepernick completed six passes, but you don’t need to complete many passes when your team is leading by 18 points throughout the game. San Francisco went up 7-0 ninety seconds into the game following a Tramaine Brock pick six of Matt Schaub, and things stayed ugly from there. That reminds me: pick sixes continue to be up this year, an issue I discussed in the dead of March.

Without further ado, the Week 5 Game Scripts:
[continue reading…]

{ 5 comments }

New York Times: Post-Week 5, 2013

This week at the New York Times, I fawn over Andrew Luck:

Luck ranks fourth in ESPN’s Total QBR metric, which includes two of the hidden areas where Luck excels: rushing and third-down passing.

Luck has produced the most value on the ground of any quarterback in the league, according to Total QBR, slightly better than Michael Vick. Luck has scrambled on third down five times in five games, and he has picked up a first down each time. That doesn’t include a designed third-down run for a touchdown to ice the game in San Francisco.

Luck doesn’t run often — excluding kneel-downs, he has just 15 carries — but he makes the most of them with an average of 9.3 yards per carry. Against Oakland, his 19-yard touchdown on third-and-4 was the game winner.

Another reason for the Colts’ success: Luck has played at his best in the biggest situations. According to Albert Larcada from ESPN Stats and Information, Luck has played extremely well but in some under-the-radar ways on third down.

His third-down pass attempts have led to six defensive pass interference or defensive holding calls — those are ignored by traditional statistics but help a team just as much as a completion, and no other other quarterback has drawn more than four such penalties.

Luck has been sacked just once on 47 dropbacks on third down, another underrated quarterback skill. Add in Luck’s excellent play on third downs generally, and Lacarda says that Luck has a league-leading (and near-perfect) 97.6 QBR on third down. To put that in context, Peyton Manning is second at 90.2. As a team, Indianapolis has converted on 50 percent of its third downs, the second-highest rate in the league behind the Broncos (58.3).

You can read the full article here, which also includes some Geno Smith trivia.

{ 0 comments }

Jacksonville at Denver: A “Preview”

Through five weeks, the Jaguars have been the worst team in the league and the Broncos have been the best. One could also argue that these two teams are even more extreme than the typical worst/best teams in the league, and that Denver has a larger home field advantage than your typical team. In other words, this is as large of a mismatch as we could possibly create, which jives with the historically large points spread of 28 points.

The situation is only getting uglier in Jacksonville. Blaine Gabbert continues to look like one of the worst quarterbacks to ever start 25 games in NFL history, so perhaps it’s good news that a hamstring injury will force Chad Henne into the starting lineup. And a few days after trading left tackle Eugene Monroe, 2nd overall pick Luke Joeckel went down with fractured ankle and is now lost for the season. Meanwhile, Peyton Manning and the Broncos offense look unstoppable.

I thought it would be fun to look at other times where the best and worst teams played each other. I’m going to define “best” and “worst” as the first- and last-placed teams according to the Simple Rating System, which means we’re actually going to have the benefit of hindsight here (i.e., we’ll be looking at the best/worst teams from the entire season, not as of the time when those two teams played). Since 1970, the best and worst teams have faced each other a total of 21 times, with the best team owning a perfect record.

YearTeamOppBoxscoreQBOpp QBH/RspreadPFPAMarg
2011NORIND10/23/2011Drew BreesCurtis PainterHome-1462755
2005INDSFO10/09/2005Peyton ManningAlex SmithRoad-1428325
2004NWESFO01/02/2005Tom BradyKen DorseyHome-1321714
1999STLCLE10/24/1999Kurt WarnerTim CouchHome-18.534331
1997DENSDG12/21/1997John ElwayCraig WhelihanHome-1338335
1997DENSDG11/30/1997John ElwayCraig WhelihanRoad-8.5382810
1992SFONWE10/11/1992Steve YoungHugh MillenRoad-17.5241212
1990BUFNWE11/18/1990Jim KellyMarc WilsonHome-1514014
1990BUFNWE10/28/1990Jim KellySteve GroganRoad-6271017
1989SFODAL10/15/1989Steve YoungSteve WalshRoad-14.5311417
1987SFOATL10/11/1987Joe MontanaJeff Van RaaphorstRoad-2325178
1987SFOATL12/20/1987Steve YoungChris MillerHome-1635728
1981PHIBAL11/15/1981Ron JaworskiBert JonesHome-14381325
1980PHINOR11/09/1980Ron JaworskiArchie ManningRoad-9342113
1976PITTAM12/05/1976Mike KruczekTerry HanrattyHome-2642042
1973RAMHOU10/07/1973John HadlDan PastoriniRoad031265
1972MIANWE11/12/1972Earl MorrallJim PlunkettHome052052
1972MIANWE12/03/1972Earl MorrallJim PlunkettRoad0372116
1971BALBUF10/10/1971Earl MorrallDennis ShawRoad043043
1971BALBUF12/05/1971Johnny UnitasDennis ShawHome024024
1970MINBOS12/13/1970Bob LeeJoe KappRoad0351421

In the ten times the best team in the league hosted the worst team in the league, the average score was 36-4. In the eight of those games where we have a points spread, the best team was favored by an average of 16.2 points. Let’s walk down memory lane.

2011: Saints 62, Colts 7 – Boxscore

True to form, this game featured the highest Game Script of any game from the 2011 season. The Saints held an average lead of 29.5 points in a game unfortunately placed in prime time. NBC was hoping for stories about Peyton Manning going home to New Orleans; instead, we watched Curtis Painter’s Colts fall behind 28-0 in the game’s first 20 minutes. The loss dropped the Colts to 0-7, and Indianapolis would start 0-13 before finishing 2-14. After being forced to deal with a full season of non-elite quarterback play, the football gods provided Andrew Luck to the city of Indianapolis a few months later. The Saints went 13-3 in 2011, and Drew Brees set the record for passing yards in a season, en route to winning the AP Offensive Player of the Year award.
[continue reading…]

{ 21 comments }

A classic shootout

A classic shootout.

Peyton Manning and Tony Romo staged a classic yesterday afternoon in Dalllas. The Broncos won 51-48, and the two quarterbacks put up ridiculous stat lines. Manning went 33 of 42 for 414 yards, and threw four touchdowns and just one interception. He wasn’t sacked, giving him an impressive 10.69 ANY/A average (based on the formula “Passing Yards + 20 * TDs – 45 * INTs – Sack Yards lost” divided by “Sacks + Attempts”). Romo may have been better, completing 25 of 36 passes for 505 yards and 5 scores — along with one fateful interception, and four sacks for -36 yards. That’s an amazing 13.12 ANY/A average.

So far this year, the league average ANY/A is 6.00. Since Manning was at 10.69 over 42 dropbacks, we could say that he provided 197 adjusted net yards of value over average. Meanwhile, Romo produced 285 adjusted net yards of value (40 * 7.12), which means the two quarterbacks combined to produce over 481 yards of value over average. If the league average for the season remains at 6.00, that would make this the fourth best (era-adjusted) quarterback battle since the merger, although only the second best game involving Manning. The table below shows the top 100 quarterback performances in the same game from 1970 to 2012.

Here’s how to read the table: for the top game: In 1972, Joe Namath and Johnny Unitas played a classic. The fourth column provides the team names (listed as QB 1 vs. QB 2) and a hyperlink link to the actual boxscore. The fifth column shows the quarterback stats: Namath completed 15 of 28 passes for 496 yards, 6 touchdowns, and 1 interception, and had 1 sack for -6 yards; Unitas completed 26 of 45 for 376 yards, threw 2 touchdowns and no interceptions, and was sacked 6 times for -44 yards. Namath produced 441 adjusted net yards of value (using the formula from above), while Unitas produced 154 yards, giving the duo a total of 595 yards above average.
[continue reading…]

{ 33 comments }

Last week, the Baylor Bears came in at number one in the first edition of the 2013 SRS Ratings. But the Bears ranked #1 on the strength of blowouts against bad teams; how would Baylor fare against West Virginia, who upset Oklahoma State just one week ago?

Art Briles’ squad raced out to a 56-14 lead, eventually won 73-42, and have cemented themselves as the new cool kids in town. But that doesn’t mean Baylor remained atop the SRS ratings. No, after Florida State and Jameis Winston dismantled Maryland, the Seminoles now rank number one:
[continue reading…]

{ 1 comment }

It's been a magical month for the Broncos passing game

It's been a magical month for the Broncos passing game.

Sometimes, the simplest questions have the most complicated answers. Peyton Manning has thrown 16 touchdowns so far this season, putting him on pace for 64 touchdowns this year. Now, we can be reasonably sure that Manning’s true ability level — even with Wes Welker, Demaryius Thomas, Eric Decker, and Julius Thomas — isn’t four touchdowns per game. But he doesn’t need to keep up that pace to break Tom Brady’s single-season record of 50 touchdown passes: Manning “only” needs to averaged 2.92 touchdowns per game over the final 12 games. But to figure out his odds of averaging nearly three touchdowns per game, we need to figure out his true ability level. So how do we determine that number?

Even for a man who averages four touchdown throws per game over four games, averaging nearly three touchdowns per game going forward is still a tall order. Footballguys.com projected Manning to averaged 2.38 touchdowns per game this year. In 2012, he threw 37 touchdowns, an average of 2.31 touchdowns per game. From 2003 to 2012, excluding games [1]That was after removing week 17 of the ’04, ’05, ’07, ’08, and ’09 seasons, and week 16 of the ’05 and ’09 seasons, when Manning left early. Why did I pick the last ten years? I don’t … Continue reading he exited early, Manning averaged 2.17 touchdown passes per game. As a Colt, Manning averaged 1.92 touchdowns per game.

It doesn’t take any advanced math skills to figure out that Manning is likely to average somewhere between 2 and 4 touchdowns per game over the rest of the season. But that doesn’t help us very much: we need to be precise, since the threshold he needs to hit is 2.92 touchdowns per game. I’ll get to the more complicated math in Part II. For now, let’s look at some history.
[continue reading…]

References

References
1 That was after removing week 17 of the ’04, ’05, ’07, ’08, and ’09 seasons, and week 16 of the ’05 and ’09 seasons, when Manning left early. Why did I pick the last ten years? I don’t know, but he won his first MVP in ’03, so that seemed like a useful starting point.
{ 4 comments }
Previous Posts