≡ Menu

On Thursday, I looked at how the Patriots retooled their roster by using the 2015 Draft class. Yesterday, I showed that the Saints had a remarkable 2017 offseason, finding 7 starters in just one year.

If we do the same sort of analysis for the Chiefs, however, the results aren’t very interesting. There’s no one year that stands out for Kansas City; as you might suspect, the Chiefs have added a bunch of talent over the last three years, and were pretty good before then, too. Take a look at how much AV Kansas City added in each year to its 2018 roster, both via the draft (in black) and overall (in red): [continue reading…]

{ 0 comments }

Reid looks up at the scoreboard and sees more points

Tonight is one of the games of the year: the 9-1 Chiefs against the 9-1 Rams. This is perhaps the best regular season game, by record, since another primetime game featuring Andy Reid’s Chiefs back in 2013, when the 9-0 Chiefs traveled to Denver to face the 8-1 Broncos.

Back then, I wrote about the best regular season matchups ever. And I’ve also written about the worst regular season matchups ever. And to be clear, there’s no right or wrong way to identify the best or worst matchup ever, even if you just base things on record.

You can’t use just winning percentage, because it’s hard to compare teams who have played a different number of games (is a matchup of two 3-0 teams better than a matchup of two 9-1 teams? I don’t think so, but winning percentage says otherwise). One solution is to add 11 games of .500 football to each team; in other words, add 5.5 wins and 5.5 losses to each team. For the Chiefs and Rams, that would make both teams 14.5-6.5, which translates to an adjusted winning percentage for both Kansas City and Los Angeles of 0.690. A game between two 3-0 teams would have an average adjusted winning percentage of only 0.607, which is one reason why I like this formula.

So where does Rams/Chiefs rank? With all due respect to the classic 49ers/Browns games from 1948, I’m limiting today’s post to games since 1950. And tonight’s matchup is the 20th best game during that period. The table below shows the best matchups in the NFL since 1950. Each game is listed from the perspective of the winner, and displays each team’s each team’s adjusted winning percentage and the average of the two adjusted records. Finally, I’ve included a linkable boxscore to each game. [continue reading…]

{ 0 comments }


This week at the New York Times: the Kansas City Chiefs are making history, and invoking memories of a distant relative:

The 1970 Cincinnati Bengals have been widely credited with bringing the West Coast Offense to the N.F.L. The team’s head coach, Paul Brown, and offensive coordinator (and future San Francisco 49ers head coach) Bill Walsh were faced with a challenge, as quarterback Virgil Carter was a smart player with a weak arm. Under Walsh’s tutelage, the Bengals operated a short-passing game that was effective in those run-heavy days of the N.F.L. A year later, Carter led the N.F.L. in completion percentage.

But that 1970 Cincinnati team is famous for another reason: Of the 158 teams from 1970 to 2014 that started an N.F.L. season with a 1-5 record, it is the only one to make the playoffs. It actually began the season 1-6, before winning its final seven games to finish 8-6.

Now, 35 years later, the Kansas City Chiefs are poised to join them.

You can read the full article here.

{ 1 comment }

The Travis Kelce Post

Last year, Jeff Cumberland finished #2 in DVOA among all tight ends.  This really happened.  Of course, that required some digging, so I wrote the following about Cumberland in the 2014 Football Outsiders Almanac:

What’s going on here? How did Cumberland produce such strong numbers, and wind up second in DVOA among tight ends? Among the 52 tight ends with at least 20 targets, Cumberland ranked fifth in yards gained through the air (per reception) and seventh in yards gained after the catch (per reception). Incredibly, [Ladarius] Green ranked first in both of those metrics, but there’s generally an inverse relationship between those two statistics: you either catch passes downfield, or you gain a lot of yards after the catch, but rarely both. In fact, Green and Cumberland were the only two tight ends to rank in the top 15 in both categories, which underscores just how impressive Cumberland’s efficiency numbers were in 2013.

So is Cumberland coming off a sneaky strong season and about to break out? There’s no denying that his efficiency numbers were great, but sometimes, the best course of action is to take a step back and look at the bigger picture. In 2012, Cumberland finished second on the team with 53 targets. In the offseason, New York allowed Dustin Keller to head to Miami, but instead of handing the job to Cumberland, signed Kellen Winslow. As a result, Cumberland wound up seeing only 40 targets in 2013. If the Jets were as high on Cumberland as his numbers would suggest, he would have managed to pick up more than 2.5 targets per game in one of the league’s most anemic passing attacks. Then, New York drafted Jace Amaro in the second round of the 2014 draft. Efficiency numbers are fun to look at, but the revealed preference of the Jets organization would seem to trump those metrics. And it appears as though the organization views Cumberland as a role player and little more.

Cumberland split time with Winslow, and his low target numbers were a strong indicator that he was an average talent. [1]In his defense, Cumberland was tied for 11th in yards per route run, but that’s (1) still a far cry from #2 and (2) more a reflection of the weakness of the 2013 Jets supporting cast. Yards per target is not a good stat because it is not very sticky; yards per route run is quite a bit better.  After all, a route run is more the analog of a “pass attempt” than a target, so YPRR is really the receiver’s version of yards per attempt.

The next great tight end?

The next great tight end?

This year, as he did in 2013, and 2012, and nearly in 2011, Rob Gronkowski leads all tight ends in yards per route run. He is averaging 2.67 yards per route run on his 304 routes, and the only receivers with a higher yards per route run average on over 225 routes are Demaryius Thomas (2.77) and Jordy Nelson (2.84). In short, Gronkowski is the man.

But, assuming you read the title to this post, you know that today we want to focus not on Gronk, but on baby Gronk. Kansas City’s Travis Kelce is second among tight ends in yards per route run, with a 2.49 average over 218 snaps. Those are incredible numbers, and a reflection that Kelce is already one of the top playmaking tight ends in football.

The Chiefs star hase has 542 yards on 52 targets, and his 10.4 yards/target average is the best among all tight ends.  But remember, Y/T is not a good stat: Cumberland ranked 3rd last season in yards per target, with a 10.2 average. Cumberland’s issue was that he wasn’t targeted very much despite being on the field.  As a result, his yards/target average overstated his value. Let’s throw some math into this equation: in 2013, Gronkowski was targeted on 30% of his routes, the best rate among all tight ends; Cumberland was targeted on 16% of his routes, the 35th best rate among tight ends.

Kelce isn’t the best receiving tight end in football because he leads with a 10.4 yards/target average.  It’s not just about what you do per target, it’s how often you get targeted. As he did last year, Gronk leads all tight ends in targets per route run, as he has been targeted on 28% of his pass routes.  But Kelce ranks 4th — and just a hair behind Jimmy Graham for 3rd place [2]Jordan Reed is second. — in targets per route run! He’s not having a fluky season at all, or at least, not in the way Cumberland did. The Chiefs are throwing to Kelce very often when he’s running routes, which is a very good sign that he’s the real deal.

So why is Kelce “only” 6th in receiving yards among tight ends? Because he’s just 28th in pass routes run by tight ends this year. And that’s the real conundrum: he simply isn’t getting much playing time. For the 2013 Jets, Cumberland was on the field for more offensive plays than any Jets player other than the quarterback and offensive linemen. Kelce simply doesn’t get the same level of playing time, as he ranks 4th among non-OL/QBs for Chiefs offensive players in snaps.

The other problem for him is that Kansas City ranks just 31st in pass attempts this year, which is going to depress his raw totals. But the good news is his playing time is on the rise — he was on the field for 63 of 67 snaps in week 12 and 50/52 in week 11. He can’t do anything about how often the Chiefs pass, but in his case — unlike Cumberland’s — the organization seems to be buying into the numbers. Kelce’s been dominant on a per-route basis this year, and now, Kansas City keeps giving him more playing time. The next big question is whether he can maintain his level of production as a full time starter, but the hunch here is that he can. And hey, maybe we just identified the first undervalued fantasy player of 2015.

References

References
1 In his defense, Cumberland was tied for 11th in yards per route run, but that’s (1) still a far cry from #2 and (2) more a reflection of the weakness of the 2013 Jets supporting cast.
2 Jordan Reed is second.
{ 4 comments }

New York Times, Post Week-10 (2014): Kansas City Dominance

This week at the New York Times, a look at the surprisingly dominant Chiefs.

It was the most surprising result of the season. We just didn’t know it at the time.

In the summer, Las Vegas oddsmakers pegged the Kansas City Chiefs for eight wins this season. So in Week 1, when the Tennessee Titans visited Kansas City and won, 26-10, it was easy to acknowledge that it was going to be a down year for the team. After the loss, ESPN justifiably dropped Kansas City to 26th in its power rankings.

In Week 2, Kansas City lost a close game at Denver. Since then, the Chiefs are 6-1 and have outscored opponents by 89 points. They are tied with the Indianapolis Colts for the best point differential since Week 3, and no team has a better record over that period. The Chiefs’ 41-14 rout of the New England Patriots stands as perhaps the best performance by any team this season, and yet they continue to fly under the national radar. Is it still because of Week 1? The Titans have won only once since, and there is still no good explanation for the result. But there are a lot of reasons for Kansas City’s success.

You can read the full article here.

{ 0 comments }

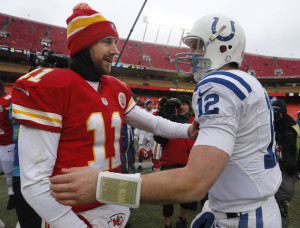
Superman wears #12 in Indianapolis now.

Superman wears #12 in Indianapolis now.

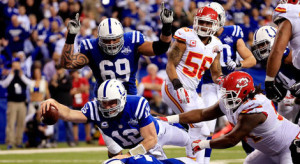
The NFL playoffs began in very entertaining fashion in Indianapolis. The Chiefs lost Jamaal Charles on the first drive of the game to a concussion, but stormed out to a 38-10 lead. Then the Colts pulled off the second greatest comeback in NFL history, eventually winning 45-44. The much-maligned Alex Smith had the game of his life, finishing 30 of 46 for 378 yards, with 4 touchdowns and no interceptions while also rushing for 57 yards.

Of course, Andrew Luck had an incredible game, too, even if it wasn’t necessarily as efficient. Luck went 29/45 for 443 yards and 4 touchdowns to counter his 3 interceptions, rushed for 45 yards, and recovered a Donald Brown fumble and ran it in for the touchdown.

Which made me wonder: where does this game rank among the greatest quarterback battles? To make life simpler, I’m only going to look at passing statistics, although obviously both players added some value on the ground. Smith averaged 9.23 Adjusted Net Yards per Attempt, defined as (Passing Yards + 20*TD – 45*INT – Sack Yards) divided by (Pass Attempts + Sacks). The NFL average in 2013 was 5.87 ANY/A, which means Smith produced 3.36 ANY/A over average. And, since he had 48 pass attempts (including sacks), that means Smith provided 161 yards over average.

Luck’s averages were hurt by the three interceptions, but he still produced 8.23 ANY/A and therefore 2.41 ANY/A over average. That means, over his 46 dropbacks, he produced 111 yards of value over average. So where does that mean this game ranks among all playoff games since 1970? My initial thought was to simply add the two value over average numbers, but that ended up producing a list dominated by great games by one quarterback. To counter this, I decided to only look at games where both quarterbacks were above average and to instead take the Harmonic Mean of their values. This wound up producing a pretty good list, and it places Luck/Smith at #9. [continue reading…]

{ 5 comments }

Kansas City Chiefs (11-5) (Pick’em) at Indianapolis Colts (13-3), Saturday 4:35PM ET

The Chiefs have the talent edge, but the Colts have one big advantage

The Chiefs have the talent edge, but the Colts have one big advantage.

Among the four games this weekend, this one figures to be the most competitive: I would be surprised if this isn’t a one possession game in the fourth quarter. The Colts rank 13th in Football Outsiders DVOA, courtesy of the 13th-ranked offense, the 16th-best defense, and the 17th best special teams. Kansas City is 7th overall, thanks to a 15th-place ranking on offense, a 9th-place ranking on defense, and the top special teams in the NFL. And while the Colts beat the Chiefs two weeks ago, I don’t put much stock in that for a couple of reasons.

One, the Chiefs were missing two key players, left tackle Branden Albert and pass rusher Justin Houston. Two, I suspect that Kansas City called a very vanilla game plan in the first meeting. The Chiefs knew that Indianapolis was the likely first round opponent in the playoffs, and a win would have been meaningless for Kansas City unless Denver would lose to either Houston or Oakland. In retrospect, had the Chiefs kept their cards close to the vest (a luxury the Colts couldn’t afford), it would have been wise. [continue reading…]

{ 2 comments }

New York Times: Post-Week 7, 2013

This week at the New York Times, I look at how the Chiefs have gone from worst to first:

The Chiefs have found success in an unusual way. In the modern N.F.L., the best teams tend to be the best passing teams, but Kansas City has managed to succeed with a mediocre passing attack thanks to a great defense, excellent field position, a dynamic offensive talent and an easy schedule.

Kansas City’s defense has been dominant, ranking first in both points allowed and passer rating allowed. Bob Sutton, a defensive coach with the Jets from 2000 to 2012, has done a remarkable job transforming a defense that struggled in 2012 into the league’s best in 2013.

Inside linebacker Derrick Johnson made the Pro Bowl in each of the past two seasons and has been strong again this season, but he is just the third best linebacker on the team, behind outside linebackers Justin Houston and Tamba Hali.

Houston has 10 sacks and 2 fumble recoveries. Hali has nine sacks and four forced fumbles, and he has returned an interception for a touchdown. Hali has 40 hurries, the most in the N.F.L., according to Pro Football Focus. No. 2 on that list? Houston, with 28.

Houston and Hali made the Pro Bowl last year, but they are reaching new heights this season in part because of a greatly improved defensive line. Dontari Poe, Tyson Jackson and Mike DeVito were question marks entering the season, but the three have produced remarkable results through seven weeks.

I also discuss how Alex Smith has the lowest average depth of pass this season, but still has a mediocre completion percentage:

Smith’s average pass has traveled just 6.23 yards past the line of scrimmage this year, the shortest of any passer. Quarterbacks who throw shorter passes tend to produce high completion percentages — Smith, who frequently checked down with San Francisco, too, completed 70.2 percent of his passes last year — but this season, Smith has completed only 58 percent of his passes with Kansas City.

You can read the full article here.

{ 0 comments }

How bad were the Chiefs last year?

  • Kansas City went 2-14, tied for the worst record in the league with Jacksonville. Since the Chiefs faced an easier schedule, they received the first pick.
  • With an Simple Rating System score of -14.0, Kansas City had the worst SRS rating in the league. They ranked 32nd in points scored and 25th in points allowed, leaving them 32nd in points differential. With a slightly easier than average schedule, that left them 32nd in the SRS, too.
  • The Chiefs ranked in the bottom three in both NY/A and NY/A allowed.
  • With a -24 turnover differential, K.C. tied several other teams, including the 2012 Eagles, for the third worst turnover differential since 1978.
  • Brian Burke ranked the Chiefs 31st overall, 31st on offense, and 31st on defense, just edging out the Jaguars (who ranked 32nd on offense and 30th on defense).
  • Kansas City finished 32nd in Aaron Schatz’s efficiency rankings, as Football Outsiders ranked them 31st on offense, 30th on defense, and 22nd on special teams.

[continue reading…]

{ 9 comments }

Season in review: AFC and NFC West

AFC East and NFC East Season in review
AFC North and NFC North Season in review
AFC North and NFC South Season in review

In the case of the AFC West, a picture can say a thousand words.

AFC West

Denver Broncos

Pre-season Projection: 8.5 wins
Maximum wins: 13 (after weeks 10 through 16)
Minimum wins: 9 (after weeks 3, 5 )
Week 1 comment: Watching Peyton Manning work his magic was a thing of beauty on Sunday night. The less John Fox touches this offense, the better, but I think everyone in Denver already knows that.

Once Peyton Manning proved that he was healthy and back, the AFC West race was effectively over. Officially, that happened in the week 6 comeback over the Chargers. That win only made them 3-3, but here is what I wrote then: According to Advanced NFL Stats, Denver is the best team in the league. Their remaining schedule is absurdly easy, so I’m going to perhaps prematurely give them a two-win bump. Their week 15 game in Baltimore may be for a bye, and I now think Denver is the favorite.

Kudos to Brian Burke’s model for correctly identifying how good the Broncos were early in the year. After week 9, I pegged Denver at 12 wins, and wrote: As a matter of principle, projecting a team to finish 7-1 is never advised. But this seems to be a good place to make an exception.

The next week, I bumped them to 13 wins, and never moved off that number. They got a late Christmas present from Manning’s old team, and now the AFC playoffs will have to go through Denver.

San Diego Chargers

Pre-season Projection: 9 wins
Maximum wins: 9 (after weeks 1, 2, and 4)
Minimum wins: 6 (after weeks 10 through 13, 16)
Week 1 comment: Unimpressive on Monday Night Football, but the schedule lines up for them to succeed. Philip Rivers is still elite, so expecting them to only go 8-7 the rest of the way is probably more of a knock on them than anything else. A healthy Ryan Mathews back will help.

The Chargers schedule was ridiculously easy, but they lost to the Browns, Saints, and Panthers, and couldn’t beat the Ravens, Bengals, or Bucs. The decline of Philip Rivers from elite quarterback to throw-it-out-of-bounds master is depressing, and it’s easy and probably appropriate to point the blame at the general manager. Going into 2013, San Diego will have a new head coach and GM, and we’ll see if that is what was needed to resurrect Rivers’ career.

It’s not easy to remember, but the Chargers were actually 3-1. At that point, I wrote: An unimpressive 3-1 team with a struggling offensive line. I really wanted to keep them at 8 wins, but their schedule is too easy and Philip Rivers — even in a down year — is good enough to lead them to a .500 record the rest of the way.

But by the time they were 3-4, I had already started with the “I can’t think of anything positive to say about the Chargers right now” comments. I summed up the Chargers season after week 13, when I wrote: This team started 2-0 but hasn’t beaten anyone but the Chiefs since then.

Of course, San Diego being San Diego, the Chargers did finish with 7 wins, but it was another disappointing season for the franchise. It’s hard to think back to September, but Vegas really did project the Chargers to win this division.
[continue reading…]

{ 4 comments }

The good Charles showed up against the Saints

The good Charles showed up against the Saints.

A couple of weeks ago, I heard my buddy and co-worker Sigmund Bloom say on the Footballguys Podcast that Jamaal Charles was having one of the craziest seasons ever. As Sigmund noted, Charles has been an incredibly frustrating fantasy player. This year, he had three games with 10 or fewer rushing yards… and he also became the first player in NFL history with two games with over 225 rushing yards in the same season.

Did you know that Kansas City finished 2012 fifth in carries? Under Todd Haley, Chiefs fans and fantasy football players were constantly frustrated by Thomas Jones, who Haley seemed to always find a way to give an extra ten carries to. This year, under Romeo Crennel, Peyton Hillis was the complementary back, but he was not nearly as predatory. Still, while Charles finally received the lion’s share of the carries, he was once again an inconsistent fantasy player.

Take a look at Charles’ weekly game logs:

G#DateOppResultAttYdsYPCTD
109/09/2012ATLL 24-4016875.440
209/16/2012@BUFL 17-35630.50
309/23/2012@NORW 27-24332337.061
409/30/2012SDGL 20-3717885.181
510/07/2012BALL 6-9301404.670
610/14/2012@TAML 10-3812403.330
710/28/2012OAKL 16-26540.80
811/01/2012@SDGL 13-3112393.250
911/12/2012@PITL 13-16231004.351
1011/18/2012CINL 6-2817875.120
1111/25/2012DENL 9-17231074.650
1212/02/2012CARW 27-21271274.70
1312/09/2012@CLEL 7-30181659.171
1412/16/2012@OAKL 0-159101.110
1512/23/2012INDL 13-202222610.271
1612/30/2012@DENW14533.790

That’s a pretty incredible distribution, but how crazy is it?

I looked at the standard deviation of every game by every player in a season with at least 1,000 rushing yards from 1960 to 2011. As it turns out, Charles has had one of the most inconsistent seasons ever. While he gained 1,509 rushing yards, he had a standard deviation of 71.4 yards. That may not mean anything to you in the abstract, but it would place him as the 4th most inconsistent back since 1960.
[continue reading…]

{ 0 comments }

Gonzalez has made 12 straight Pro Bowls.

Kansas City didn’t send an offensive player to the Pro Bowl last year, and the Chiefs didn’t do so in 2009, either. But that doesn’t stop them from leading all teams in offensive Pro Bowlers over the last decade. Surprised? It’s been awhile, but the Chiefs ranked first in either points or yards in 2002, 2003, 2004 and 2005. Kansas City sent 21 offensive players to the Pro Bowls in those seasons, but also delivered four Pro Bowlers in both 2006 and 2010.

The Chiefs could count on sending Tony Gonzalez to the Pro Bowl after every season, and guards Brian Waters and Will Shields each went to Hawaii five times. Kansas City sent three different running backs, two quarterbacks and a fullback to the Pro Bowl over the past decade.

The table below lists all 32 offensive Pro Bowl selections for the Chiefs since 2002. Note that this excludes WR Dante Hall who made two Pro Bowls as a returner.

On the other side of the ball, I doubt you’ll be surprised to hear which team has the most Pro Bowlers. The Baltimore Ravens have seen 33 defensive players make the Pro Bowl since 2002, and rank fourth in terms of overall Pro Bowlers. And surprised probably isn’t the right word to describe how most people would react when they see which team has the most Pro Bowlers over the last ten years:
[continue reading…]

{ 3 comments }