
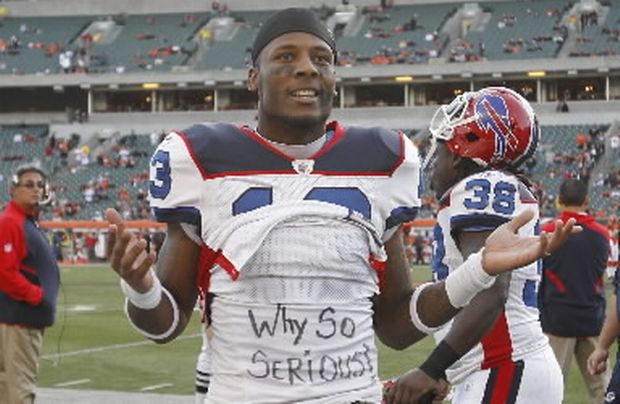
Johnson's target ratio is no joking matter.
Which view is correct? Fortunately for our analysis, Yards per Route Run can be broken down into two metrics: Yards per Target and Targets per Route Run. In other words, YPRR already incorporates Yards per Target, but it adjusts that statistic for Targets Per Route Run. This makes it very easy for us to compare the two statistics: essentially, the question boils down to how valuable it is to know a receiver’s number of Targets per Route Run.
For example, Kenny Stills had the most extreme breakdown of any player in the NFL in 2013. He was off-the-charts good in yards per target (13.9), but saw targets on just 9% of his routes run last year. As a result, Stills averaged just 1.29 yards per route run, a pretty unimpressive figure.
Steve Johnson was the anti-Stills. While Johnson had the worst year of his career since becoming a Bills starter, he still managed to pull down targets on 25% of his snaps. However, he averaged only 6.3 yards target, leaving Johnson with a poor 1.56 yards per route run average. Of course, when comparing Stills’ numbers to Johnson’s, one might note that Johnson was playing with EJ Manuel and Thaddeus Lewis while Stills was playing with Drew Brees, which provides some explanation for the drastic differences between the two receivers in yards per target. [1]I suppose one counter to that would be that Stills was competing with Jimmy Graham, Marques Colston, and the Saints obsession with throwing passes to running backs, while Johnson was competing with … Continue reading But putting the quarterbacks issue aside, the question today is a more global one.
Since the only difference between YPRR and Y/T is the metric “targets per route run,” it’s worth asking: is Targets Per Route Run a metric worth looking at? Is it more useful than Yards per Target? Well, the word “useful” will mean different things to different people. What I’m curious about is the stickiness of each metric. And there is a pretty clear answer to that question.
Among the three metrics — YPRR, Y/T, and TPRR — it’s Targets Per Route Run that’s the most consistent from year to year. From 2007 to 2012, there were 344 wide receivers who saw at least 40 targets in Year N, and then played for the same team and saw at least 40 targets in Year N+1. [2]While there are some issues with survivorship bias here, I’m not sure (1) how to get around them, and (2) that those concerns bias the results in a way that’s more biased towards one of … Continue reading
To predict Year N+1 Yards per Route Run using Year N Yards per Route Run, the best fit formula is
N+1 YPRR = 0.843 + 0.474 * Yr N YPRR (R^2 = 0.21)
In other words, only 47.4% of a receiver’s Yards per Route Run is predictive of his YPRR in Year N+1.
What about Yards per Target? The best fit formula is:
N+1 Yd/Tar = 5.84 + 0.28 * Yr N Yd/Tar (R^2 = 0.08)
Here, we see that Y/T is not very sticky. To predict a receiver’s future yards per target, we use only 28% of his prior yards per target average.
Now, by definition, if yards per target is less sticky than yards per route run, than targets per route run has to be the stickiest. Here’s the best-fit formula:
N+1 TPRR = 0.062 + 0.671 * TPRR (R^2 = 0.41)
The number of targets a player sees per route happens to be a very sticky metric. Now, by itself, that doesn’t make Targets per Route Run a good metric. [3]In some ways, TPRR is like completion percentage. It’s not very sensitive to outliers, which makes it sticky. Yards per Target, of course, is very sensitive to outliers. But it is interesting to know, and it is useful in making predictions.
A few moments ago, we used Year N YPRR to predict Year N+1 YPRR. But we can gain some precision by instead using Year N Yards per Target and Year N Targets per Route Run to predict Year N+1 Yards per Route Run:
Yr N+1 YPRR = 0.062 + 5.09 * Yr_N_TPRR + 0.0656 * Yr_N_Y/T (R^2 = 0.23)
How would this formula work for Stills and Johnson? Last year, Still averaged 1.29 YPRR, Johnson 1.56. If we wanted to predict each player’s Yards per Route Run in 2014 [4]Ignoring the fact that Johnson is now a 49er, of course. using just their YPRR from 2013, we would project Stills at 1.45 [5]Because he was below average for this data set, and everyone in the set gets regressed to the mean of the group, he benefits. and Johnson at 1.58 YPRR. But if we use each player’s TPRR and Y/T from last year, Stills’ projection stays at 1.45, while Johnson’s rises to 1.74. In other words, the regression thinks Johnson’s much more likely to maintain his elite TPRR than Stills is to maintain his elite Y/T. And that makes sense, at least to me.
Finally, I thought it would be fun to use the regression formula above to predict the wide receivers with the top YPRR averages in 2014. In the table below, I’ve listed the 20 wide receivers with the highest YPRR projection based on their 2013 Yards per Target and Targets per Route Run averages (minimum 40 targets, with all data coming from Pro Football Focus). For reasons that will become evident in a moment, the far right column lists each player’s routes per team pass attempts in 2014.
| Rk | Name | Team | 2013 Y/T | 2013 TPRR | 2014 Proj YPRR | 2013 R/TPA |
|---|---|---|---|---|---|---|
| 1 | Justin Blackmon | JAX | 9 | 0.29 | 2.11 | 0.25 |
| 2 | Calvin Johnson | DET | 10.1 | 0.27 | 2.1 | 0.83 |
| 3 | Julio Jones | ATL | 10.2 | 0.27 | 2.1 | 0.3 |
| 4 | Andre Johnson | HOU | 8 | 0.29 | 2.05 | 0.91 |
| 5 | Anquan Boldin | SFO | 9.6 | 0.27 | 2.05 | 1.01 |
| 6 | Josh Gordon | CLE | 11 | 0.24 | 2.02 | 0.84 |
| 7 | Vincent Jackson | TAM | 7.8 | 0.28 | 2.02 | 0.98 |
| 8 | Pierre Garcon | WAS | 7.7 | 0.28 | 2.01 | 0.94 |
| 9 | Jerrel Jernigan | NYG | 8 | 0.28 | 2.01 | 0.24 |
| 10 | A.J. Green | CIN | 8.3 | 0.27 | 2 | 1.01 |
| 11 | Antonio Brown | PIT | 9.1 | 0.26 | 1.99 | 0.97 |
| 12 | Brandon Marshall | CHI | 8.2 | 0.26 | 1.92 | 1 |
| 13 | Alshon Jeffery | CHI | 10.2 | 0.23 | 1.91 | 0.99 |
| 14 | DeSean Jackson | PHI | 11.2 | 0.22 | 1.91 | 0.98 |
| 15 | Dez Bryant | DAL | 8 | 0.26 | 1.89 | 0.98 |
| 16 | T.Y. Hilton | IND | 8.1 | 0.25 | 1.87 | 0.87 |
| 17 | Cole Beasley | DAL | 7.1 | 0.26 | 1.86 | 0.32 |
| 18 | Kendall Wright | TEN | 8.1 | 0.25 | 1.86 | 0.95 |
| 19 | Victor Cruz | NYG | 8.5 | 0.24 | 1.82 | 0.83 |
| 20 | Demaryius Thomas | DEN | 10.4 | 0.21 | 1.81 | 0.95 |
While sixteen of the wide receivers saw at least 80% of their teams passing snaps [6]Note: A couple of wide receivers have more pass routes than their teams had pass plays. I believe this is because PFF includes passing plays called back due to offensive penalties in the number of … Continue reading, four receivers saw fewer than 35% of their team’s snaps. Of those, one was Atlanta’s Julio Jones, who ran routes on 93% of Atlanta’s passing plays through the first five games of the year, but missed the final eleven with a fractured foot.
The other three are kind of interesting. Justin Blackmon was in the same boat as Jones in that he only played in four games. But in those games he gained 415 yards, and a 103.8 yard per game average while playing with Chad Henne is pretty incredible. Of course, Blackmon missed the first four games of the season for violating the NFL’s substance abuse policy, and then received an indefinite suspension for again being in violation of that policy after the Jaguars’ eighth game of the year. He is unlikely to see the field in 2014, and will almost certainly go down as a colossal bust. But if he never plays again, he have caught 83 passes for 1,201 yards in his final 16 NFL games, split between his rookie and sophomore seasons. He may be a bust, but it wasn’t because of what he did on the field.
The other two “weird” names on the list are cut from different clothes than Jones or Blackmon. The Giants’ Jerrel Jernigan not only had a 66% catch rate — that’s excellent for someone playing with the 2013 version of Eli Manning — but he was targeted on a remarkable 28% of his routes in 2013! So, uh, what’s up with that? Through thirteen games, Jernigan had just 10 catches for 92 yards, and was a forgotten man behind Victor Cruz, Hakeem Nicks, and Rueben Randle. At the time, Jernigan had barely seen the field, so he hadn’t run many routes, either. Then, in week 15, Cruz was injured in the third quarter against Seattle, and did not play again in 2014. Over the final 2.5 games of the year, Jernigan caught 19 passes for 237 yards and two touchdowns. Those numbers came in garbage time against Seattle and against Detroit and Washington, so they should be taken with a grain of salt. But what we have here is a backup thrust into a starting role due to injury, and a player who then produced like a star receiver over the final 10 quarters of the season. What does that mean? Who knows, but that at least explains why Jernigan was on the list.
Cole Beasley may be the weirdest case in the group. He saw significant time in games sporadically throughout the year. Beasley spent nearly all of his time in the slot, and as a result, his playing time was tied to the health of Miles Austin. Austin missed five games: weeks 4 and 5 against Denver and Washington, and then weeks 8 through ten against the Lions, Vikings, and Saints. Beasley also saw significant action against Philadelphia in week seven, when the Cowboys were without their top two running backs. In those six games, Beasley caught 21 passes for 210 yards. While that’s not a great stat line, it is a pretty good stat line for a player who was still only getting about 20 snaps per game.
Beasley caught 72% of his targets in 2013; that sounds good, but it’s not out of line with the catch rate of a lot of other slot receivers. What’s more impressive to me is that Tony Romo threw to Beasley on 26% of his routes, which is an extremely high figure. While it’s unlikely we’ll see Beasley see significant playing time in 2014, I’m a little more interested in watching him now than I was before this post.
As for the other 16 receivers on the list? There aren’t too many surprises there, but it might be interesting to compare that list to the True Receiving Yards leader board.
References
| ↑1 | I suppose one counter to that would be that Stills was competing with Jimmy Graham, Marques Colston, and the Saints obsession with throwing passes to running backs, while Johnson was competing with Scott Chandler, Robert Woods, and Fred Jackson for targets. |
|---|---|
| ↑2 | While there are some issues with survivorship bias here, I’m not sure (1) how to get around them, and (2) that those concerns bias the results in a way that’s more biased towards one of the variables we’re examining than the others. |
| ↑3 | In some ways, TPRR is like completion percentage. It’s not very sensitive to outliers, which makes it sticky. Yards per Target, of course, is very sensitive to outliers. |
| ↑4 | Ignoring the fact that Johnson is now a 49er, of course. |
| ↑5 | Because he was below average for this data set, and everyone in the set gets regressed to the mean of the group, he benefits. |
| ↑6 | Note: A couple of wide receivers have more pass routes than their teams had pass plays. I believe this is because PFF includes passing plays called back due to offensive penalties in the number of routes run by each wide receiver. I did include sacks when calculating routes per team pass attempt, so that seems to be the only explanation. |