≡ Menu

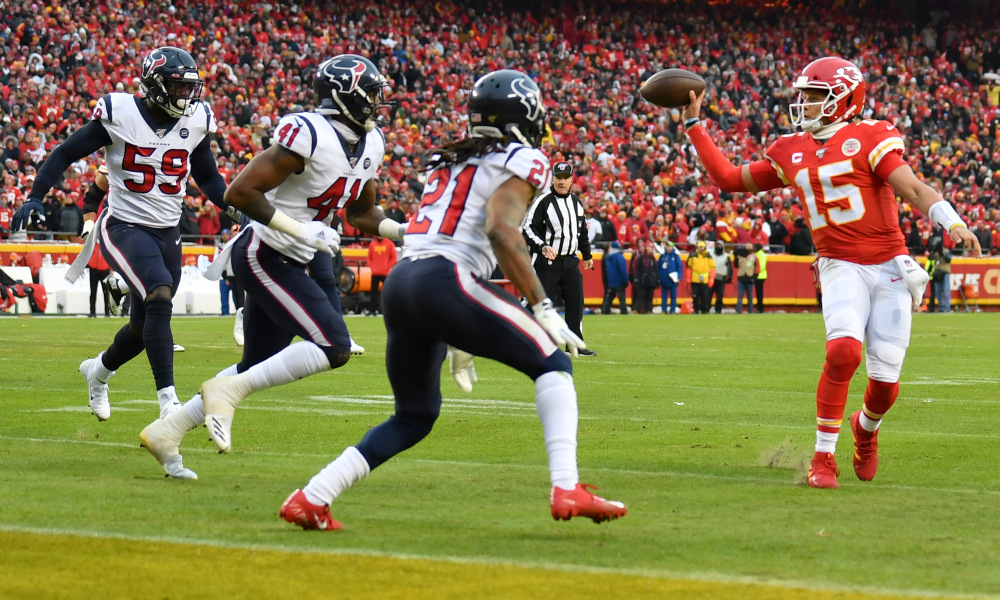
It’s safe to say that the Chiefs rely on their quarterback, Patrick Mahomes, a lot more than the 49ers rely on Jimmy Garoppolo. More often than not, these Super Bowls have ended with the better team winning, and the better quarterback losing.

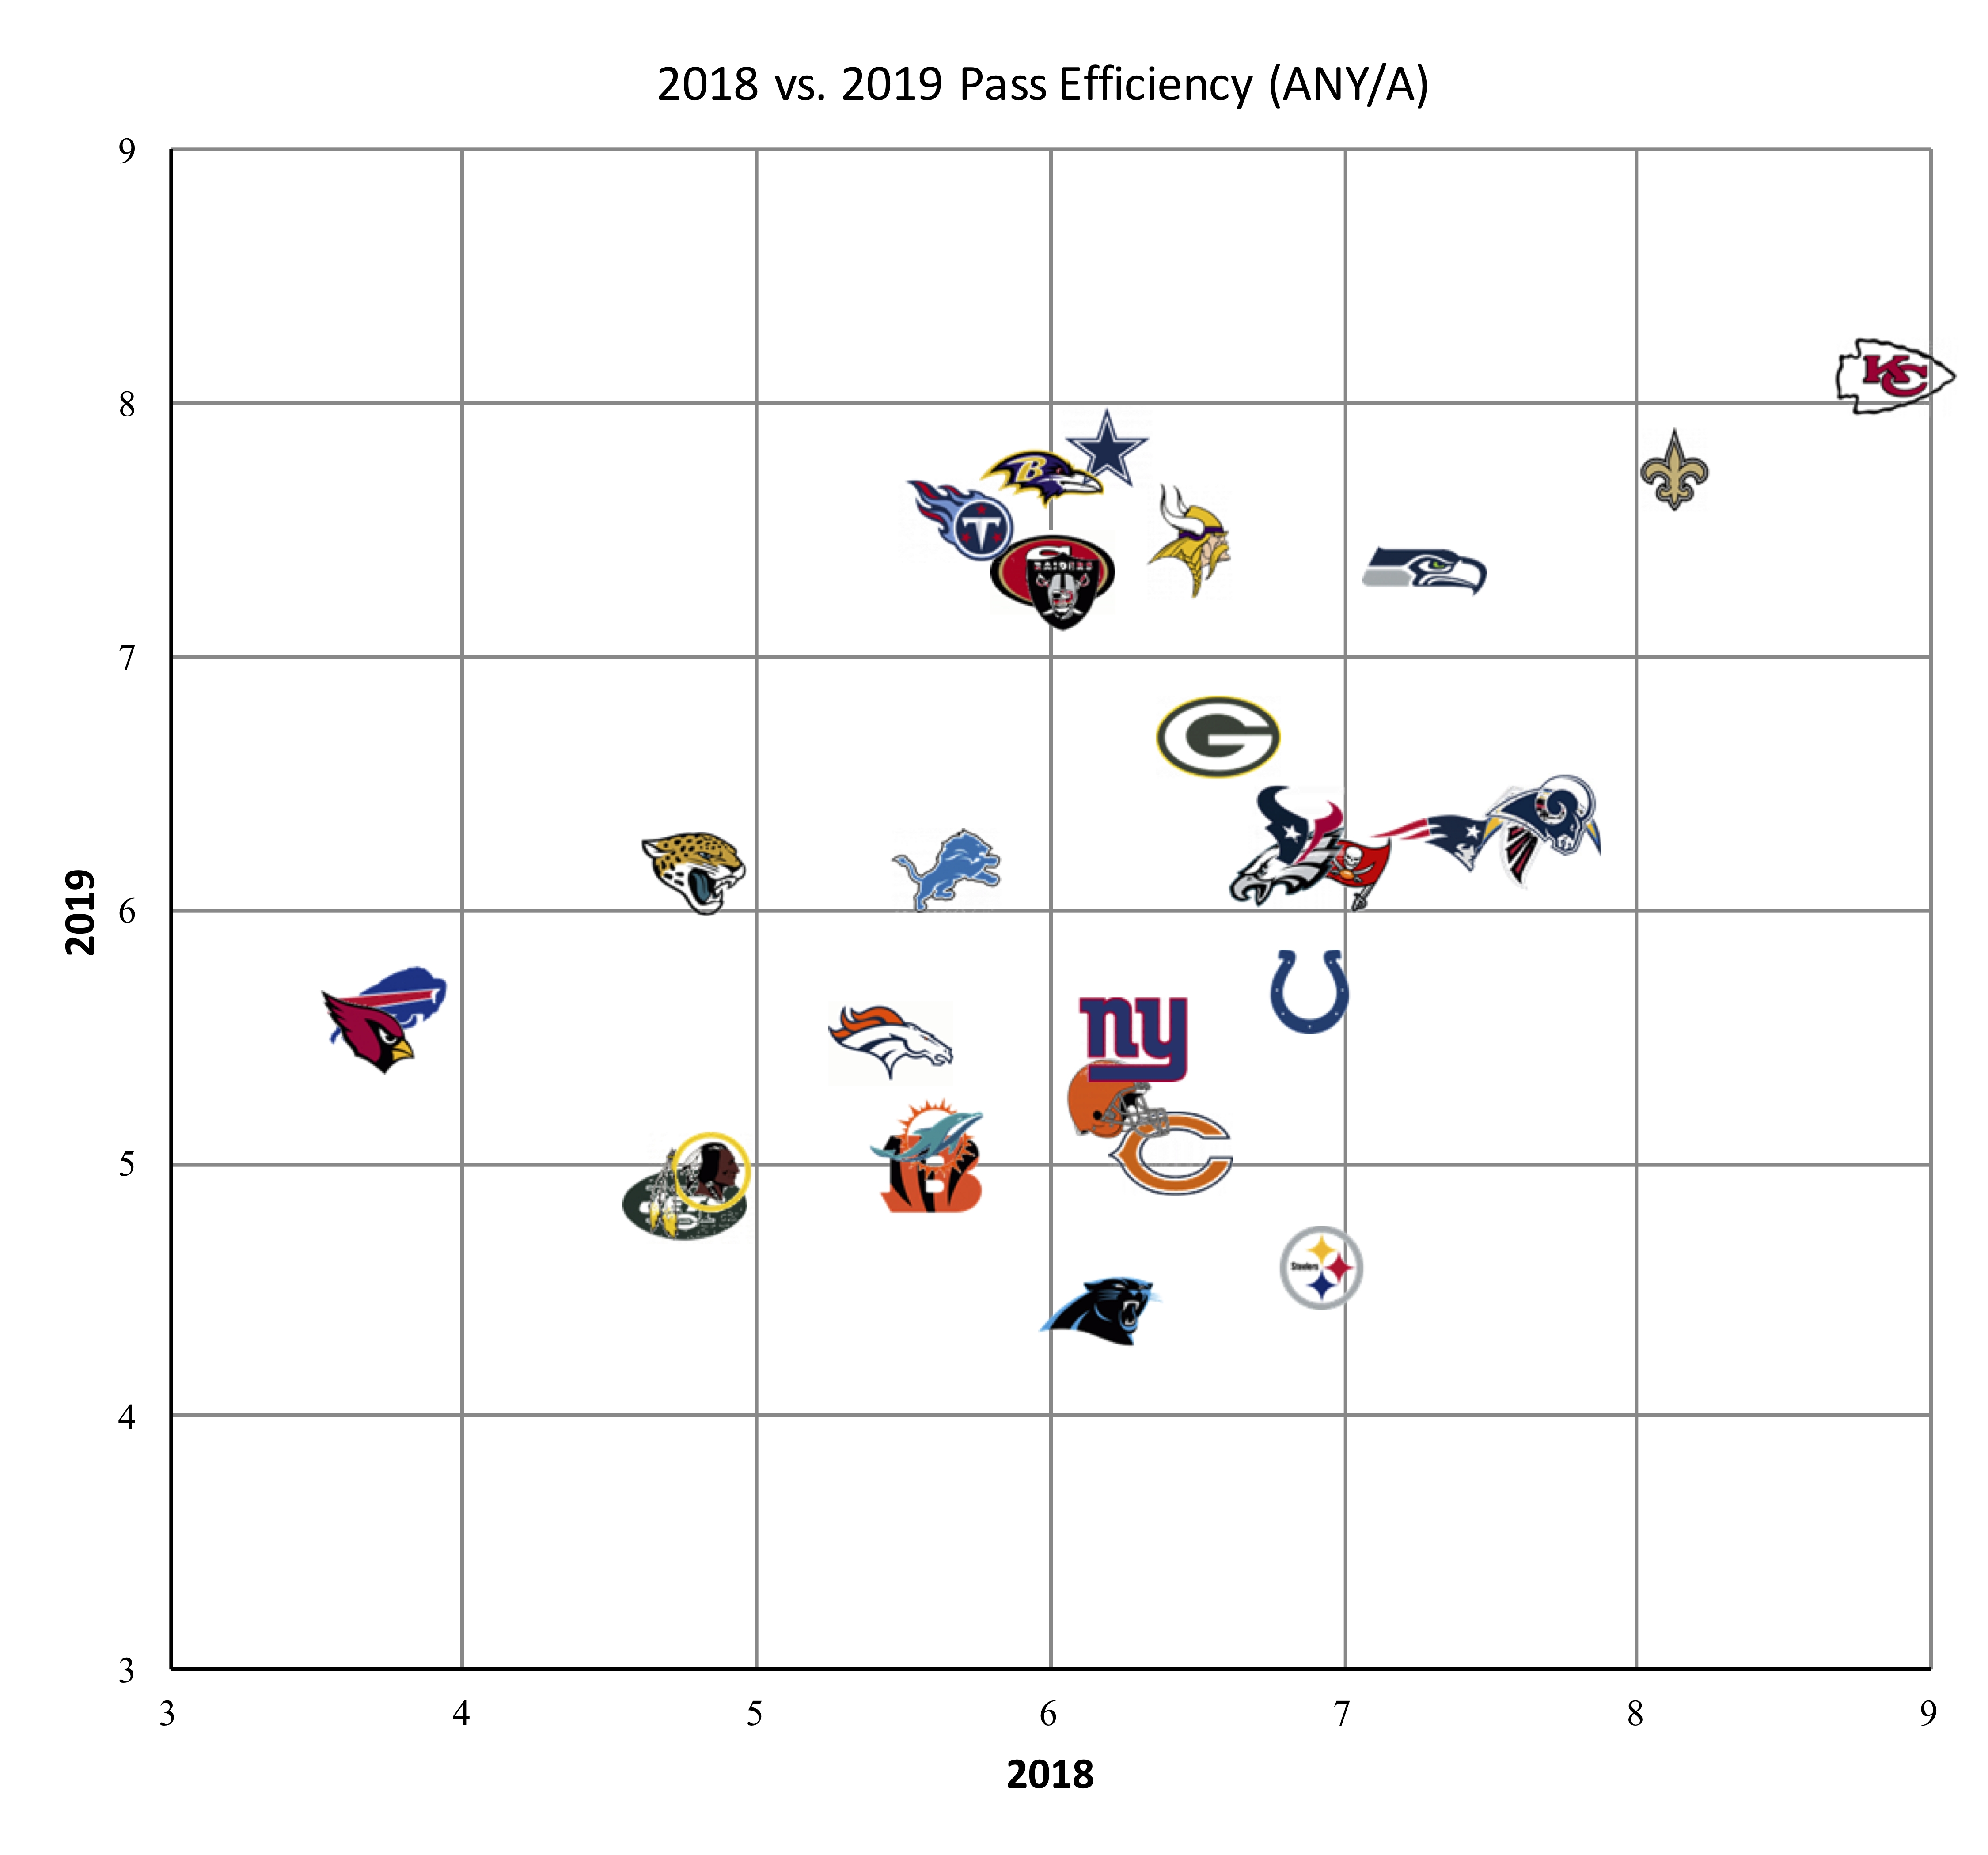
The most extreme example is probably Super Bowl XLVIII between the Seahawks and Broncos. Seattle had a great defense and a very good running game, with an efficient but low-volume quarterback. Denver had the best quarterback in the NFL. Does that sound familiar? Of course, as we all know, the Seahawks blew out the Broncos.

Five years earlier, in Super Bowl XLIII, the Steelers were a much more balanced team than the Cardinals. Arizona had Kurt Warner, Larry Fitzgerald, and Anquan Boldin, but Pittsburgh was driven by its top-ranked defense. Ben Roethlisberger had been interception prone during the season, and the Steelers passing attack was average at best for most of 2008. Still, Pittsburgh emerged victorious.

And while you likely don’t remember it, Super Bowl IX is another good comparison to this year’s game. Minnesota had Fran Tarkenton, who was arguably the top quarterback in the NFC in 1974, but the defense had fallen from its golden days of the late ’60s and early ’70s. Meanwhile, Pittsburgh ranked 1st or 2nd in most of the key defensive categories but had a young and unproven quarterback in Terry Bradshaw. The Steelers were not very reliant on their quarterback, while Minnesota was: and in the Super Bowl, the dominant defense carried the day.

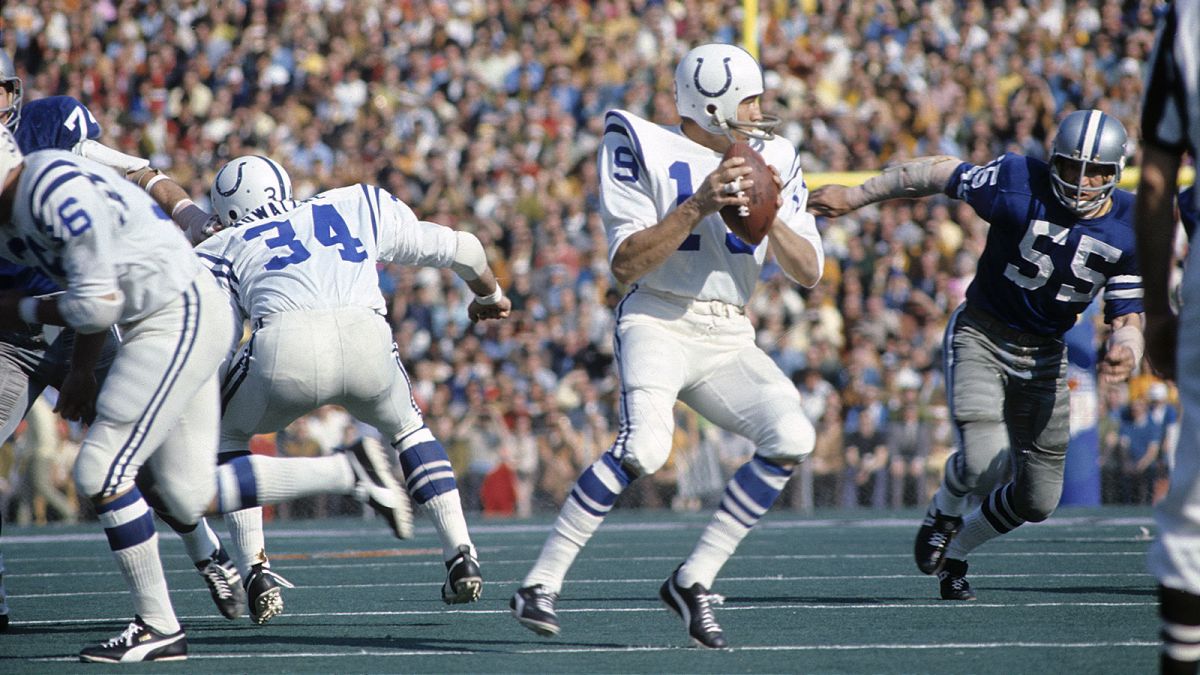
A counter example comes from 2006 in Super Bowl XLI. The Bears had an interception prone quarterback in Rex Grossman and an outstanding defense, while the Colts were obviously carried by Peyton Manning. This time, the dominant quarterback’s team won, although it was the running game and the defense (or maybe the absence of a passing game for Chicago) that really led Indianapolis to victory.

How about one of the greatest upsets in pro football history, in Super Bowl XLII? We don’t often think of this game as a “great QB vs. a balanced team” sort of game, because New England was just so much better than New York during the regular season. But the Giants passing game was below-average during the regular season and the defense was better than average, while the Patriots were defined by their passing game. In the Super Bowl, the Giants defensive line dominated the game, and led to a huge upset.

Another lopsided game was Super Bowl XXIV between the ’89 49ers and ’89 Broncos. While San Francisco was the better team overall, and 13-point favorites, the Broncos were certainly the more balanced team. The 49ers passing offense was off the charts good during the regular season, while Denver’s defense finished 1st in points allowed and 3rd in yards allowed. The 49ers blew out the Broncos in the most one-sided game in Super Bowl history.

Let’s close with two more games that featured upsets by the “balanced/defense” team over the “star QB team”. In Super Bowl 50, the Broncos had a great defense while the Panthers had the league MVP at quarterback. And in Super Bowl XXXVII, the Bucs had a great defense while the Raiders had the league MVP at quarterback. In both games, the dominant defense stole the show.

Will Super Bowl LIV follow a similar trend? I’m a bit surprised to see the Chiefs as 1.5-point favorites in this game. While no game is a perfect mirror of any other game, there are many similarities between this 49ers/Chiefs game and several of the games on the above list. And we know that the 49ers were the better team overall this season. Even Super Bowl XXV, between the Giants and Bills, matches this trend. That game didn’t make the list because the Giants passing attack during the regular season was very good, but that was mostly with Phil Simms; if you consider the Giants team that made the Super Bowl as a balanced/defense-heavy team going up against a high-octane offense, that’s another mark in favor of the 49ers on Sunday.

So what methodology did I use to come up with these results? The full explanation below. [continue reading…]

{ 0 comments }

Super Bowl Teams In Year N-1

Last year, the Kansas City Chiefs were the #1 seed in the AFC, while the 49ers had the second-worst record in the NFL. This year, the two teams are in the Super Bowl. Today, let’s look at how each of the 108 Super Bowl teams fared in Year N-1 — that is, the year before making the Super Bowl.

For each team, I calculated their Pythagenpat record in Year N-1. The best Super Bowl team by Year N-1 Pythagenpat record was, unsurprisingly, the 1973 Dolphins. As we all know, the year before Miami went 14-0 and won the Super Bowl.

The 2019 Chiefs don’t fare all that well in this regard, mostly because the 2018 team ranked 24th in points allowed. Kansas City was the #1 seed, but it was not a dominant team by these standards. The 49ers, however, do stand out as particularly bad (although I’ll note that San Francisco, despite finishing with the 2nd pick in the 2019 Draft, “only” had the 6th worst Pythagenpat rating of 2018). The 2018 49ers are one of the worst 5 teams to make the Super Bowl the following season. [continue reading…]

{ 0 comments }

2019 Team Ratings: Adjusted Yards Per Play

In 2019, the Vikings averaged 7.13 yards per pass play, while the Chargers averaged 7.01 yards per pass play. Yards per pass play here is just Net Yards per Attempt, which is team passing yards (net of sacks) divided by pass attempts (including sacks).

In 2019, the Vikings averaged 4.48 yards per carry, while the Chargers averaged only 3.97 yards per carry.

But in 2019, despite Minnesota being more efficient both at passing and rushing than Los Angeles, the Vikings averaged fewer yards per offensive play than the Chargers: Minnesota averaged 5.83 Y/P, while Los Angeles averaged 5.90 Y/P. Regular readers here know that this is the result of Simpson’s Paradox, a counter-intuitive phenomenon in which a trend appears in different sets of data but reverses when these data are combined.

How does this happen? Because overall, passing is more efficient than running when it comes to yards per play, and the Chargers passed much more frequently than the Vikings. That’s one reason why I don’t like “yards per play” as a statistic to measure offensive production: it’s biased in favor of pass-happy teams.

Instead, I like to use a modified version called adjusted yards per play, which takes 60% of the team’s Yards per Pass average and 40% of the team’s Yards per Carry average. This eliminates any Simpson’s Paradox issues and gives a better sense of which are the most efficient offensive teams.

And here’s your Super Bowl LIV tie-in: the Chiefs averaged more yards per play this year than the 49ers, but San Francisco averaged more adjusted yards per play. Here’s how to read the table below. San Francisco had 514 pass plays for 3,792 yards, averaging 7.38 Net Yards per Attempt. The 49ers had 498 rushing plays for 2,305 yards, averaging 4.63 yards per carry. Overall, this means the 49ers averaged 6.02 yards per play, but San Francisco passed on only 50.8% of plays this season. As a result, the 49ers averaged 6.28 Adjusted Yards per Play (60% of 7.38 plus 40% of 4.63), which was the third-best average this season. The Chiefs rank 5th in this metric: Kansas City averaged 6.22 yards per play and 6.16 adjusted yards per play. And, if you removed the three Matt Moore games (Denver, Green Bay, Minnesota), the Chiefs in the 13 Patrick Mahomes games averaged 6.34 yards per play and 6.29 Adjusted Yards per Play.

[continue reading…]

{ 1 comment }

Jimmy Garoppolo and Third Down Performance, Part II

During the regular season, Jimmy Garoppolo had 143 pass plays on third down. On 13 of those pass plays, he took a sack. On the other 130 third down pass plays, Garoppolo gained a first down on exactly half of them. On Saturday, commenter LightsOut85 pointed out that he thought Garoppolo’s great third down performance was “more an indicator of SF’s offensive scheme (namely YAC) than his passing ability.”

Is that true? I decided to investigate. Of Garoppolo’s 130 third down pass plays that were not sacks:

    • 41 of them (31.5%) were thrown at or beyond the first down marker (i.e., past the sticks) and completed for a first down.
    • 30 of them (23.1%) were thrown past the sticks but fell incomplete.
    • 24 of them (18.5%) were thrown short of the sticks but still picked up a first down (this is the category LightsOut85 was focused on).
    • 35 of them (26.9%) were thrown short of the sticks and did not pick up a first down.

The graph below shows each of his 130 pass attempts. It is color-coded to make it easier to read, but let’s explain.  The X-Axis shows the distance — i.e., it was 3rd-and-X.  The Y-Axis shows the amount of air yards for the throw.  For example, at the top right, you will see a 3rd-and-16 pass that went for 41 air yards, which was one of the more memorable plays of the 49ers season.

If the pass was thrown at or beyond the sticks, the bubble is blue.  If it was converted for a first down, the dot is fully colored in blue; if it was not, it is a white bubble with a blue outline.  If the pass was thrown short of the sticks, the bubble is red.  If it was converted for a first down, the dot is fully colored in red; if it was not, it is a white bubble with a red outline. [continue reading…]

{ 0 comments }

Super Bowl LIV features the two best tight ends in the game: Kansas City’s Travis Kelce and San Francisco’s George Kittle. Over the last six seasons, Kelce has averaged 1,078 receiving yards per season, and he’s posted four straight 1,000-yard years. But it was Kittle who was the top tight end this year according to the AP, and the top player overall according to Pro Football Focus.

Kittle is an excellent blocker and an outstanding receiver, but today, I want to focus on his receiving numbers. While Kittle put together a great season working with Jimmy Garoppolo, he ranked “only” 3rd in receiving yards among tight ends. That’s because the 49ers were one of the most run-heavy teams this year: Kelce’s Chiefs threw 97 more passes than the 49ers, while Oakland’s Darren Waller played on a team that threw 45 more passes than San Francisco.

In terms of pure receiving yards per team pass attempt, Kittle was best in the league.
[continue reading…]

{ 1 comment }

Jimmy Garoppolo and Third Down Performance

In 2018, in an article about the weird 2017 season that Jameis Winston had (if I only knew what the future would hold!), there was one tidbit you might have missed: in  2017 season, Jimmy Garoppolo had the best 3rd down conversion rate in the league.  After being traded to the 49ers in midseason, Garoppolo picked up a first down on exactly half of his dropbacks (28 of 56).

Garoppolo did not repeat this success in limited playing time in 2018 (6 of 24); you won’t be surprised to learn that Patrick Mahomes (48%) led the NFL in this metric last season. [continue reading…]

{ 1 comment }

On the surface, it is very easy to paint Super Bowl LIV as yet another matchup between a great defense and a great offense, similar to Super Bowl 50 (Panthers/Broncos), Super Bowl XLVIII (Broncos/Seahawks), any of the first three Super Bowls, or many of the great ones in between.

The Chiefs have the reigning MVP of the NFL in Patrick Mahomes, and Kansas City is averaging 4.3 points (!) and 48 yards per drive this postseason. The 49ers had a dominant defense in the first half of the season, becoming just the 9th team since 2002 to allow 102 or fewer points through 8 games. In the playoffs, San Francisco held Minnesota to just 10 points and then shut out the Packers in the first half (while forcing two turnovers), effectively clinching a Super Bowl berth by halftime courtesy of a 27-0 lead.

But here’s the interesting thing: did you know that the 49ers scored more points this year than the Chiefs? And that Kansas City allowed fewer points this year than San Francisco? Strange, but true. In fact, San Francisco scored more points and gained more yards than Kansas City.

[continue reading…]

{ 0 comments }

Super Bowl History: Test Your Knowledge

Can you name the winner and loser from each Super Bowl?

How about the Super Bowl MVP? The final score? The points spread? The stadium?

Test your knowledge below, by filling in as much as you can. Answers appear after the jump.

YearWinnerLoserSpreadPts WPts LSBMVPBoxscoreStadium
1966
1967
1968
1969
1970
1971
1972
1973
1974
1975
1976
1977
1978
1979
1980
1981
1982
1983
1984
1985
1986
1987
1988
1989
1990
1991
1992
1993
1994
1995
1996
1997
1998
1999
2000
2001
2002
2003
2004
2005
2006
2007
2008
2009
2010
2011
2012
2013
2014
2015
2016
2017
2018

[continue reading…]

{ 0 comments }

Mahomes can beat you deep — or with a flip.

Against the Texans in the Division Round of the 2019 postseason, Mahomes gained 16 passing first downs on 35 passes (no sacks), for a remarkable 45.7% passing first down rate. The Chiefs receivers also had six drops in this game and Mahomes picked up a first down on all four of his scrambles: this means he gained 20 first downs on his 33 plays where a receiver didn’t drop a target: it was truly a magical performance by Mahomes.

Against the Titans in the 2019 AFC Championship Game, Patrick Mahomes threw for 14 first downs on 35 passes, while also taking two sacks. That’s a passing first down rate of 37.8%. Note that this ignores that Mahomes scrambled 6 times and picked up a first down on four of them, so his true first down rate was 41.9% (the Chiefs also just dropped two passes here).

Let’s ignore the advanced stats for a minute (scrambles, drops) and just focus on his passing numbers: Mahomes has picked up 30 first downs through the air on 72 dropbacks this postseason, a 42% rate. That’s amazing, but it isn’t as amazing the standard way we analyze quarterbacks here: Mahomes is averaging 10.74 ANY/A this postseason! [continue reading…]

{ 0 comments }

[Editor’s note: this is a repost from last year, with a few updates.]

The first four Super Bowls were all played on grass stadiums: the first Super Bowl was at Memorial Coliseum in Los Angeles, the Orange Bowl in Miami hosted Super Bowls II and III, and Tulane Stadium in New Orleans was the venue for Super Bowl IV.

But the dreaded AstroTurf revolution came to football in the ’70s. For Super Bowl V, the Orange Bowl in Miami was again the host site, but by now, the natural grass surface had been replaced with Poly-Turf, making it the first Super Bowl played on artificial turf.

[continue reading…]

{ 0 comments }

Did you know that the Titans are 13-0 when Derrick Henry rushes for at least 100 yards? Analysts who have given more than a few seconds of thought know this is the kind of statistic doesn’t tell us much about causality. I’ll let Doug Drinen explain why, as he did back in May 2001 in a classic article on the types of tricks people use to lie with statistics:

Thoughtful analysts have long known that while running successfully can help you win, winning definitely leads to more carries and more yards. That said, I wanted to actually investigate Henry’s 13 games with the Titans where he crossed the century mark and see: how much did it matter that he rushed for 100 yards?

Crossing the 100-yard mark did not help Tennessee win (3 games)

Week 4, 2019 vs. ATL – Boxscore

Henry rushed for exactly 100 yards in this game. His final carry was a 1-yard run on 3rd-and-11 that brought us to the two-minute warning. The Titans were up 24-10 at this point, so crossing the 100-yard mark was meaningless.

Week 13, 2017 vs. HOU – Boxscore

The Titans led 17-13 with 57 seconds remaining in the game. The Texans had just called their final timeout. Tennessee had 3rd-and-5 at their own 25-yard line, and a punt here would give Houston the ball back with a chance to win. However, Henry was sharing carries with DeMarco Murray at this point in his career, and with 57 seconds remaining, Henry had just 10 carries for 34 yards. On his final carry of the game, he rushed for 5 yards to pick up the first down and clinch the game… and then kept going for another 70 yards, scoring a touchdown to put the icing on the cake. Henry finished with 11 carries for 109 yards, but had he been tackled at the Houston 10-yard line and finished with 99 yards, the game was still over. A great run that clinched the game, to be sure, but him actually crossing the century mark was meaningless.

Week 6, 2017 vs. IND – Boxscore

Henry’s first 100-yard game, and a near mirror image of the game described above. Henry had 18 carries for 59 yards with 1:00 left in the game. The Titans, up by 7 points, had 3rd-and-5 at their own 28, with the Colts out of timeouts. A failed third down conversion would give Indianapolis a chance to tie the game, but Henry rushed for 5 yards to pick up the first down… and then 68 more. He finished with 19 carries for 131 yards, but crossing the 100-yard mark was not meaningful to helping the Colts win. Had he rushed for 6 yards, instead of 68 yards, the game still was over. [continue reading…]

{ 0 comments }

Opinion: 2020 Centennial Hall of Fame Class

Brad Oremland is a sportswriter and football historian. You can follow him on Twitter @bradoremland.


This week, the NFL and the Pro Football Hall of Fame announced 15 new members of the PFHOF, the 2020 Centennial Hall of Fame Class. There is a backlog of qualified candidates, so the Centennial class was a good idea. The selection committee included many qualified and knowledgeable voters: coaches Bill Belichick and John Madden; Hall of Fame players with excellent coaching or executive credentials, Dick LeBeau and Ozzie Newsome; executives Gil Brandt, Joel Bussert, Carl Peterson, Bill Polian, and Ron Wolf; historians Joe Horrigan and Chris Willis; and journalists Jarrett Bell, John Clayton, Frank Cooney, John Czarnecki, Rick Gosselin, Elliot Harrison, Ira Kaufman, Jeff Legwold, John McClain, Gary Myers, Sal Paolantonio, Dan Pompei, Charean Williams, and Barry Wilner. I wish they had more people directly involved with the league, and fewer journalists, but I understand why they shaped the committee the way they did, and it was essentially a good panel.

The results of the voting, unfortunately, do not reflect that.

The selections included:

Let’s start with the good: [continue reading…]

{ 0 comments }

The 2014 season marked a new era of passing efficiency. And since the 2014 season, the passing game has remained extremely efficient. However, there were a lot of quarterback injuries in 2019: we spent most or all of the season without Andrew Luck, Ben Roethlisberger, Cam Newton, and Alex Smith; as a result, pass efficiency, as measured by Adjusted Net Yards per Attempt, was slightly down in 2018 compared to 2019.

The graph below shows each team’s ANY/A in 2018 (X-Axis) and 2019 (Y-Axis).

[continue reading…]

{ 2 comments }

Can Rodgers erase Favre’s bad history?

In 2007, Aaron Rodgers was a third-year backup on the Green Bay Packers. In week 2 of that season, the Packers blew out the Giants, on the road, 35-13. Four months later, the Giants and Packers were playing in Green Bay in the 2007 NFC Championship Game.

Packers fans were confident: they were home, they were 7.5-point favorites, and they were facing a team they had defeated handily during the regular season. Unfortunately for them, the rematch went very differently: the Giants won, in overtime, 23-20.

But that game may give Rodgers and Packers fans something to point to as they prepare for the 2019 NFC Championship Game. Green Bay is headed to San Francisco, the site of a 37-8 49ers blowout in the regular season. San Francisco fans are confident: they are home, they are 7.5-point favorites, and they are facing a team they defeated handily during the regular season.

Of course, 49ers fans have positive examples to point to, as well. In fact, they have a lot of them, with Jimmy Garoppolo also having some experience he can point to as a backup. In 2014, Garoppolo was a rookie on the New England Patriots. In week 10 of that season, the Patriots blew out the Colts, 42-20, in Indianapolis, in a game best remembered for Jonas Gray hitting the national stage with 201 rushing yards and 4 touchdowns. The two teams would later meet in Foxboro in the 2014 AFC Championship Game. New England was a 7.0-point home favorite, and demolished the Colts even more convincingly. So much so that the 45-7 victory is mostly remembered now for the “Deflategate” controversy that surfaced after the game. [continue reading…]

{ 2 comments }

2020 Centennial Hall of Fame Class Announced

The 15 members of the 2020 Centennial HOF call were announced today.  The group included:

What do you think?

{ 0 comments }

In week 10, the Chiefs and Titans faced off in one of the most exciting and weirdest games of the year. Tennessee won 35-32 in a game that had it all: a 68-yard touchdown run (by Derrick Henry, naturally), a 63-yard touchdown pass, a fumble returned for a 53-yard touchdown, a Ryan Tannehill strip sack, a Ryan Tannehill 23-yard touchdown pass in the final seconds, an aborted field goal attempt, and a blocked field goal attempt as time expired.

It was one of the wildest games of the season, and if we get a repeat of that game, football fans are in for a treat. Patrick Mahomes was the top passer in the NFL that week, throwing for 446 yards and 3 touchdowns, while Henry rushed for 188 yards.

But there is one big difference: that game was in Nashville, while this game will be in Arrowhead. That makes this a repeat of last season, when the Chiefs lost by 3 points on the road to the Patriots in the regular season, than hosted the Patriots in the AFC Championship Game. Of course, Kansas City lost the playoff rematch, too. [continue reading…]

{ 0 comments }

There were many decisions to analyze from yesterday’s AFC Division Round matchup between the Texans and Chiefs. Houston raced out to a 24-0 lead and somehow still trailed at halftime, fueled in part by its own poor fourth down decisions (kicking a field goal on 4th-and-a-foot early, a fake punt later). Kansas City became just the third team to win a game by 20+ points after trailing by 20+ points earlier in the same game.

But there was an interesting decision late in the game that, while it wound up having no impact on the game, is still worthwhile to analyze. Here was the situation: Kansas City led, 48-31, with 8:10 left in the game. The Chiefs faced 4th-and-2 from the Houston 6-yard line, and had two choices:

  • Attempt a field goal to take a 51-31 lead. This would gave Houston the ball at its own 25-yard line, down by 20 points, with 8:06 to go.
  • Go for it, which would lead to one of three results:
    • Score a touchdown, effectively ending the game.
    • Convert the 4th down, and the drive still ends in a field goal attempt, albeit with probably two more minutes taken off the clock.
    • Fail on the 4th down conversion, which gives Houston the ball, down 17 with 8:00 remaining, at their own 6-yard line.

So what is the best decision here? Obviously the Chiefs chances of winning are extremely good no matter what they do. With 8 minutes left, the odds of Houston scoring 17, 20, or 21 points are all really low. Let’s think about it in a more competitive game situation. [continue reading…]

{ 0 comments }

Today marks the 27th postseason game of Andy Reid’s career.

In 17 of the first 26 games, Reid’s team was favored; shockingly, those teams have gone just 9-8.

In the other 9 games, when Reid’s teams (the Eagles in all but one game) were underdogs; they went 3-6.

But today, Reid’s Chiefs are 10-point favorites at home against Houston, the single largest point spread for any playoff game under Reid.

The graph below shows each of the first 26 games of Reid’s career, marked in Eagles and Chiefs colors. The X-Axis shows how many points by which his team was favored; the Y-Axis shows the actual margin of victory.

The short version is:

  • Upper Right: Favored to win and actually won (9 games)
  • Lower Right: Favored to win and lost (8 games, including four with the Chiefs where Kansas City lost by 1, 1, 2 points, and in overtime).
  • Upper Left: Underdogs but won (3 games)
  • Lower Left: Underdogs and lost (6 games)

[continue reading…]

{ 0 comments }

Offensive Production vs. Salary Cap Dollars, 2019

Let’s look at a simple graph today. The X-Axis shows the salary cap dollars each team spent on its offense in 2019, per Over The Cap. The Y-Axis shows how good each offense was in 2019, based on PFR’s Expected Points Added model.

The Packers spent the most money on offense this season, at $111M salary cap dollars. Green Bay finished 10th in EPA.

The Ravens led the way in EPA and did so despite spending just $53M on offense. Quarterback Lamar Jackson has a cap hit of just $2.2M, while G Marshal Yanda ($9.125M) is the team’s most expensive offensive player. In fact, only three offensive players on Baltimore have a cap hit of over five million: Yanda, LT Ronnie Stanley ($6.5M) and WR Willie Snead ($5.6M). Although it’s probably worth noting that Joe Flacco has a dead cap hit of $16.0M in 2019, but dead money is not included in the graph below.

The final 8 teams are in red circles:

[continue reading…]

{ 0 comments }

Texans quarterback Deshaun Watson and Packers quarterback Aaron Rodgers had the two best games of the season. The quarterbacks had nearly identical stat lines: Watson threw 33 passes for 426 yards with 5 TDs and no sacks (15.94 ANY/A) while Rodgers threw 31 passes for 429 yards and 5 TDs with 1 sack (16.28 ANY/A).

To calculate how much passing value each player provides in a game, we take the player’s ANY/A, subtract league average (6.16) and then multiply that difference by the number of dropbacks. For Watson, that gives him 323 adjusted net yards of value over average; for Rodgers, it’s 324 yards of value. But there was one difference between the two games: Watson played a below-average defense in Atlanta, but Rodgers played a Raiders defense that ranked in the bottom three of the NFL against the pass. Once you adjust for strength of schedule, Watson has the best game of the season.

The worst game of the season? Without adjusting for strength of schedule, that honor belongs to Sam Darnold against the Patriots. In that game, Darnold was awful: not only did he throw 4 interceptions, but he gained just 73 net yards on 33 dropbacks. In that game, Darnold finished at -310 adjusted net yards of value relative to league average, the worst performance of the season. But, of course, the Patriots had the best defense against the pass. After adjusting for SOS, the worst game of the year was … Kyle Allen against the Falcons. It doesn’t help that Atlanta was pretty bad against the pass, but Allen was absolutely awful: he threw 4 interceptions and took 5 sacks against a bottom 8 defense.

The table below shows the every passing performance in 2019, from best to worst. The table below is fully sortable and searchable. [continue reading…]

{ 0 comments }

How much did passing efficiency decline in 2019 compared to a record-setting 2018? That depends, a bit, on how you measure passing efficiency — in more ways than one.

In 2018, all NFL passers combined to average 6.32 Adjusted Net Yards per Attempt. In 2019, all NFL passers combined to average 6.16 ANY/A, a decline of 2.6%. However, there is another way to measure league average, and that’s by taking an average of the average ANY/A stats for each of the 32 teams.

In 2019, while “the NFL” as a whole had a 6.16 ANY/A average, an average of each of the ANY/A rates for the 32 teams comes to 6.19. If that is confusing to you, think of it this way: when we calculate “the league average” in passing stats, we are giving more weight to the Bucs, Panthers, and Falcons than to the Ravens, Titans, and Vikings. Collectively, those three NFC South teams were responsible for 11.0% of all passing plays in 2019; meanwhile, pass plays from Baltimore, Tennessee, and Minnesota account for only 7.7% of NFL passing plays.

When we think of league average, we almost always mean a weighted average that gives more weight to the teams that pass most frequently. But there’s at least an argument to be made that league average would be better defined by taking an average of the averages. And in this case, in 2019, it would mean a higher average: that’s because the wrong passers threw it more often in 2019.

Last year, the right passers threw it more often: an average of the ANY/A produced by each of the 32 teams was 6.29 (which was lower than the normal average of 6.32, since the weaker passing teams threw less frequently last year). By this measure, passing efficiency declined only 1.6% — from 6.29 to 6.19 — from 2018 to 2019, rather than by 2.6%.

Let’s look at each team in 2019. The X-Axis shows the number of dropbacks: the NFC South teams (other than the Saints) are on the far right, because they passed the most. The Y-Axis shows pass efficiency, as measured by ANY/A.

It’s pretty clear that the “wrong teams” passed most often in 2019; the chart has a slope that is down and to the right. This, of course, is why the “NFL ANY/A” was 6.16 but the “average of the ANY/A for the 32 teams” was 6.19; by giving the Ravens and Titans equal weight to the Bucs and Panthers, you raise the average.

You might think this is how things always are: after all, the whole point behind my Game Scripts work is that teams with the lead pass less often, and trailing teams pass more often. But of course we already discussed that last year, the reverse was true: the right teams passed more often. In fact, there isn’t much of a trend in recent years as to whether or not the better passing teams are more likely or less likely to pass more often.

This final graph is a little wonky, but here goes. It shows the league average ANY/A in each season calculated the normal way minus the average of the ANY/A for all of the teams. So in 2019, you get a negative number (6.16 – 6.19 is -0.03); in 2018, it’s positive. Any time the graph is above 0, it means that the right teams are passing more often. Any time it’s below zero — as in 2019 — it means the wrong teams are passing more often.

What do you think?

{ 0 comments }

On Monday, I looked at the top passers in 2019 after adjusting for strength of schedule. The same process and methodology is used to rank the defenses, so let’s look at that today. And while they had an easy schedule, there’s no denying that the 2019 Patriots had — by a good measure — the best pass defense in the NFL. Quarterbacks throwing against New England gained just 3.41 Adjusted Net Yards per Attempt in 2019, a whopping 2.75 ANY/A better than average. And while that group was 0.31 ANY/A worse than average, it still means the Patriots pass defense was 2.44 ANY/A better than average.

The Bills actually had the easiest SOS in 2019, followed by the Dolphins, Cowboys, Jets, and then Patriots. No surprise there: the AFC East and NFC East had the six easiest opposing passing schedules in 2019. Meanwhile, the Panthers, Chargers, Texans, Cardinals, and Chies all had very difficult passing schedules. In particular, this is noteworthy for Kansas City: after adjusting for SOS, Kansas City’s pass defense ranked 3rd in the NFL in 2019. Derek Carr had his worst and third-worst games of the season against the Chiefs; Tom Brady had his second-worst game of the season against Kansas City; and Philip Rivers had two of his five worst games of the year when facing Kansas City. Lamar Jackson struggled, too: he had a rare game with no passing touchdowns against Kansas City, and averaged just 5.41 net yards per pass attempt.

The full results, below. [continue reading…]

{ 0 comments }

On Sunday, Kirk Cousins became the 19th quarterback to start a game for the Minnesota Vikings in the playoffs. That is, by a large amount, the most quarterbacks to start a playoff game for one franchise since 1950 (the classification of who was the starting quarterback in any given game becomes murkier for several of the seasons prior to 1950).

And just as impressively, Cousins became the 11th different quarterback to start and win a game for the Vikings. Can you guess them all? While you think about that, the table below shows the number of different quarterbacks to start, and the number of different quarterbacks to win, a playoff game for each NFL team since 1950. [continue reading…]

{ 0 comments }

2019 Rearview Adjusted Net Yards per Attempt

Last week, I posted the final 2019 passing numbers; today, I am going to show those numbers after we adjust for strength of schedule, using the methodology described here. As always, an iterative process is used to adjust for strength of schedule: each quarterback’s season is adjusted for the quality of the defenses he’s faced, those defenses are adjusted for the quality of the quarterbacks they faced, and so on, until equilibrium is reached.

Carson Wentz and Sam Darnold had the two easiest schedules this year. Let’s begin with Wentz. Here’s how to read his graph, starting with his best game of the season.  In week 1, Wentz and the Eagles hosted Washington and won, 32-27.  Wentz threw 39 passes for 313 yards with 3 TDs and no interceptions, and 1 sack for no yards.  That gives him 373 Adjusted Net Yards (Passing Yards + 20 * TDs – 45 * INTs – Sack Yards Lost) on 40 DropBacks (Attempts + Sacks).  This game made up 6.2% of all dropbacks Wentz had all season.  He averaged 9.33 ANY/A in this game on 40 dropbacks; assuming the league average ANY/A of 6.16, this means Wentz produced 127 Adjusted Net Yards of Value above average.  However, Washington was a bad pass defense, finishing 0.88 ANY/A below average.  Therefore, Wentz’s actual value for this game was +91, now +127, after adjusting for strength of schedule. [continue reading…]

{ 0 comments }

Derrick Henry and the Titans just dethroned the defending Super Bowl champions, in Foxboro, in the Wildcard round of the playoffs. Henry, who led the NFL in rushing yards during the regular season, rushed 34 times for 182 yards and 1 touchdown. Henry also caught one pass for 22 yards, finishing the day with 204 of the Titans 272 yards of offense.

That’s right: Henry himself accounted for exactly 75.0% of the Tennessee offense on Saturday night, the second-largest percentage by a single player in a playoff win in NFL history. Among players with at least 100 yards of offense, only four other players had accounted for even 70% of a team’s total yards in a playoff game:

  • In 1981, the Giants beat the Eagles 27-21, as Rob Carpenter rushed 33 times for 161 yards and caught 4 passes for 32 yards.  Carpenter had 193 of New York’s 275 yards that day (70.2%).
  • In 1976, the Vikings defeated the Rams 24-13, in a game that featured an early special teams touchdown for Minnesota and then a whole lot of Chuck Foreman. The great running back finished with 199 yards from scrimmage on only 20 touches, giving him 74.5% of Minnesota’s 267 yards of offense that day.
  • In 1971, Washington lost to the 49ers, 24-21, but don’t blame Larry Brown.  The running back would go on to win the AP MVP award the following season, but as a precursor to that performance, Brown rushed 27 times for 84 yards and caught 6 passes for 62 yards and a touchdown, giving him 146 of Washington’s 192 yards of offense.  Brown had 76.0% of the team’s output that day in a losing effort.
  • In the 1985 playoffs, the Rams shut out the Cowboys, 20-0, in a game that Eric Dickerson dominated. The Hall of Fame back rushed 34 times for 248 times and 2 touchdowns, and while he lost 4 yards on his lone reception, Dickerson still had 244 of Los Angeles’s 316 yards of offense.  That gave Dickerson a record 77.2% of his team’s offensive production.

[continue reading…]

{ 0 comments }

2019 AP All-Pro Teams Announced

Every year, I like to post the full results of the Associated Press voting for the All-Pro team, as the voting numbers are much more valuable than the binary answer to the question of whether or not a player was an All-Pro.

Remember the new rules beginning in 2016: there is no fullback position, but rather a “Flex” spot that goes to a running back, wide receiver, or tight end. This year, 30 of the 50 votes went to a running back, 12 votes went to a wide receiver, and 8 went to a tight end. On both offense and defense there are 11 first-team All-Pros: on offense, it’s five offensive lineman, a quarterback, two running backs, two wide receivers, one flex, and one tight end. On defense, there are 2 first team edge rushers, 2 interior defenders, 3 linebackers, 2 cornerbacks, 2 safeties, and one defensive back.

The voting is wildly inconsistent across positions, as you’ll soon see.

OFFENSE

Quarterback

Lamar Jackson, Baltimore, 47; Russell Wilson, Seattle, 3.

Running Backs

Christian McCaffrey, Carolina, 27; Derrick Henry, Tennessee, 20; Nick Chubb, Cleveland, 2; Dalvin Cook, Minnesota, 1.

Tight End

George Kittle, San Francisco, 33; Travis Kelce, Kansas City, 17. [continue reading…]

{ 0 comments }

2020 Finalists For Hall of Fame

The Hall of Fame just announced its finalists for the 2020 Hall of Fame Class.  Here’s the full list, which also includes PFR’s new Hall of Fame monitor metric

2020 HOF Finalists Table
Player Pos HOF Monitor From To AP1 PB St CarAV G
Steve Atwater S 90.63 1989 1999 2 8 11 78 167
Tony Boselli T 84.33 1995 2001 3 5 6 66 91
Isaac Bruce WR 90.14 1994 2009 0 4 13 102 223
LeRoy Butler S 113.78 1990 2001 4 4 11 89 181
Alan Faneca G 141.43 1998 2010 6 9 13 113 206
Torry Holt WR 94.64 1999 2009 1 7 11 99 173
Steve Hutchinson G 121.03 2001 2012 5 7 11 96 169
Edgerrin James RB 93.72 1999 2009 1 4 8 114 148
John Lynch S 70.80 1993 2007 2 9 12 87 224
Sam Mills LB 56.83 1986 1997 1 5 11 101 181
Troy Polamalu S 121.23 2003 2014 4 8 9 94 158
Richard Seymour DE 96.15 2001 2012 3 7 9 90 164
Zach Thomas LB 111.70 1996 2008 5 7 11 115 184
Reggie Wayne WR 94.73 2001 2014 1 6 12 117 211
Bryant Young DT 64.93 1994 2007 1 4 14 88 208

[continue reading…]

{ 0 comments }

The low point of Baltimore’s brilliant season came at the hands of… Cleveland?

In week 4, the Cleveland Browns traveled to Baltimore and beat the Ravens, 40-25.

At the time, this moved the Browns into first place in the AFC North, as Baltimore and Cleveland were both 2-2.

Since then, Baltimore went 12-0, while Cleveland went 4-8. In retrospect, that game is really, really strange.

Every year, I like to examine the least-conforming games of the season. I do this by generating each team’s Simple Rating System rating — which is just points differential per game adjusted by opponent and home field. Note that I am not using SRS ratings at the time of the game, but SRS ratings as of the end of the season. Baltimore finished the season with a 15.6 average margin of victory against a perfectly average schedule; therefore the Ravens SRS rating was +15.6. Cleveland in 2019 had a -3.7 average margin of victory against a touch schedule (+1.7); therefore, the Browns finished with a -1.9 SRS rating. The beauty of the SRS is each point represents a point above or below average, and you can use the SRS ratings to predict games.

So when the Ravens (+15.6) host the Browns (-1.9), giving 3 points for home field, we would predict that Baltimore would win by 20.5 points. And when Baltimore travels to Cleveland, we would predict Baltimore to win by 14.5 points. In the latter case, that was nearly a perfect prediction: the Ravens won in Cleveland 31-15. In the former case, though, it was off by 35.5 points! That makes it the least-conforming game of 2019.

The table below shows the 2019 SRS ratings: [continue reading…]

{ 0 comments }

NFL Dynasties and the NFL 100 Team, Part II

Brad Oremland is a sportswriter and football historian. You can follow him on Twitter @bradoremland.


Yesterday, I began looking at the greatest dynasties in pro football history were represented on the NFL 100 team. Today, we pick back up with the top 13 dynasties.

t9. Decatur Staleys/Chicago Bears, 1920-27
73-17-16 (.811), 1 championship, 0 title appearances
20 dynasty points
NFL 100 Members:
George Halas
Other HOFers: Ed Healey, George Trafton

Not a dynasty. They rate well by my system, but the system wasn’t designed for the 1920s. These were the first eight years of the NFL’s existence — actually in 1920 the league was called the APFA: American Professional Football Association. Teams not only played variable numbers of games, they regularly played against teams who weren’t even in the league. In 1921, the Louisville Brecks, Muncie Flyers, New York Brickley Giants, and Tonawanda Kardex combined to go 0-7, getting outscored by a total of 172-0.

Only four of the 12 NFL teams in 1927 were still in the league five years later. The Bears, Giants, and Packers combined to outscore their opponents 459-161 that season. In this environment, it was easy for real teams to pad their records, but the Bears only won one championship. Furthermore, ties weren’t counted towards winning percentage, so when the Bears went 6-1-4 in 1924, that counted as an .857 record, worth three dynasty points. I’m sorry, but there’s no way going 6-1-4, with two draws each against the Racine Legion and the Rock Island Independents, should earn as many dynasty points as the 2010 Patriots or the 2011 Packers.

I include this team for the sake of completeness, but subjectively, it wouldn’t make my top 30, to say nothing of tied for 9th.

t9. Green Bay Packers, 1936-43
65-19-3 (.774), 2 championships, 3 title appearances
20 dynasty points
NFL 100 Members:
Curly Lambeau, Don Hutson
Other HOFers: Arnie Herber, Clarke Hinkle

Like the Joe Gibbs Dynasty in Washington, this team would actually benefit from a longer period than eight years: they were NFL champions in 1944. At a time when everyone played both offense and defense, the Packers had two great QBs (Cecil Isbell and Herber), a fullback who retired as the league’s all-time leading rusher (Hinkle), two very good linemen (Buckets Goldenberg and Bill Lee), a Hall of Fame coach (Lambeau), and Don Hutson.

Hutson was more than revolutionary; he was an anomaly. It is an understatement to say that he shattered records. Around the same time, Sammy Baugh redefined ideas about what passers could do, but Hutson was so outstanding that no one even thought to replicate what he was doing. In an 11-year career, he led the NFL in receptions eight times, in receiving yards seven times, and in receiving touchdowns nine times. He was also an excellent defensive player, with 30 interceptions in the six seasons the stat was kept. He led the league in 1940 and led in INT return yards in 1943. He was also a pretty good kicker, with nearly 200 extra points made. Like his contemporary Baugh, there’s a compelling argument that he is the greatest football player who ever lived.

Hinkle was an NFL 100 finalist as a linebacker. He was a terrific all-around player (#106) and a worthy NFL 100 finalist, but I don’t think there’s any single position at which he felt like he should be a finalist. I suppose linebacker was the best fit. [continue reading…]

{ 0 comments }