Regular readers know I’m not prone to exaggeration. I’m more of a splits happen kind of guy. But Super Bowl XLVIII will, in my opinion, be the greatest passing showdown ever. This year’s Super Bowl checks in as the greatest offensive/defensive showdown in Super Bowl history (and the greatest of any game, regular or postseason, since 1950). That’s because the passing showdown between Denver and Seattle is arguably the greatest of any game in all of pro football history.
How can we quantify such a statement? I’m glad you asked. If you recall, I labeled the 2013 Seahawks as one of the five greatest pass defenses since 1950. For new readers, Adjusted Net Yards per Attempt is calculated as follows:
[math]
(Gross Pass Yards + 20 * PTDs – 45 * INTs – Sack Yds)/(Attempts + Sacks)[/math]
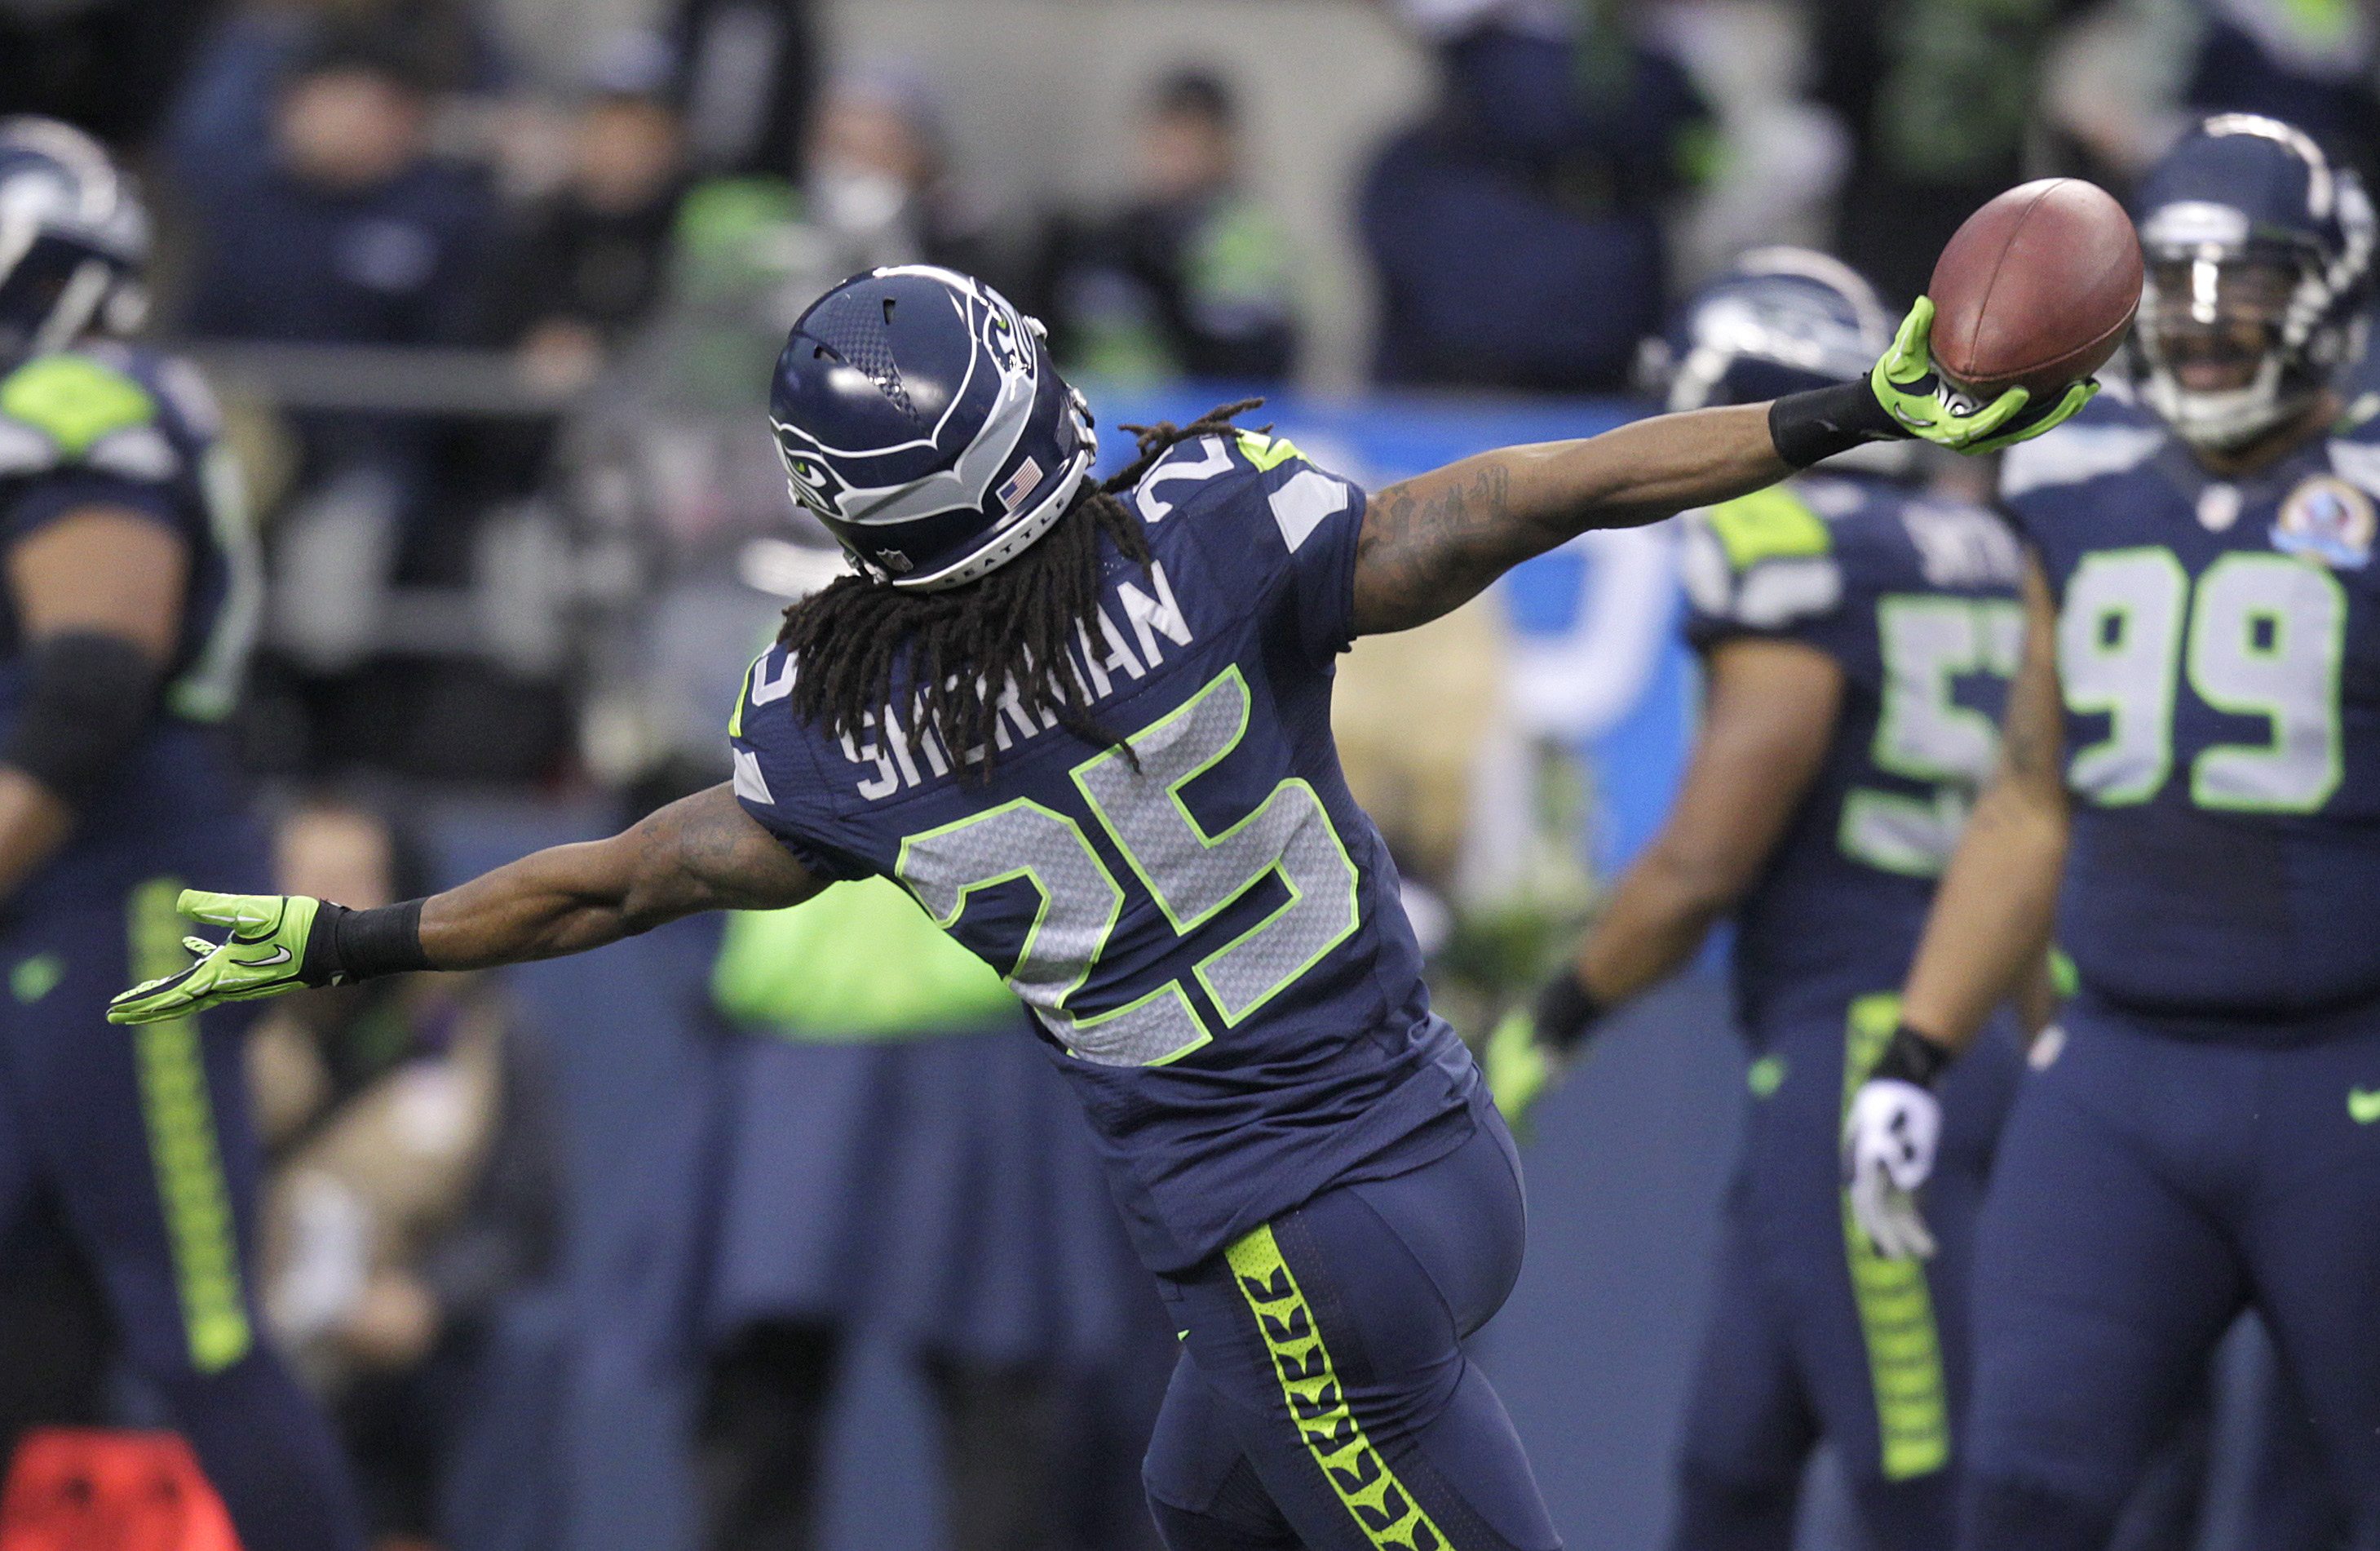
In 2013, the Seahawks allowed 3.19 Adjusted Net Yards per Attempt (Seattle allowed 3,050 gross passing yards and 16 TDs, while forcing 28 interceptions and recording 298 yards lost on sacks, all over 524 pass attempts and 44 sacks.). The other 31 pass defenses allowed an average of 5.98 ANY/A, which means Seattle’s pass defense was 2.79 ANY/A above average. Over the course of the 568 opponent dropbacks, this means the Seahawks provided 1,582 adjusted net yards of value over average. In other words, the Seattle pass defense provided 99 adjusted net yards over average on a per game basis. Let’s be clear: the Legion of Boom is not just a hype machine, and Richard Sherman, Earl Thomas, Kam Chancellor, and company form the best secondary in the league.
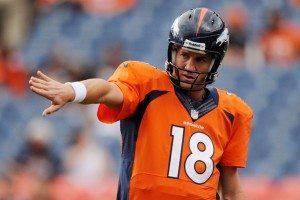
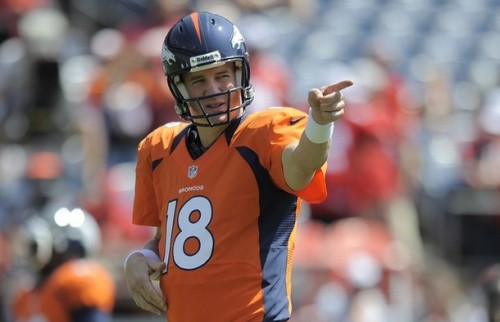
All other passing attacks are pushed aside when Manning is involved.
Denver’s offense was even more dominant, although that’s to be expected: in general, the spread in offensive ratings is a bit wider than it is on the defensive side of the ball. Denver threw for 5,572 gross passing yards and 55 touchdowns, while throwing just 10 interceptions and losing only 128 yards to sacks. The Broncos had 675 pass attempts and were sacked just 20 times, giving them an 8.77 ANY/A average. The other 31 offenses averaged only 5.79 ANY/A, meaning the Broncos were 2.98 ANY/A better than average. Over the 695 dropbacks the team had, that means Denver provided 2,072 adjusted net yards of value average average.
On a per-game basis, that’s 130 yards of value each game!
So, how do we judge the greatest passing showdowns in football history? Denver’s passing offense gets a rating of +130, while Seattle’s pass defense gets a rating of +99. Those two numbers have a Harmonic Mean of 112. That’s easily the most in Super Bowl history. In fact, it’s the third most in any playoff game ever, and those other two games each have asterisks.
In the 1961 AFL, the Houston Oilers behind George Blanda, Bill Groman, and Charley Hennigan possessed an incredible passing offense (rating of +167), while the San Diego Chargers had a dominant pass defense (+129). But in the early days of the AFL, the talent pool was diluted; this would be akin to comparing two teams in non-BCS conferences with out-of-this-world statistics to a matchup between champions in two power conferences. For what it’s worth, Houston won the game — played in San Diego — but with a catch. The Oilers offense was shut down, as Blanda went 18/40 for 160 yards with 1 touchdown and 5 interceptions…. but Houston won 10-3, as Jack Kemp threw four picks for the Chargers. [continue reading…]