by Chase Stuart
on July 7, 2018
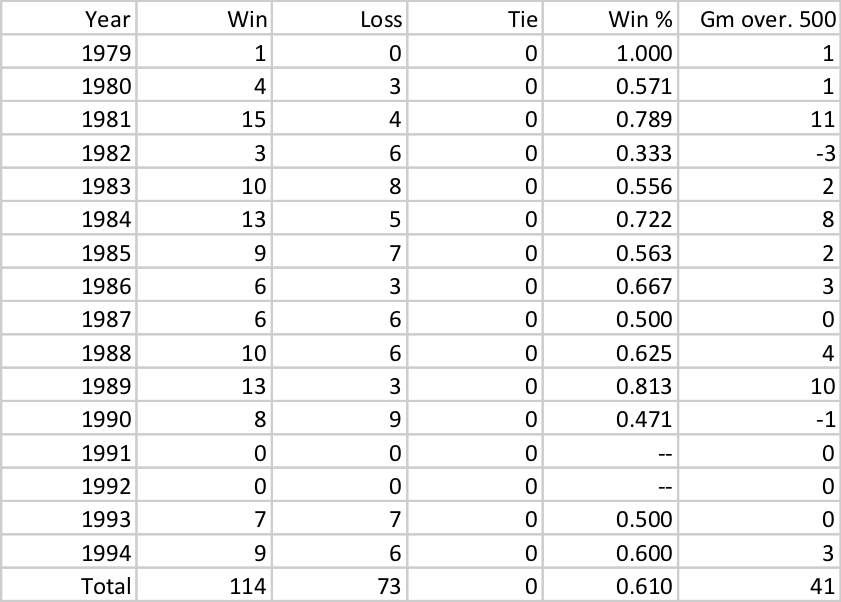
Joe Montana’s teams were really good at winning football games, going 117-47 and 16-7 in games started by the Hall of Fame quarterback. Montana’s teams had a 0.711 overall winning percentage, which is great; but what’s even more remarkable is how well his teams did against the points spread.
On average, Montana’s teams were favored by 4.5 points. And given the nature of how points spreads work, you would expect most teams to win about half of their games against the spread. But Montana’s teams went 114-73 against the spread, a remarkable winning percentage of 0.610. Much of the success was due to the 49ers of 1981 (15-4 ATS), 1984 (13-5), and 1989 (13-3). The ’81 team was one of the most surprising Super Bowl champions of all time; San Francisco was favored in just 9 of 19 games that year, with three of those spreads being just 1-point lines. And the ’84 and ’89 teams were two of the greatest teams of all time, so it’s not surprising that they had great ATS records, too. The table below show’s the record against the spread for each of Montana’s teams in each season of his career:
 …
…
Also really good against the spread, of course, is Tom Brady and the Patriots. The ’01, ’03, and ’04 Patriots were all Super Bowl champions that were remarkable against the spread, combining to go 41-11-3 relative to the Vegas odds. The Patriots remained solid but unspectacular against the spread since then, although the ’16 team went 13-2 with Brady under center.

What makes the Brady stuff all the more remarkable: the last 52 times the Patriots have taken the field with Brady under center, the Patriots have been favored. And you have to go back 60 games, November 2014 game against the Packers, where New England has been underdogs with Brady under center. More on that tomorrow. [continue reading…]
Tagged as:
Joe Montana,
Tom Brady,
Vegas
{ }
by Chase Stuart
on January 20, 2014

No, Peyton, you're the man.
In 1984,
Dan Marino set an NFL record with 48 touchdown passes, but his Dolphins lost in the Super Bowl. Twenty years later,
Peyton Manning broke Marino’s record, but he lost to the eventual Super Bowl champion Patriots in the playoffs. In 2007,
Tom Brady broke Manning’s touchdowns record, but
he lost in the Super Bowl, too.
When the greatest quarterback seasons of all time are discussed, these three years dominate the discussion. And with good reason. But if you include the playoffs — and frankly, there’s no reason not to include the playoffs — which quarterback produced the greatest season of all time? I’m going to stipulate that the greatest quarterback season ever has to end in a Lombardi Trophy, because otherwise, I think we’ll end up back in the world of Marino ’84/Brady ’07/Manning ’04. Of course, now another Manning season has entered the mix: and with a Super Bowl win, Manning’s 2013 should and would be remembered as the greatest quarterback season of all time.
So, the question becomes, which season would he knock off the top rung? I think there are six seasons that stand out from the rest, based on regular and postseason performance.
Honorable Mention [continue reading…]
Tagged as:
Dan Marino,
Joe Montana,
Kurt Warner,
Peyton Manning,
RANY/A,
Steve Young,
Tom Brady
{ }
by Chase Stuart
on September 16, 2013

The GSOT.
On its own, this
week five game against San Francisco doesn’t stand out as anything special. The 0-4 Rams were traveling to San Francisco with
Jamie Martin at quarterback, who led the team to just 10 points the previous week in Dallas after
Kurt Warner broke his
pinky finger. The 49ers were coming off of a bye week, and would send
Jeff Garcia and
Terrell Owens to the Pro Bowl, while
Garrison Hearst and
Kevan Barlow led a top-six ground game. San Francisco should have, and did, win convincingly.
The reason that’s a notable game is precisely because the 49ers were six-point favorites. That marked the first time since week 2, 1999 — when the Rams had not yet been recognized as the Greatest Show on Turf — that St. Louis was not favored to win a game. For the final 14 regular season games and the three playoff games in 1999, all seventeen games in 2000, all 19 games in 2001, and the first four games in 2002 — a stretch of 57 straight games — the Rams took the field as favorites. That’s the longest streak since 1978, and perhaps ever. And I’m not sure if this makes that fact more of less impressive, but all things considered, the Rams’ record wasn’t that great during the stretch. Part of the reason for the streak was that St. Louis generally had a weak schedule those years, but continually being favored to win games without a great record is an interesting (and rare) sign of respect.
[continue reading…]
Tagged as:
Isaac Bruce,
Jerry Rice,
Joe Montana,
Kurt Warner,
Steve Young,
Torry Holt
{ }
by Chase Stuart
on January 22, 2013
Just a guess, but I think that question will be asked quite a few times over the next couple of weeks. While the inanity of the discussion that usually follows that question is not something I wish to emulate, there’s no particular reason not to take an in-depth look at Flacco’s career. The table below shows Flacco’s performance in six key metrics — all relative to league average (1.00) — for each season of his career:

As you can see, with the exception of his great interception rate — which justifies its own post during this pre-Super Bowl period — Flacco’s career performance has been rather average. His touchdown rate, like those of many quarterbacks, has bounced up and down throughout his career. His sack rate was below average during his first three years, improved significantly in 2011, and landed right at the league average in 2012.

That is an elite Fu Manchu.
In the three main statistics — Y/A, NY/A, and ANY/A — Flacco has consistently finished in a tight window around the league average. His ANY/A has been slightly better than his NY/A thanks to that lofty interception rate, but suffice it to say
Joe Flacco is, and has been for years, a league average quarterback.
If we look at ESPN’s Total QBR, Flacco ranked 27th as a rookie in 2008, 15th in 2009, and 12th in 2010, signaling a young quarterback improving and on the rise. In 2011, he ranked 14th, perhaps signaling a leveling off, and then this past season, he finished 25th. The positive spin would be that he’s a league-average quarterback, and the negative one (at least prior to this post-season) would have been that he was regressing.
On the other hand, here is how Flacco has performed in the playoffs in each game, as measured by AY/A:
[continue reading…]
Tagged as:
Jake Delhomme,
Joe Flacco,
Joe Montana,
Playoffs,
Ravens
{ }
by Chase Stuart
on January 5, 2013

Is this a thinly-veiled Brady/Manning post?
, I looked at career rushing stats in wins and losses; today I will do the same but for quarterbacks.
I looked at all games, including playoffs, from 1960 to 2011, for all quarterbacks with at least 5,000 career passing yards over that time period. The table below lists the following information for each passer:
– His first year (or 1960, if he played before 1960) and his last year (or 2011, if still active)
– All the franchises he played for (which you can search for in the search box)
– His number of career wins, and his touchdown rate, interception rate, yards per attempt and Adjusted Yards per Attempt (which includes a 20-yard bonus for touchdown passes and a 45-yard penalty for interceptions) in wins
– His number of career losses, and his touchdown rate, interception rate, yards per attempt and Adjusted Yards per Attempt in losses
The table is sorted by AY/A in wins; unsurprisingly, Aaron Rodgers — who is the career leader in that metric — tops this table, too. In fact, Rodgers is also the leader in AY/A in losses. Note that this table includes all games played by the quarterback, not just his starts.
| Rk | Player | Years | Teams | PYD | Win | TD%_W | INT%_W | Y/A_W | AY/A_W | Loss | TD%_L | INT%_L | Y/A_L | AY/A_L |
| 1 | Aaron Rodgers | 2005--2011 | gnb | 19147 | 49 | 7.6% | 1.3% | 8.7 | 8.3 | 27 | 4.3% | 2.5% | 7.4 | 6.4 |
| 2 | Matt Schaub | 2004--2011 | atl-htx | 17936 | 48 | 5.3% | 1.7% | 8.7 | 8.1 | 53 | 3.5% | 3.3% | 7.2 | 5.8 |
| 3 | Tony Romo | 2005--2011 | dal | 21666 | 60 | 6.6% | 2.1% | 8.7 | 7.9 | 43 | 4.3% | 3.4% | 7 | 5.5 |
| 4 | Kurt Warner | 1998--2009 | ram-nyg-crd | 36296 | 81 | 6.8% | 2.2% | 8.7 | 7.8 | 57 | 3.3% | 4.4% | 7.2 | 5.3 |
| 5 | Daunte Culpepper | 1999--2009 | min-mia-rai-det | 25133 | 45 | 7.1% | 2.2% | 8.7 | 7.8 | 64 | 3.3% | 4% | 6.9 | 5.1 |
| 6 | Bob Berry | 1965--1975 | min-atl | 9197 | 32 | 7.4% | 2.3% | 8.6 | 7.7 | 36 | 4.2% | 7.4% | 7.1 | 3.8 |
| 7 | Steve Young | 1985--1999 | tam-sfo | 36450 | 125 | 6.8% | 1.7% | 8.3 | 7.6 | 60 | 2.9% | 4.2% | 7.2 | 5.3 |
| 8 | Philip Rivers | 2004--2011 | sdg | 26105 | 69 | 6.2% | 2.3% | 8.5 | 7.6 | 39 | 4% | 3.1% | 7.3 | 6 |
| 9 | Ben Roethlisberger | 2004--2011 | pit | 29729 | 90 | 5.7% | 2.2% | 8.4 | 7.6 | 38 | 3.7% | 4.9% | 7.2 | 5 |
| 10 | John Friesz | 1990--2000 | sdg-was-sea-nwe | 8699 | 19 | 5% | 1% | 7.8 | 7.5 | 38 | 2.6% | 4% | 5.8 | 4 |
| 11 | Bart Starr | 1960--1971 | gnb | 22810 | 99 | 6.6% | 2.9% | 8.6 | 7.5 | 41 | 2.4% | 5.9% | 6.7 | 4.1 |
| 12 | Don Meredith | 1960--1968 | dal | 17750 | 51 | 8.5% | 3.3% | 8.8 | 7.5 | 50 | 3.5% | 6% | 6.2 | 3.6 |
| 13 | Drew Brees | 2001--2011 | sdg-nor | 43722 | 97 | 6.5% | 1.7% | 8 | 7.4 | 66 | 3.4% | 3.7% | 6.7 | 5.1 |
| 14 | Ken O'Brien | 1984--1993 | nyj-phi | 25598 | 56 | 5.8% | 1.7% | 8 | 7.4 | 72 | 2.1% | 3.6% | 6.3 | 4.7 |
| 15 | J.P. Losman | 2004--2011 | buf-rai-mia | 6271 | 17 | 5.8% | 1.5% | 7.9 | 7.4 | 28 | 2.5% | 4.4% | 6.1 | 4.1 |
| 16 | Trent Green | 1997--2008 | was-ram-kan-mia | 28794 | 59 | 5.3% | 2.1% | 8.2 | 7.3 | 63 | 3.6% | 3.8% | 7.1 | 5.5 |
| 17 | Rob Johnson | 1995--2003 | jax-buf-tam-was-rai | 5947 | 20 | 4.8% | 1.5% | 7.9 | 7.3 | 25 | 2.8% | 3.6% | 6.7 | 5.1 |
| 18 | Chad Pennington | 2000--2010 | nyj-mia | 19241 | 46 | 5.1% | 1.2% | 7.7 | 7.3 | 49 | 3.2% | 4.1% | 6.6 | 4.9 |
| 19 | Boomer Esiason | 1984--1997 | cin-nyj-crd | 38520 | 89 | 6.6% | 2.4% | 8.2 | 7.3 | 103 | 3.3% | 4.4% | 6.5 | 4.6 |
| 20 | Neil Lomax | 1981--1988 | crd | 23156 | 48 | 6.4% | 2.1% | 8.1 | 7.3 | 59 | 3% | 3.3% | 6.6 | 5.2 |
| 21 | David Garrard | 2002--2010 | jax | 16489 | 45 | 5.3% | 1.4% | 7.8 | 7.3 | 44 | 2.7% | 3.4% | 6.4 | 4.9 |
| 22 | Matthew Stafford | 2009--2011 | det | 8220 | 13 | 8.1% | 1.8% | 7.9 | 7.2 | 17 | 3.4% | 4.4% | 6.3 | 4.4 |
| 23 | Joe Montana | 1979--1994 | sfo-kan | 46323 | 140 | 6.4% | 2.2% | 8.1 | 7.2 | 60 | 2.7% | 3.4% | 6.3 | 4.9 |
| 24 | Eddie LeBaron | 1960--1963 | dal | 5331 | 11 | 12.5% | 5.5% | 9.4 | 7.2 | 31 | 4.7% | 8.7% | 7.1 | 3.3 |
| 25 | Peyton Manning | 1998--2010 | clt | 60217 | 150 | 6.3% | 1.9% | 8 | 7.2 | 77 | 3.9% | 4.1% | 6.9 | 5.2 |
| 26 | Ed Brown | 1960--1965 | chi-pit-clt | 7723 | 35 | 7.7% | 5.8% | 9.7 | 7.2 | 33 | 2.9% | 8.8% | 6.5 | 2.6 |
| 27 | Wade Wilson | 1981--1998 | min-atl-nor-dal-rai | 18605 | 66 | 6.1% | 2.6% | 8.3 | 7.2 | 63 | 2.4% | 5.3% | 6.2 | 3.9 |
| 28 | Jay Cutler | 2006--2011 | den-chi | 18637 | 42 | 6.6% | 2.2% | 8.1 | 7.2 | 38 | 2.7% | 4.6% | 6.5 | 4.5 |
| 29 | Josh Freeman | 2009--2011 | tam | 8898 | 17 | 5.6% | 1.8% | 7.9 | 7.2 | 24 | 2.8% | 4.6% | 6.1 | 4.1 |
| 30 | Tom Brady | 2000--2011 | nwe | 45264 | 140 | 6.1% | 1.6% | 7.8 | 7.2 | 43 | 3.6% | 4.2% | 6.3 | 4.5 |
| 31 | Matt Moore | 2007--2011 | car-mia | 5137 | 17 | 6.2% | 1.8% | 7.8 | 7.1 | 19 | 2.8% | 5% | 6.2 | 4 |
| 32 | Chris Chandler | 1988--2004 | clt-tam-crd-ram-oti-atl-chi | 29212 | 72 | 5.9% | 2.6% | 8.2 | 7.1 | 105 | 3.1% | 4.4% | 6.4 | 4.4 |
| 33 | Len Dawson | 1960--1975 | cle-kan | 30112 | 105 | 8.7% | 3.6% | 8.6 | 7.1 | 64 | 3.2% | 6.3% | 6.6 | 3.8 |
| 34 | Joe Flacco | 2008--2011 | rav | 15348 | 49 | 4.6% | 1.2% | 7.6 | 7.1 | 24 | 3% | 4.4% | 5.9 | 4 |
| 35 | Trent Edwards | 2007--2010 | buf-jax | 6019 | 14 | 4% | 1.6% | 7.7 | 7.1 | 22 | 2% | 4.3% | 5.7 | 3.8 |
| 36 | Jeff Garcia | 1999--2009 | sfo-cle-det-phi-tam | 26894 | 63 | 5.4% | 1.3% | 7.5 | 7.1 | 68 | 3.4% | 3.1% | 6.4 | 5.1 |
| 37 | Ken Anderson | 1971--1986 | cin | 34159 | 100 | 6.2% | 2.4% | 8 | 7.1 | 92 | 2.7% | 4.7% | 6.7 | 4.7 |
| 38 | Rudy Bukich | 1960--1968 | pit-chi | 7865 | 30 | 7.5% | 3.5% | 8.5 | 7 | 35 | 3.5% | 8.6% | 6 | 2.3 |
| 39 | Troy Aikman | 1989--2000 | dal | 36791 | 105 | 4.8% | 2.1% | 7.9 | 7 | 76 | 2.1% | 4.1% | 6 | 4.2 |
| 40 | Damon Huard | 1998--2008 | mia-nwe-kan | 6349 | 20 | 4.9% | 1.1% | 7.4 | 7 | 24 | 2% | 4.3% | 5.8 | 4 |
| 41 | Jim Everett | 1986--1997 | ram-nor-sdg | 35957 | 66 | 5.7% | 2.6% | 8.1 | 7 | 97 | 3.2% | 4.2% | 6.5 | 4.6 |
| 42 | Roger Staubach | 1969--1979 | dal | 25491 | 106 | 6.1% | 2.5% | 8 | 7 | 44 | 3.5% | 6.3% | 6.7 | 3.9 |
| 43 | Bert Jones | 1973--1982 | clt-ram | 18589 | 47 | 6.4% | 3.1% | 8.2 | 7 | 58 | 3.6% | 4.6% | 6.3 | 4.3 |
| 44 | Frank Reich | 1985--1998 | buf-car-nyj-det | 6858 | 39 | 8.8% | 2.1% | 7.7 | 7 | 39 | 3.3% | 4.3% | 6.3 | 4.4 |
| 45 | Jeff Hostetler | 1986--1997 | nyg-rai-was | 17464 | 70 | 5.5% | 1.9% | 7.7 | 7 | 40 | 2.3% | 4.1% | 6.3 | 4.5 |
| 46 | Dan Fouts | 1973--1987 | sdg | 45165 | 91 | 5.9% | 3.2% | 8.3 | 6.9 | 95 | 3.1% | 5.5% | 7.1 | 4.7 |
| 47 | Bill Kenney | 1980--1988 | kan | 17374 | 37 | 5.9% | 2.5% | 8 | 6.9 | 49 | 3.2% | 4.2% | 6.5 | 4.6 |
| 48 | Y.A. Tittle | 1960--1964 | sfo-nyg | 11542 | 40 | 8.9% | 4.3% | 8.7 | 6.9 | 23 | 2.5% | 6.9% | 5.7 | 2.7 |
| 49 | Mark Brunell | 1994--2011 | gnb-jax-was-nor-nyj | 33905 | 99 | 4.8% | 1.8% | 7.6 | 6.9 | 91 | 3.2% | 2.9% | 6.2 | 4.9 |
| 50 | Aaron Brooks | 2000--2006 | nor-rai | 20822 | 41 | 5.8% | 1.6% | 7.5 | 6.9 | 54 | 3.3% | 4.1% | 6.4 | 4.7 |
| 51 | Patrick Ramsey | 2002--2008 | was-nyj-den | 5929 | 16 | 5.2% | 2.3% | 7.8 | 6.9 | 24 | 3.1% | 3.8% | 5.8 | 4.2 |
| 52 | Scott Mitchell | 1992--2001 | mia-det-rav-cin | 15925 | 40 | 6% | 2.1% | 7.7 | 6.9 | 45 | 2.6% | 4.6% | 5.9 | 3.9 |
| 53 | Randy Wright | 1984--1988 | gnb | 7106 | 12 | 5.4% | 3.4% | 8.3 | 6.9 | 33 | 2.2% | 5.5% | 5.9 | 3.5 |
| 54 | Rich Gannon | 1987--2004 | min-was-kan-rai | 30434 | 91 | 5.5% | 1.5% | 7.4 | 6.9 | 71 | 3% | 3.6% | 6.2 | 4.6 |
| 55 | Earl Morrall | 1960--1976 | det-nyg-clt-mia | 17529 | 92 | 7.9% | 4.8% | 8.9 | 6.9 | 44 | 4.2% | 6.9% | 6.6 | 3.6 |
| 56 | Sonny Jurgensen | 1960--1974 | phi-was | 31546 | 74 | 7.7% | 3.9% | 8.4 | 6.9 | 79 | 4.5% | 4.9% | 6.8 | 4.7 |
| 57 | Steve DeBerg | 1978--1998 | sfo-den-tam-kan-mia-atl | 34752 | 72 | 5.4% | 2.3% | 7.8 | 6.9 | 114 | 3.2% | 4.9% | 6.4 | 4.2 |
| 58 | Steve Beuerlein | 1988--2003 | rai-dal-crd-jax-car-den | 24317 | 64 | 5.6% | 2.3% | 7.8 | 6.8 | 66 | 3.4% | 4.2% | 6.8 | 5 |
| 59 | Fran Tarkenton | 1961--1978 | min-nyg | 48806 | 131 | 6.8% | 2.8% | 8 | 6.8 | 117 | 3.6% | 5.5% | 6.5 | 4.1 |
| 60 | John Brodie | 1960--1973 | sfo | 30783 | 78 | 6.7% | 3.3% | 8.2 | 6.8 | 79 | 3.3% | 6% | 6.1 | 3.5 |
| 61 | Doug Flutie | 1986--2005 | chi-nwe-buf-sdg | 15209 | 48 | 5.2% | 2.4% | 7.8 | 6.8 | 45 | 2.9% | 3.9% | 6 | 4.3 |
| 62 | Johnny Unitas | 1960--1973 | clt-sdg | 32335 | 107 | 6.3% | 3.8% | 8.4 | 6.8 | 59 | 2.7% | 7.3% | 6.5 | 3.2 |
| 63 | Joe Namath | 1965--1977 | nyj-ram | 28299 | 68 | 6.4% | 4% | 8.5 | 6.8 | 71 | 3.3% | 6.8% | 6.5 | 3.5 |
| 64 | Matt Ryan | 2008--2011 | atl | 14832 | 43 | 6.1% | 1.9% | 7.5 | 6.8 | 22 | 2.4% | 3% | 6.1 | 4.8 |
| 65 | Craig Erickson | 1992--1997 | tam-clt-mia | 7625 | 18 | 4.8% | 2.7% | 7.9 | 6.8 | 34 | 3.2% | 3.9% | 6.5 | 4.8 |
| 66 | Marc Bulger | 2002--2009 | ram | 23758 | 42 | 4.9% | 2.6% | 7.8 | 6.8 | 57 | 3.1% | 3.3% | 6.8 | 5.4 |
| 67 | Matt Cassel | 2005--2011 | nwe-kan | 11769 | 42 | 5.1% | 2% | 7.6 | 6.8 | 30 | 3.5% | 3.3% | 5.7 | 4.3 |
| 68 | Tom Flores | 1960--1969 | rai-buf-kan | 11960 | 40 | 8.3% | 3.8% | 8.3 | 6.8 | 44 | 2.8% | 6.7% | 5.7 | 2.8 |
| 69 | Phil Simms | 1979--1993 | nyg | 35141 | 102 | 5.3% | 2.5% | 7.7 | 6.7 | 72 | 3% | 4.3% | 6.4 | 4.6 |
| 70 | Derek Anderson | 2006--2011 | cle-crd-car | 9148 | 21 | 5.5% | 2.4% | 7.7 | 6.7 | 32 | 2.7% | 4.6% | 5.7 | 3.6 |
| 71 | Michael Vick | 2001--2011 | atl-phi | 18889 | 65 | 5.8% | 2.4% | 7.7 | 6.7 | 51 | 2.8% | 3.4% | 6.3 | 4.9 |
| 72 | Brett Favre | 1991--2010 | atl-gnb-nyj-min | 77693 | 201 | 6.3% | 2.2% | 7.6 | 6.7 | 125 | 3.2% | 4.9% | 6.4 | 4.3 |
| 73 | Craig Morton | 1965--1982 | dal-nyg-den | 29143 | 118 | 6.7% | 3.7% | 8.2 | 6.7 | 82 | 2.6% | 6.5% | 6.2 | 3.4 |
| 74 | Steve Pelluer | 1985--1990 | dal-kan | 6870 | 17 | 3.3% | 2.2% | 7.6 | 6.7 | 26 | 2.9% | 4.7% | 6.9 | 4.8 |
| 75 | Dan Marino | 1983--1999 | mia | 65871 | 155 | 5.7% | 2.4% | 7.7 | 6.7 | 105 | 4.1% | 3.9% | 6.8 | 5.1 |
| 76 | Donovan McNabb | 1999--2011 | phi-was-min | 40859 | 106 | 5.4% | 2% | 7.4 | 6.7 | 74 | 2.9% | 2.6% | 6.1 | 5 |
| 77 | Dave Krieg | 1980--1998 | sea-kan-det-crd-chi-oti | 40042 | 113 | 6.7% | 3% | 7.9 | 6.7 | 98 | 3% | 4.4% | 6.5 | 4.5 |
| 78 | Warren Moon | 1984--2000 | oti-min-sea-kan | 52195 | 108 | 5.5% | 2.6% | 7.7 | 6.6 | 110 | 3.1% | 4.2% | 6.8 | 4.9 |
| 79 | Jim Kelly | 1986--1996 | buf | 39330 | 110 | 6.1% | 3.2% | 8 | 6.6 | 67 | 3.1% | 4.6% | 6.6 | 4.6 |
| 80 | John Hadl | 1962--1977 | sdg-ram-gnb-oti | 33941 | 103 | 7% | 3.7% | 8.2 | 6.6 | 92 | 3.3% | 7.8% | 6.1 | 2.7 |
| 81 | Bernie Kosar | 1985--1996 | cle-dal-mia | 25254 | 67 | 4.8% | 1.9% | 7.4 | 6.6 | 66 | 3.1% | 3.4% | 6.6 | 5.1 |
| 82 | Jake Delhomme | 1999--2011 | nor-car-cle-htx | 22822 | 65 | 5.5% | 2.9% | 7.8 | 6.6 | 45 | 3.1% | 4.2% | 6.6 | 4.8 |
| 83 | Vince Evans | 1977--1995 | chi-rai | 9511 | 37 | 7.1% | 3.8% | 8.2 | 6.6 | 57 | 2.4% | 6% | 6.3 | 3.6 |
| 84 | John Elway | 1983--1998 | den | 56439 | 163 | 5% | 2.6% | 7.7 | 6.6 | 92 | 2.8% | 3.9% | 6.3 | 4.6 |
| 85 | Drew Bledsoe | 1993--2006 | nwe-buf-dal | 45946 | 102 | 5.1% | 1.9% | 7.4 | 6.6 | 99 | 2.4% | 4.2% | 5.9 | 4 |
| 86 | Jason Campbell | 2006--2011 | was-rai | 14417 | 32 | 3.8% | 1.7% | 7.3 | 6.6 | 39 | 3.3% | 2.7% | 6.4 | 5.3 |
| 87 | Pete Liske | 1964--1972 | nyj-den-phi | 5170 | 16 | 7% | 2.6% | 7.6 | 6.6 | 23 | 2.2% | 8.2% | 5.9 | 2.3 |
| 88 | Jeff George | 1990--2001 | clt-atl-rai-min-was | 28603 | 48 | 5.5% | 2.7% | 7.7 | 6.6 | 85 | 3.2% | 2.9% | 6.6 | 5.4 |
| 89 | Alex Smith | 2005--2011 | sfo | 13038 | 33 | 4.4% | 1.1% | 7 | 6.6 | 39 | 2.9% | 4.3% | 6 | 4.1 |
| 90 | Jim Zorn | 1976--1987 | sea-gnb-tam | 21249 | 52 | 4.9% | 2.9% | 7.8 | 6.6 | 68 | 2.8% | 5.4% | 6.1 | 3.7 |
| 91 | Lynn Dickey | 1971--1985 | oti-gnb | 23914 | 52 | 6.5% | 4.4% | 8.4 | 6.6 | 76 | 3.5% | 6.6% | 7 | 4.1 |
| 92 | Jon Kitna | 1997--2011 | sea-cin-det-dal | 30104 | 56 | 5.7% | 2% | 7.4 | 6.6 | 86 | 2.8% | 4.7% | 6.3 | 4.3 |
| 93 | Eric Hipple | 1981--1989 | det | 11009 | 30 | 6.3% | 3% | 7.8 | 6.6 | 36 | 1.8% | 5.5% | 6.4 | 4 |
| 94 | Bob Griese | 1967--1980 | mia | 26559 | 108 | 7.4% | 3.9% | 8.1 | 6.5 | 62 | 3.5% | 6.4% | 6.4 | 3.5 |
| 95 | Chris Miller | 1987--1999 | atl-ram-den | 19789 | 37 | 5.7% | 2.4% | 7.5 | 6.5 | 63 | 3.6% | 4.2% | 6.3 | 4.5 |
| 96 | Gus Frerotte | 1994--2008 | was-det-den-cin-min-mia-ram | 21666 | 58 | 5.1% | 2.7% | 7.6 | 6.5 | 60 | 2.5% | 4.1% | 6.2 | 4.4 |
| 97 | Matt Hasselbeck | 1999--2011 | gnb-sea-oti | 35891 | 91 | 5.1% | 2.4% | 7.5 | 6.5 | 80 | 3% | 3.4% | 6.3 | 4.8 |
| 98 | Tarvaris Jackson | 2006--2011 | min-sea | 7239 | 27 | 4.5% | 3.1% | 7.8 | 6.5 | 23 | 2.8% | 3.4% | 5.8 | 4.3 |
| 99 | Jeff Blake | 1992--2005 | nyj-cin-nor-rav-crd-phi-chi | 21711 | 42 | 5.1% | 2.1% | 7.4 | 6.5 | 77 | 3.6% | 3.6% | 6.3 | 4.7 |
| 100 | Tony Eason | 1983--1990 | nwe-nyj | 11703 | 35 | 5.1% | 2.8% | 7.7 | 6.5 | 31 | 3.3% | 3.4% | 6.7 | 5.2 |
| 101 | Jim Harbaugh | 1987--2000 | chi-clt-rav-sdg | 27194 | 78 | 4.8% | 2.1% | 7.3 | 6.5 | 93 | 2.3% | 3.6% | 6.2 | 4.6 |
| 102 | Don Majkowski | 1987--1996 | gnb-clt-det | 12906 | 34 | 4.8% | 2.8% | 7.7 | 6.5 | 43 | 2.6% | 4.2% | 6 | 4.2 |
| 103 | Gary Hogeboom | 1982--1989 | dal-clt-crd | 9598 | 31 | 5.1% | 2.6% | 7.5 | 6.5 | 28 | 2.7% | 6.1% | 6.7 | 4 |
| 104 | Joe Theismann | 1974--1985 | was | 26988 | 95 | 6% | 2.8% | 7.6 | 6.5 | 59 | 2.4% | 5.1% | 6.3 | 4.1 |
| 105 | Randall Cunningham | 1985--2001 | phi-min-dal-rav | 32405 | 98 | 6.1% | 2.6% | 7.6 | 6.5 | 73 | 3.1% | 3.6% | 6.3 | 4.7 |
| 106 | Byron Leftwich | 2003--2010 | jax-atl-pit-tam | 10439 | 30 | 5% | 1.6% | 7.1 | 6.5 | 31 | 2.6% | 3.5% | 6.2 | 4.7 |
| 107 | Tony Banks | 1996--2005 | ram-rav-was-htx | 15315 | 43 | 5.2% | 2.2% | 7.4 | 6.5 | 52 | 2% | 3.7% | 5.9 | 4.3 |
| 108 | Bobby Hebert | 1985--1996 | nor-atl | 22331 | 63 | 5.2% | 3% | 7.7 | 6.5 | 55 | 3.5% | 5% | 6.2 | 4.1 |
| 109 | Greg Landry | 1968--1984 | det-clt-chi | 16100 | 55 | 6.7% | 3.9% | 8.1 | 6.5 | 65 | 2.5% | 4.7% | 6.3 | 4.2 |
| 110 | Eli Manning | 2004--2011 | nyg | 30095 | 77 | 5.5% | 2.2% | 7.3 | 6.4 | 54 | 3.7% | 4.5% | 6.7 | 4.7 |
| 111 | Jay Fiedler | 1998--2005 | min-jax-mia-nyj | 12499 | 50 | 5% | 2.6% | 7.5 | 6.4 | 29 | 2.5% | 5.9% | 6 | 3.4 |
| 112 | Stan Humphries | 1989--1997 | was-sdg | 18538 | 55 | 4.4% | 2.3% | 7.4 | 6.4 | 39 | 2.2% | 5.1% | 5.9 | 3.7 |
| 113 | Jim Plunkett | 1971--1986 | nwe-sfo-rai | 28175 | 85 | 5.6% | 3.4% | 7.9 | 6.4 | 82 | 3.2% | 7.1% | 6.4 | 3.2 |
| 114 | Elvis Grbac | 1994--2001 | sfo-kan-rav | 17492 | 61 | 4.8% | 2.4% | 7.4 | 6.4 | 39 | 3.1% | 4.4% | 6.2 | 4.3 |
| 115 | Richard Todd | 1976--1985 | nyj-nor | 21636 | 51 | 5.2% | 3.6% | 7.9 | 6.4 | 70 | 3.2% | 7% | 6.2 | 3.1 |
| 116 | Steve Grogan | 1975--1990 | nwe | 27457 | 80 | 6.7% | 4.3% | 8.2 | 6.4 | 71 | 3.5% | 7.2% | 6.8 | 3.6 |
| 117 | Frank Ryan | 1960--1970 | ram-cle-was | 15833 | 66 | 9.3% | 4.4% | 8.2 | 6.4 | 42 | 4% | 6.1% | 6.6 | 3.9 |
| 118 | Carson Palmer | 2004--2011 | cin-rai | 25659 | 50 | 5.9% | 2.9% | 7.6 | 6.4 | 59 | 3.8% | 3.5% | 6.9 | 5.3 |
| 119 | Shaun Hill | 2005--2011 | min-sfo-det | 6209 | 18 | 5.5% | 1.8% | 7.1 | 6.4 | 16 | 3.2% | 2.8% | 6.3 | 5.1 |
| 120 | Mark Rypien | 1988--2001 | was-cle-ram-phi-clt | 20249 | 58 | 5.7% | 3.3% | 7.7 | 6.4 | 47 | 2.9% | 3.6% | 6.5 | 4.9 |
| 121 | Bubby Brister | 1986--2000 | pit-phi-nyj-den-min | 14801 | 47 | 5.7% | 2.3% | 7.3 | 6.4 | 51 | 1.9% | 4.3% | 5.9 | 3.9 |
| 122 | Kerry Collins | 1995--2011 | car-nor-nyg-rai-oti-clt | 42478 | 92 | 4.4% | 2.1% | 7.2 | 6.4 | 113 | 2.7% | 4% | 6.1 | 4.3 |
| 123 | Steve McNair | 1995--2007 | oti-rav | 33068 | 100 | 4.6% | 2.1% | 7.2 | 6.4 | 72 | 2.6% | 3.4% | 6.4 | 4.9 |
| 124 | Charlie Batch | 1998--2011 | det-pit | 10610 | 40 | 5.2% | 2.8% | 7.5 | 6.3 | 37 | 3.1% | 3.4% | 6.6 | 5.1 |
| 125 | Bill Nelsen | 1963--1972 | pit-cle | 15004 | 46 | 6.5% | 4.1% | 8 | 6.3 | 43 | 3% | 7.2% | 6.5 | 3.4 |
| 126 | Charley Johnson | 1961--1975 | crd-oti-den | 24410 | 68 | 7.3% | 4.7% | 8.3 | 6.3 | 70 | 3% | 5.9% | 6.3 | 3.6 |
| 127 | Steve Bartkowski | 1975--1986 | atl-ram | 24916 | 60 | 5.9% | 3.1% | 7.6 | 6.3 | 73 | 3.5% | 5.2% | 6.5 | 4.3 |
| 128 | Sam Bradford | 2010--2011 | ram | 5676 | 8 | 4.1% | 1.5% | 6.9 | 6.3 | 18 | 1.9% | 2.5% | 5.6 | 4.5 |
| 129 | Gary Danielson | 1977--1988 | det-cle | 14000 | 42 | 4.9% | 2.9% | 7.5 | 6.3 | 43 | 3.5% | 5.3% | 6.7 | 4.4 |
| 130 | Brian Sipe | 1974--1983 | cle | 23896 | 60 | 6% | 3.2% | 7.6 | 6.3 | 62 | 3% | 5.4% | 6.2 | 3.8 |
| 131 | Jay Schroeder | 1985--1994 | was-rai-cin-crd | 20854 | 71 | 5.2% | 2.7% | 7.4 | 6.3 | 50 | 2.7% | 5.3% | 6.6 | 4.3 |
| 132 | Virgil Carter | 1968--1976 | chi-cin-sdg | 5127 | 21 | 5.7% | 3% | 7.5 | 6.3 | 24 | 2.1% | 4.7% | 5.6 | 3.5 |
| 133 | Tommy Kramer | 1977--1990 | min-nor | 25651 | 64 | 5.9% | 2.8% | 7.4 | 6.3 | 66 | 2.9% | 5.7% | 6.2 | 3.7 |
| 134 | Brad Johnson | 1994--2008 | min-was-tam-dal | 30457 | 102 | 4.6% | 2.1% | 7.1 | 6.2 | 70 | 2.9% | 3.9% | 6.2 | 4.5 |
| 135 | Kelly Holcomb | 1995--2007 | tam-clt-cle-buf-min | 6453 | 9 | 5.5% | 3.4% | 7.7 | 6.2 | 29 | 4% | 4.5% | 6.5 | 4.6 |
| 136 | Quincy Carter | 2001--2004 | dal-nyj | 6491 | 20 | 4.7% | 2.2% | 7.1 | 6.2 | 18 | 1.8% | 5.3% | 5.9 | 3.5 |
| 137 | Ryan Fitzpatrick | 2005--2011 | ram-cin-buf | 10936 | 22 | 6.2% | 2.4% | 7.2 | 6.2 | 34 | 2.9% | 4.5% | 5.9 | 3.9 |
| 138 | Neil O'Donnell | 1991--2003 | pit-nyj-cin-oti | 23399 | 72 | 5% | 2% | 7 | 6.2 | 58 | 2.5% | 2.3% | 6.3 | 5.4 |
| 139 | James Harris | 1969--1979 | buf-ram-sdg | 8479 | 44 | 5.8% | 4.2% | 8 | 6.2 | 34 | 1.8% | 6.6% | 6 | 3.1 |
| 140 | Brian Griese | 1998--2008 | den-mia-tam-chi | 19440 | 53 | 5.2% | 2.8% | 7.4 | 6.2 | 40 | 3.3% | 4.2% | 6.6 | 4.7 |
| 141 | Terry Bradshaw | 1970--1983 | pit | 31822 | 125 | 7% | 4.3% | 8 | 6.2 | 62 | 3% | 7.3% | 6.1 | 2.9 |
| 142 | Bill Munson | 1964--1979 | ram-det-sea-sdg-buf | 12940 | 41 | 6.4% | 2.6% | 7.2 | 6.2 | 58 | 2.8% | 5% | 6.1 | 3.9 |
| 143 | Steve Tensi | 1966--1970 | sdg-den | 5558 | 15 | 8.5% | 4.4% | 8 | 6.1 | 29 | 3.5% | 5.7% | 5.8 | 3.3 |
| 144 | Jeff Kemp | 1981--1991 | ram-sfo-sea-phi | 6403 | 28 | 6.7% | 2.9% | 7.3 | 6.1 | 26 | 1.9% | 5.5% | 6.3 | 3.8 |
| 145 | Ty Detmer | 1993--2001 | gnb-phi-sfo-cle-det | 6499 | 18 | 4.9% | 2.5% | 7.1 | 6.1 | 24 | 2.7% | 4.6% | 6.5 | 4.4 |
| 146 | Billy Wade | 1960--1966 | ram-chi | 11390 | 34 | 6.1% | 3.5% | 7.6 | 6.1 | 33 | 3.8% | 6.3% | 6.4 | 3.7 |
| 147 | Dave M. Brown | 1992--2000 | nyg-crd | 10304 | 29 | 4.1% | 2.5% | 7.2 | 6.1 | 42 | 1.9% | 4.2% | 5.8 | 4 |
| 148 | Mark Sanchez | 2009--2011 | nyj | 10364 | 30 | 5.1% | 2% | 6.9 | 6.1 | 22 | 2.9% | 5% | 6.2 | 4 |
| 149 | Joe Ferguson | 1973--1990 | buf-det-tam-clt | 30631 | 83 | 6.4% | 3.1% | 7.4 | 6.1 | 107 | 3% | 5.8% | 6.1 | 3.5 |
| 150 | Norm Snead | 1961--1976 | was-phi-min-nyg-sfo | 30797 | 57 | 6.9% | 4.3% | 7.9 | 6.1 | 114 | 3.5% | 6.7% | 6.7 | 3.7 |
| 151 | Dennis Shaw | 1970--1975 | buf-crd | 6347 | 12 | 5.9% | 5.3% | 8.4 | 6.1 | 34 | 2.8% | 8.1% | 6.5 | 2.9 |
| 152 | Vince Ferragamo | 1977--1986 | ram-buf-gnb | 12564 | 35 | 7.1% | 3.7% | 7.6 | 6.1 | 42 | 2.9% | 7.1% | 6.5 | 3.4 |
| 153 | Jake Plummer | 1997--2006 | crd-den | 30593 | 74 | 4.7% | 2.5% | 7.1 | 6.1 | 75 | 2.9% | 4.8% | 6.4 | 4.3 |
| 154 | Tommy Maddox | 1992--2005 | den-ram-nyg-pit | 8754 | 27 | 5.9% | 3.2% | 7.4 | 6.1 | 28 | 2.6% | 5.3% | 6.1 | 3.7 |
| 155 | Daryle Lamonica | 1963--1974 | buf-rai | 21082 | 104 | 7.8% | 4.6% | 8 | 6.1 | 37 | 3% | 7.3% | 6 | 2.8 |
| 156 | Kyle Orton | 2005--2011 | chi-den-kan | 14532 | 36 | 4.5% | 1.9% | 6.8 | 6.1 | 35 | 3% | 3.1% | 6.4 | 5 |
| 157 | Roman Gabriel | 1962--1977 | ram-phi | 29780 | 87 | 5.7% | 2.6% | 7.1 | 6.1 | 79 | 3.2% | 4% | 5.8 | 4.1 |
| 158 | Bob Lee | 1969--1980 | min-atl-ram | 5416 | 60 | 5.9% | 4.8% | 8.1 | 6.1 | 24 | 1.2% | 6.2% | 5 | 2.3 |
| 159 | David Carr | 2002--2010 | htx-car-nyg-sfo | 14433 | 32 | 3.4% | 2.2% | 7 | 6.1 | 61 | 2.7% | 3.4% | 6.2 | 4.7 |
| 160 | Jack Trudeau | 1986--1995 | clt-nyj-car | 10494 | 25 | 3.2% | 2.4% | 7.1 | 6 | 43 | 2.3% | 5.2% | 5.8 | 3.5 |
| 161 | Steve Fuller | 1979--1986 | kan-chi | 7454 | 33 | 4% | 3.5% | 7.5 | 6 | 29 | 1.9% | 4% | 6.2 | 4.5 |
| 162 | Danny White | 1976--1988 | dal | 24243 | 124 | 5.8% | 4% | 7.7 | 6 | 59 | 4% | 5.3% | 6.7 | 4.4 |
| 163 | Archie Manning | 1971--1984 | nor-oti-min | 23911 | 37 | 4.4% | 3.2% | 7.4 | 6 | 110 | 3.1% | 5.1% | 6.3 | 4.1 |
| 164 | Ken Stabler | 1970--1984 | rai-oti-nor | 30579 | 110 | 6.6% | 4.6% | 7.9 | 6 | 64 | 3% | 7.3% | 6.5 | 3.3 |
| 165 | Doug Williams | 1978--1989 | tam-was | 18108 | 49 | 5.4% | 2.8% | 7.2 | 6 | 45 | 3.1% | 4.8% | 6.5 | 4.4 |
| 166 | Joe Pisarcik | 1977--1984 | nyg-phi | 5552 | 25 | 4.6% | 4.1% | 7.8 | 6 | 32 | 2.1% | 5.7% | 5.7 | 3.1 |
| 167 | Jim McMahon | 1982--1996 | chi-sdg-phi-min-crd-gnb | 19260 | 86 | 4.5% | 3.3% | 7.4 | 6 | 40 | 2.6% | 3.8% | 6.4 | 4.8 |
| 168 | Milt Plum | 1960--1969 | cle-det-ram-nyg | 13335 | 46 | 6.9% | 4.9% | 8.1 | 6 | 40 | 3.1% | 6% | 6.3 | 3.7 |
| 169 | Ron Jaworski | 1974--1989 | ram-phi-mia-kan | 29859 | 89 | 5.4% | 2.9% | 7.2 | 6 | 79 | 3.4% | 4.8% | 6.5 | 4.4 |
| 170 | Rodney Peete | 1989--2004 | det-dal-phi-was-car | 16636 | 55 | 4.3% | 3.4% | 7.5 | 6 | 48 | 2.2% | 4.3% | 6.5 | 4.6 |
| 171 | Vinny Testaverde | 1987--2007 | tam-cle-rav-nyj-dal-nwe-car | 47553 | 102 | 5.3% | 3.1% | 7.3 | 6 | 137 | 3.3% | 4.5% | 6.7 | 4.7 |
| 172 | Billy Kilmer | 1961--1978 | sfo-nor-was | 21555 | 88 | 6.7% | 3.7% | 7.5 | 6 | 81 | 3.3% | 5.9% | 6.1 | 3.5 |
| 173 | Tim Couch | 1999--2003 | cle | 11131 | 22 | 5.5% | 3.2% | 7.3 | 6 | 40 | 2.7% | 4.3% | 6 | 4.1 |
| 174 | Erik Kramer | 1987--1999 | atl-det-chi-sdg | 16336 | 38 | 4.9% | 2.4% | 7 | 6 | 48 | 3.4% | 4.1% | 6.5 | 4.7 |
| 175 | Trent Dilfer | 1994--2007 | tam-rav-sea-cle-sfo | 21489 | 68 | 5.3% | 2.7% | 7.1 | 6 | 65 | 2% | 5.1% | 6 | 3.7 |
| 176 | Mike Pagel | 1982--1993 | clt-cle-ram | 9593 | 22 | 4.5% | 2.6% | 7.1 | 6 | 53 | 2.9% | 4.9% | 6 | 3.8 |
| 177 | Kordell Stewart | 1995--2005 | pit-chi-rav | 15490 | 76 | 3.5% | 2.1% | 6.8 | 5.9 | 54 | 2.7% | 5.6% | 5.5 | 3 |
| 178 | Chad Henne | 2008--2011 | mia | 7114 | 14 | 3.6% | 1.7% | 6.6 | 5.9 | 20 | 2.4% | 4.6% | 6.7 | 4.7 |
| 179 | Jim Hart | 1966--1984 | crd-was | 35156 | 93 | 5.7% | 4% | 7.6 | 5.9 | 103 | 2.9% | 5.5% | 6.2 | 3.8 |
| 180 | Vince Young | 2006--2011 | oti-phi | 9102 | 35 | 4.5% | 3% | 7.1 | 5.9 | 27 | 2.2% | 4.9% | 6.5 | 4.3 |
| 181 | Josh McCown | 2002--2011 | crd-det-rai-car-chi | 6998 | 15 | 4.2% | 1.6% | 6.5 | 5.9 | 36 | 2.9% | 5.2% | 6.2 | 3.9 |
| 182 | Mark Malone | 1981--1989 | pit-sdg-nyj | 10733 | 29 | 6.3% | 3% | 7.1 | 5.8 | 44 | 2.3% | 5.9% | 5.8 | 3.2 |
| 183 | Babe Parilli | 1960--1969 | rai-nwe-nyj | 18778 | 64 | 7.1% | 4.1% | 7.5 | 5.8 | 47 | 3.2% | 7.5% | 5.9 | 2.5 |
| 184 | Don Strock | 1974--1988 | mia-cle | 5913 | 37 | 7.1% | 3.6% | 7.3 | 5.8 | 30 | 4.5% | 7.3% | 6.6 | 3.3 |
| 185 | Dick Wood | 1962--1966 | sdg-nyj-rai-mia | 7153 | 17 | 7.1% | 3.4% | 7.2 | 5.8 | 28 | 2.6% | 7.3% | 5.3 | 2.1 |
| 186 | Shaun King | 1999--2004 | tam-crd | 5057 | 19 | 5.9% | 2.3% | 6.7 | 5.8 | 16 | 1.1% | 4.1% | 5.5 | 3.7 |
| 187 | Pat Haden | 1976--1981 | ram | 10024 | 41 | 4.4% | 2.9% | 7 | 5.8 | 26 | 3.1% | 7.1% | 6.4 | 3.3 |
| 188 | Bobby Douglass | 1969--1978 | chi-sdg-nor-gnb | 6493 | 16 | 6.2% | 3.5% | 7.2 | 5.8 | 57 | 2.1% | 5.8% | 5.1 | 2.5 |
| 189 | Cotton Davidson | 1960--1968 | kan-rai | 11451 | 30 | 6.5% | 4.1% | 7.5 | 5.7 | 40 | 2.9% | 7.2% | 6.3 | 3.1 |
| 190 | Steve Bono | 1985--1999 | min-pit-sfo-kan-gnb-ram-car | 10576 | 49 | 4.6% | 1.8% | 6.4 | 5.7 | 26 | 2.5% | 3.7% | 5.7 | 4.1 |
| 191 | Marc Wilson | 1980--1990 | rai-nwe | 14526 | 39 | 5.8% | 4% | 7.4 | 5.7 | 42 | 2.8% | 5.8% | 6.5 | 3.9 |
| 192 | Billy Joe Tolliver | 1989--1999 | sdg-atl-oti-kan-nor | 10760 | 24 | 5% | 2.6% | 6.8 | 5.7 | 53 | 3% | 4.1% | 6.1 | 4.4 |
| 193 | Rick Mirer | 1993--2003 | sea-chi-nyj-sfo-rai | 11969 | 27 | 3.9% | 2.4% | 6.6 | 5.6 | 52 | 1.8% | 4.4% | 5.5 | 3.5 |
| 194 | Steve Ramsey | 1970--1976 | nor-den | 6437 | 23 | 5.4% | 5.9% | 8.1 | 5.6 | 28 | 2.4% | 6.5% | 6.3 | 3.4 |
| 195 | Jacky Lee | 1960--1969 | oti-den-kan | 6191 | 30 | 9% | 7% | 8.5 | 5.5 | 29 | 4% | 6.9% | 6.6 | 3.6 |
| 196 | Hugh Millen | 1987--1995 | ram-atl-nwe-den | 6440 | 8 | 2.3% | 4.2% | 7.4 | 5.5 | 30 | 2.4% | 3.6% | 6.8 | 5.2 |
| 197 | Jim Ninowski | 1960--1969 | det-cle-was-nor | 6953 | 33 | 4.3% | 4.5% | 7.5 | 5.5 | 27 | 2.6% | 7.4% | 6.2 | 2.9 |
| 198 | Dave Wilson | 1981--1988 | nor | 7007 | 16 | 4.2% | 5.2% | 7.8 | 5.5 | 37 | 3.1% | 5.5% | 6.2 | 3.8 |
| 199 | Kyle Boller | 2003--2011 | rav-ram-rai | 8931 | 30 | 4.1% | 1.7% | 6.2 | 5.5 | 36 | 2.6% | 4.7% | 5.7 | 3.6 |
| 200 | Joey Harrington | 2002--2007 | det-mia-atl | 14693 | 27 | 4.4% | 2.2% | 6.4 | 5.5 | 55 | 2.5% | 3.8% | 5.5 | 3.9 |
| 201 | Todd Blackledge | 1983--1989 | kan-pit | 5366 | 22 | 5.2% | 3.4% | 6.9 | 5.5 | 22 | 1.7% | 5.2% | 5.3 | 2.9 |
| 202 | Mike Tomczak | 1985--1999 | chi-gnb-cle-pit | 16963 | 79 | 3.8% | 3.9% | 7.1 | 5.5 | 59 | 3.4% | 5.3% | 6.6 | 4.2 |
| 203 | Mike Livingston | 1968--1979 | kan | 11295 | 37 | 4.4% | 3.2% | 6.8 | 5.5 | 52 | 2.4% | 5.7% | 6.2 | 3.7 |
| 204 | Danny Kanell | 1996--2003 | nyg-atl-den | 5328 | 14 | 5.3% | 2.5% | 6.5 | 5.5 | 25 | 2.2% | 4% | 4.9 | 3.2 |
| 205 | Steve Dils | 1980--1988 | min-ram-atl | 5816 | 18 | 3.5% | 2.6% | 6.5 | 5.4 | 29 | 2.4% | 3.6% | 5.7 | 4.1 |
| 206 | Jack Thompson | 1979--1984 | cin-tam | 5329 | 15 | 5.3% | 1.8% | 6.1 | 5.4 | 30 | 3.5% | 6.2% | 6.3 | 3.6 |
| 207 | Kent Graham | 1992--2001 | nyg-crd-pit-was | 7801 | 27 | 4.4% | 1.6% | 6 | 5.4 | 33 | 1.8% | 3.1% | 5.7 | 4.3 |
| 208 | David Woodley | 1980--1985 | mia-pit | 9203 | 38 | 4.4% | 3.5% | 6.9 | 5.4 | 24 | 3% | 7.4% | 6.3 | 3.1 |
| 209 | Randy Johnson | 1966--1976 | atl-nyg-was-gnb | 8329 | 14 | 7.8% | 4.4% | 7.2 | 5.4 | 58 | 3.2% | 7.6% | 6.3 | 3 |
| 210 | Rex Grossman | 2003--2011 | chi-htx-was | 11015 | 30 | 4.7% | 3.3% | 6.8 | 5.4 | 27 | 2.3% | 4.3% | 6.2 | 4.3 |
| 211 | Jim Miller | 1995--2002 | pit-chi | 6410 | 20 | 3.9% | 2.9% | 6.6 | 5.3 | 18 | 3% | 3.2% | 5.6 | 4.3 |
| 212 | Dan Pastorini | 1971--1983 | oti-rai-ram-phi | 19469 | 62 | 4.6% | 4.2% | 7.1 | 5.3 | 81 | 2.5% | 6.1% | 5.4 | 2.7 |
| 213 | Paul McDonald | 1980--1984 | cle | 5550 | 12 | 3.8% | 3.4% | 6.8 | 5.3 | 23 | 2.8% | 5.1% | 7 | 4.7 |
| 214 | George Blanda | 1960--1975 | oti-rai | 22029 | 142 | 8.4% | 6% | 7.8 | 5.3 | 79 | 3.9% | 8% | 6.1 | 2.5 |
| 215 | Jack Kemp | 1960--1969 | sdg-buf | 22256 | 71 | 4.6% | 5.2% | 7.5 | 5.2 | 46 | 2.2% | 7.1% | 6.2 | 3 |
| 216 | David Whitehurst | 1977--1983 | gnb | 6205 | 21 | 6.1% | 5.3% | 7.4 | 5.1 | 30 | 1.1% | 5.4% | 5.7 | 3.3 |
| 217 | Zeke Bratkowski | 1960--1971 | chi-ram-gnb | 8005 | 30 | 4.7% | 5.5% | 7.5 | 5.1 | 45 | 3.5% | 8.9% | 6.6 | 2.7 |
| 218 | Steve Spurrier | 1967--1976 | sfo-tam | 6878 | 48 | 6.4% | 4.9% | 7.1 | 5.1 | 53 | 2.2% | 5.2% | 5.4 | 3.1 |
| 219 | Joe Kapp | 1967--1970 | min-nwe | 6746 | 26 | 6.6% | 6.2% | 7.7 | 5.1 | 26 | 2.2% | 8.1% | 5.7 | 2.1 |
| 220 | Bob Avellini | 1975--1984 | chi | 7288 | 30 | 4.2% | 5.9% | 7.5 | 5 | 36 | 2.3% | 6.8% | 5.7 | 2.7 |
| 221 | Frank Tripucka | 1960--1963 | den | 7676 | 13 | 5.1% | 5.9% | 7.5 | 5 | 29 | 3.3% | 6.7% | 5.2 | 2.3 |
| 222 | Pete Beathard | 1964--1973 | kan-oti-crd-ram | 8544 | 40 | 4.5% | 5.3% | 7.2 | 4.9 | 34 | 2.5% | 7.3% | 5.6 | 2.4 |
| 223 | Gary Cuozzo | 1963--1972 | clt-nor-min-crd | 7688 | 47 | 4.6% | 3.9% | 6.5 | 4.9 | 35 | 2.9% | 5.7% | 6 | 3.5 |
| 224 | Al Dorow | 1960--1962 | nyj-buf | 5732 | 14 | 5.7% | 5% | 6.9 | 4.8 | 18 | 4.7% | 8.5% | 5.8 | 2.1 |
| 225 | Steve Walsh | 1989--1999 | dal-nor-chi-ram-tam-clt | 8248 | 27 | 3.9% | 3.2% | 6.2 | 4.8 | 34 | 2.4% | 4.5% | 5.9 | 3.9 |
| 226 | Mike Phipps | 1970--1981 | cle-chi | 10806 | 50 | 4.5% | 3.7% | 6.4 | 4.8 | 51 | 1.7% | 8.4% | 5.3 | 1.6 |
| 227 | Scott Brunner | 1980--1985 | nyg-crd | 6843 | 16 | 3.7% | 3.7% | 6.3 | 4.7 | 29 | 3% | 5.8% | 6.2 | 3.6 |
| 228 | Jack Concannon | 1964--1975 | phi-chi-gnb-det | 6270 | 27 | 4.6% | 4.3% | 6.5 | 4.6 | 32 | 2.5% | 6.8% | 5.1 | 2.1 |
| 229 | Mike Taliaferro | 1964--1972 | nyj-nwe-buf | 5241 | 19 | 8.2% | 4.7% | 6.3 | 4.4 | 41 | 2.2% | 7.2% | 5.1 | 1.9 |
[continue reading…]
Tagged as:
Aaron Rodgers,
Dan Marino,
Joe Montana,
Peyton Manning,
quarterbacks,
Tom Brady
{ }
by Chase Stuart
on August 31, 2012

The original standard for postseason success.
On Wednesday, I explained the
methodology for grading each quarterback in each season. Yesterday, I came up with an
all-time career list of the best quarterbacks based on their regular season play. Today, a look at playoff performances.
Using the same formula, we can grade each quarterback in each game and adjust for era . However, it should be obvious that the sample sizes here are incredibly small, and the stats are even less likely to tell the true story when looking at just one game. Strength of schedule becomes a significant factor here, as well. But, caveats aside, there’s a lot we can do with playoff data. For example, we can rank every quarterback performance in Super Bowl history:
If you type Montana’s name into the search box, you can see that he has the 1st, 4th, 11th and 27th best performance in Super Bowl history. The best performance in a losing effort goes to
Jake Delhomme, who shredded the Patriots secondary in the second half of Super Bowl XXXVIII (he began the game 1 for 9 for 1 yard). The worst performance in a winning effort, unsurprisingly, goes to
Ben Roethlisberger in Super Bowl XL, although
Joe Theismann against the Dolphins gets an honorable mention. Worst performance overall goes to
Kerry Collins, although
Craig Morton’s 4 interceptions and 39 yards on 15 attempts against his former team in Super Bowl XII could give Collins a run for his money.
What about best championship game performances in the pre-Super Bowl era?
[continue reading…]
Tagged as:
GQBOAT,
Joe Montana,
Kurt Warner,
Peyton Manning,
Playoffs,
Tom Brady
{ }
by Chase Stuart
on August 29, 2012
In 2006, I took a stab at ranking every quarterback in NFL history. Two years later, I acquired more data and made enough improvements to merit publishing an updated and more accurate list of the best quarterbacks the league has ever seen. In 2009, I tweaked the formula again, and published a set of career rankings, along with a set of strength of schedule, era and weather adjustments, and finally career rankings which include those adjustments and playoff performances.
If nothing else, that was three years ago, so the series was due for an update. I’ve also acquired more data, enabling me to tweak the formula to better reflect player performance. But let’s start today with an explanation of the methodology I’m using. To rank a group of players, you need to decide which metric you’re ordering the list by. I’ll get to all of the criteria I’m not using in a little bit, but the formula does use each of the following: pass attempts, passing touchdowns, passing yards, interceptions, sacks, sack yards lost, fumbles, fumbles recovered, rush attempts, rushing yards and rushing touchdowns. Most importantly, the formula is adjusted for era and league.
Two of the best quarterbacks ever.
So where do we begin? We start with plain old yards per attempt. I then incorporate sack data by removing sack yards from the numerator and adding sacks to the denominator . To include touchdowns and pass attempts, I gave a quarterback
20 yards for each passing touchdown and subtracted 45 yards for each interception. This calculation — (Pass Yards + 20 * PTD – 45 * INT – Sack Yards Lost) / (Sacks + Pass Attempts) forms the basis for Adjusted Net Yards per Attempt, one of the key metrics I use to evaluate quarterbacks.
For purposes of this study, I did some further tweaking. I’m including rushing touchdowns, because our goal is to measure quarterbacks as players. There’s no reason to separate rushing and passing touchdowns from a value standpoint, so all passing and rushing touchdowns are worth 20 yards and are calculated in the numerator of Adjusted Net Yards per Attempt. To be consistent, I also include rushing touchdowns in the denominator of the equation. This won’t change anything for most quarterbacks, but feels right to me. A touchdown is a touchdown.
[continue reading…]
Tagged as:
Aaron Rodgers,
Dan Marino,
Eli Manning,
GQBOAT,
Joe Montana,
Johnny Unitas,
Peyton Manning,
quarterbacks,
Steve Young,
Tom Brady
{ }