by Chase Stuart
on August 31, 2015
There are many advanced projection systems that do a great job of projecting teams wins. I’m not interested in recreating that or coming up with my own system, but rather setting a baseline for what a projection system should hope to accomplish. You’ll see what I mean in a few moments.
Test #1: Every Team Is The Same
This is the simplest baseline: let’s project each team to go 8-8. If you did that in every season from 1989 to 2014, your model would have been off by, on average, 2.48 wins per team. This is calculated by taking the absolute value of the difference between 0.500 and each team’s actual winning percentage, and multiplying that result by 16. So that should be the absolute floor for any projection model: you have to come closer than that.
Test #2: Every Team Does What They Did Last Year
Looking at all teams from 1990 to 2014, I calculated their winning percentages in that season (Year N) and in the prior season (Year N-1). If you used the previous year’s record to project this year’s record, you would have been off by, on average, 2.84 wins per team. That’s right: you are better off predicting every team to go 8-8 than to predict every team to repeat what they did last season. [continue reading…]
{ }
by Chase Stuart
on August 30, 2015
Yesterday, we looked at the most memorable plays for each AFC team. Today, we switch to the NFC, and let’s begin in the NFC East.
Dallas Cowboys: Emmitt Smith, with one good shoulder, runs for 10 yards to put Dallas in field goal range against the Giants in week 17, 1993
For a franchise with as proud a history as the Cowboys, there are some painful memories to consider: the Tony Romo bobbled snap against the Seahawks, Leon Lett against the Bills (and Dolphins), the ending of the Ice Bowl, the Tom Brown end zone interception of Don Meredith to clinch the 1966 NFL championship game, the Dez Bryant “incomplete” pass last year, and Jackie Harris starring in the Sickest Man in America.
But when it comes to the Cowboys, the mind immediately goes to the dynasty built in the ’90s. That team cemented its place in the game’s history by repeating as Super Bowl champions in 1993, and much of the credit for the title goes to winning in week 17 against the Giants. A loss in that game would have made the Cowboys a Wild Card team, while a win gave Dallas the number one seed. And that game turned out to be the most memorable of Emmitt Smith’s career. Playing much of the game on shoulder, he totaled a career high 41 touches. Here’s the play in question, and Smith carrying Dallas to victory that day remains the most iconic memory of one of the franchise’s greatest players. A close runner up: the original Hail Mary, from Roger Staubach to Drew Pearson against the vikings in the 1975 playoffs. But that game didn’t lead to a Super Bowl championship. [continue reading…]
{ }
by Chase Stuart
on August 29, 2015
The other day, the Sporting News produced a slideshow of the most iconic plays in franchise history for each of the 32 teams in the NFL. That’s a fun idea, and something I think this community would enjoy thinking about, so I wanted to spend this weekend discussing what we view as the most memorable/iconic/incredible plays for each franchise. For each team, I’ll cast my opinion (which may or may not be the same as what the SN chose), but I’m really more interested in your thoughts. Today, we’ll do the AFC; tomorrow, the NFC. Let’s begin in the AFC East, with a franchise that’s most memorable play was probably a painful one.
Buffalo Bills: Scott Norwood, Wide Right, Super Bowl XXV [continue reading…]
{ }
by Chase Stuart
on August 28, 2015
Seven and a half years ago, I asked the question, why do teams run the ball? Today, I want to revisit that post, given that a lot has happened over the last seven and a half years.
Let’s begin my analyzing league-wide pass and rush efficiency. To measure rush efficiency, we will use Adjusted Yards per Carry, which is calculated as follows:
(Rush Yards + 11 * Rush TDs + 9 * Rush First Downs) / (Rushes)
For passing, we will use a modified version of ANY/A by also giving credit for first downs. Here’s the formula:
(Gross Pass Yards – SackYardsLost + 11 * Pass TDs + 9 * Pass First Downs – 45 * INTs) / (Pass Attempts + Sacks)
[continue reading…]
Tagged as:
1978 Rules Changes
{ }
by Chase Stuart
on August 27, 2015
Yesterday, we looked at offensive Pass Identity grades. Today, we are going to use the same process to analyze the data for defenses. Yesterday’s post is required reading to understand how Pass Identity grades are calculated, but here’s one update. While we can use the same numbers for Game Script (including the 3.27 number for standard deviation and 0 for average), that’s not the case for defensive Pass Ratio. There, while the average is roughly the same at 58.29%, the standard deviation is much smaller at 2.84% (it was 4.66% for the offenses).
Let’s use the Lions as an example. Detroit had an average Game Script of +0.4 last year, meaning the Lions were leading by, on average, 0.4 points during every second of every game. That was 0.11 standard deviations above average. [continue reading…]
Tagged as:
Game Scripts,
Pass Identity
{ }
by Chase Stuart
on August 26, 2015
As we did last year, today I’m going to calculate the final 2014 Game Scripts and Pass Identity data. Every week during the season, I write about the Game Scripts from the previous weekend. For new readers, the term Game Script is just shorthand for the average points differential for a team over every second of each game. You can check out the updated Game Scripts page, which shows the results of all 256 games from 2014, and you can read the history behind the metric here.
Let’s begin by looking at the 2014 Game Scripts numbers. The Packers held an average lead of 6.9 points during their regular season games, the highest average in all of football. Because Green Bay was so good, Aaron Rodgers and the Packers weren’t very pass-happy; in fact, the Packers ranked just 21st in pass attempts. That’s why Jordy Nelson and Randall Cobb, as good as their raw numbers were, look even better in some advanced metrics. In some ways, the Packers were the victims of their own success last year, as Green Bay was — by far — the best first half team in the NFL in 2014. That led to the high Game Script number, and a lot of casual dress second halves. [continue reading…]
Tagged as:
Game Scripts,
Pass Identity
{ }
by Chase Stuart
on August 25, 2015
Yesterday, I looked at a new way to measure punting statistics. Let’s review by using the top single performance from 2014, which surprisingly came from Jets second-year punter Ryan Quigley in a 31-0 loss to San Diego. Yes, the Jets were terrible, but that doesn’t mean it was Quigley’s fault! He had 8 punts, and all but 1 was an above-average punt. Let’s review:
- Punt 1: Quigley punts from the Jets 39-yard line. On average, when a team punts at the 39, the opposing team takes over at the “78.9” yard line, which means just a hair in front of that team’s 21-yard line. Instead, Quigley pinned San Diego back to their 11; that 51-yard punt therefore provided 11.1 more yards of field position than we would expect.
- Punt 2 was a 44-yard punt from the Jets 29. On average, punts from the 29 pin the other team back at their 29.7 yard line. The 44-yarder had no return, giving San Diego the ball at their 27, so Quigley added 2.3 yards of field position over average.
- Punt 3 was from the Jets 20, so San Diego would have been expected to take over at their 38.4-yard line. Instead, following a whopping 64 yard punt, a 2-yard return, and 9-yard lost by San Diego due to an illegal block, and the Chargers were back at their own 9-yard line. That goes down as +20.4 for Quigley. Is it fair to give the punter credit when the return team loses yards on a penalty? I don’t know, although I’m not sure if that’s more or less fair than return yards that team gains (or yards the punting team loses due to a penalty). Think of these more as punt unit ratings than punter ratings, I guess.
- Okay, even I don’t have the energy to go through all 8 punts. But on the other 5, Quigley gained 16.8 yards over expectation, 11.9, 10.4, 10.2, and on one bad punt, -6.0.
[continue reading…]
Tagged as:
Punters,
Special Teams
{ }
by Chase Stuart
on August 24, 2015
Yes, you read that title right. Not only is today about punters, guess what? Tomorrow will be, too. Today, I want to dive into punting statistics. The two key numbers the media focuses on with punters are usually net punting average and gross punting average. But both numbers are pretty heavily influenced by field position. [continue reading…]
Tagged as:
Punters,
Special Teams
{ }
by Chase Stuart
on August 23, 2015
We spend a lot of time focusing on pass offenses, but not necessarily as much looking at the other side of the ball. After running my Rearview ANY/A numbers, it struck me just how bad Washington’s pass defense was last year. And if it feels like that team has struggled against the pass for awhile, well, that’s because it has. Over the last five years, there’s been no worse pass defense in the NFL.
As regular readers know, ANY/A stands for Adjusted Net Yards per Attempt, which is Yards per Attempt with a 45-yard penalty for interceptions, a 20-yard bonus for passing touchdowns, and includes sack data. Relative ANY/A simply subtracts the league average ANY/A from each team’s individual ANY/A. Last year, Washington’s pass defense allowed 7.88 ANY/A while the league average was 6.14; as a result, the team’s pass defense had a RANY/A of -1.7. In fact, the team’s defense has had a negative RANY/A in each of the last five years. [continue reading…]
Tagged as:
RANY/A
{ }
by Chase Stuart
on August 22, 2015
Regular readers know that I’m one of the writers at Footballguys.com. If you are a hardcore fantasy footballer (or daily fantasy sports player), you probably already know that Footballguys.com is the single best source for fantasy football information. If you are a more casual fantasy football player, you’ll find that the tools available at Footballguys will make life much, much easier for you to win your league(s). Either way, I think a Footballguys Insider PRO subscription is a fantastic value for $32.95. Also fantastic values: the Footballguys Draft Dominator for mobile devices, which costs $4.99.
I don’t make extra money if more people sign up for Footballguys or buy an app, but I hope my readers subscribe because I think a subscription is a really good deal. If you play fantasy football and want to win your competitive league or save hours doing research for your local league, a Footballguys subscription is well worth it. For $32.95, you get: [continue reading…]
Tagged as:
Footballguys.com
{ }
by Chase Stuart
on August 21, 2015
As I did last year, I want to analyze the rushing stats for each team in 2014 using a metric known as Adjusted Rushing Yards per Carry. Thanks to the help of Brian Burke of Advanced Football Analytics (formerly Advanced NFL Stats), we were able to conclude that the value of a first down was about 9 yards. And since we’ve previously determined that the marginal value of a touchdown is 20 yards, this means Adjusted Rushing Yards per Carry is pretty easy to calculate. Also, since Bryan Frye crunched the numbers, we might as well exclude all kneels from the process, too.
One thing to keep in mind (which I have forgotten in the past): since the NFL records-keeping process labels touchdowns as first downs, you should only assign 11 yards per touchdown if you are already giving 9 yards to all 1st downs. And since kneels are marked down as runs, you must back those out, too. As a result, here’s the formula to use:
Adjusted Rushing Yards per Carry = (Rush Yards + 11 * Rush TDs + 9 * Rush First Downs – Kneel Yards Lost ) / (Rushes – Kneels)
If we use this metric to analyze the 2014 season, how would it look? Seattle was by far the top rushing team in the NFL last year, rushing for 2,762 yards and 20 touchdowns on 525 carries, good for a 5.26 yards per carry average. But 19 of those 525 carries were kneels, and they went for -20 yards. In addition, Seattle not only led the league with 144 rushing first downs, the Seahawks gained a first down on 28.5% of non-kneel carries, also the highest mark in the NFL. Seattle averaged 8.49 Adjusted Rushing Yards per Carry, while the NFL average was 6.63. Since the Seahawks averaged 1.86 ARY/C over average for 506 non-kneel carries, that means Seattle rushed for 941 rushing yards (1.86 * 506) above average.
The full list for all 2014 teams, below: [continue reading…]
{ }
by Chase Stuart
on August 20, 2015
On Monday, I looked at the SOS-adjusted Adjusted Net Yards per Attempt ratings of every quarterback and defense in the NFL in 2014. And just like last year, I want to follow that post by looking at the best and worst games of the year, from the perspectives of both the quarterbacks and the defenses.
Let’s start with the top 100 passing games from 2014. The top spot belongs to Ben Roethlisberger, for his scorched-earth performance against Indianapolis. The Steelers star threw for 522 yards and 6 touchdowns on just 49 pass attempts with no sacks or interceptions. For the game, that means Roethlisberger averaged 13.10 ANY/A. The league-average last season was 6.13 ANY/A, which means Roethlisberger was 6.97 ANY/A above average. Now since the game came against a Colts team that was 0.28 ANY/A worse than average last year, we have to reduce that by the same number. That puts Roethlisberger at 6.70 ANY/A above expectation; multiply that by his 49 dropbacks, and he produced 328 adjusted net yards of value above average after adjusting for strength of schedule. That was easily the top game of 2014. [continue reading…]
{ }
by Chase Stuart
on August 19, 2015
The ’90s Cowboys had the Triplets — Troy Aikman, Emmitt Smith, and Michael Irvin — that helped define the team’s dynasty. Well, the modern Packers have not just an outstanding quarterback, a great running back, and one excellent wide receiver: they have two excellent wide receivers.
Let’s take some “basic” stats and see how the 2014 Packers fared:
- To measure quarterbacks, let’s use Adjusted Net Yards per Attempt. Aaron Rodgers ranked 1st in ANY/A last year.
- To measure running backs, we can use the most basic measurement out there: rushing yards. Eddie Lacy ranked a respectable 7th in rushing yards.
- To measure wide receivers (and tight ends), let’s use Adjusted Catch Yards, which is receiving yards with a 5-yard bonus for receptions and a 20-yard bonus for receiving touchdowns. Jordy Nelson ranked 3rd in ACY last year, while Randall Cobb ranked 8th.
Where does that rank since 1970? Well, one thing we could do is just add the ranks: 1 + 7 + 3 + 8 = 19. That’s a pretty good score for a group of four players, but it’s not the best ever. It’s tied with two other teams for 6th best ever. Can you guess which team since 1970 has the best score using this methodology? While you think about it, let’s look at the other teams to produce a score of less than 20. [continue reading…]
{ }
by Chase Stuart
on August 18, 2015
Every year at Footballguys.com, I publish an article called Rearview QB, which adjusts the fantasy football statistics for quarterbacks (and defenses) for strength of schedule. I’ve also done the same thing for years (including last season) using ANY/A instead of fantasy points, which helps us fully understand the best and worst real life performances each year. Today I deliver the results from 2014.
Let’s start with the basics. Adjusted Net Yards per Attempt is defined as (Passing Yards + 20 * Passing Touchdowns – 45 * Interceptions – Sack Yards Lost) divided by (Pass Attempts plus Sacks). ANY/A is my favorite explanatory passing statistic — it is very good at telling you the amount of value provided (or not provided) by a passer in a given game, season, or career.
Let’s start with some basic information. The league average ANY/A for quarterbacks in 2014 was 6.13, the highest in NFL history. Aaron Rodgers led the way with a 8.65 ANY/A average, the highest rate in the league among the 39 quarterbacks who started at least five games. Since the Packers quarterback had 520 pass attempts and was dropped for 28 sacks, that means he was producing 2.52 ANY/A (i.e., his Relative ANY/A) over league average on 548 dropbacks. That means Rodgers is credited with 1,383 Adjusted Net Yards above average, a metric labeled “VALUE” in the table below. That was the most in the NFL last year: [continue reading…]
Tagged as:
Rearview QB
{ }
by Chase Stuart
on August 17, 2015
Back in December 2009, Jason Lisk wrote about a recent trend in the NFL: quarterbacks throwing for 300 passing yards and actually winning. Jason wondered whether that was something fluky, or a sign of the shifting nature of the NFL. With the benefit of hindsight, I think the answer is…. well, I think it’s pretty clear.
Including playoffs, quarterbacks who threw for 300+ yards in a game during the 2009 season won an incredible 63.3% of games. And that mark remains the highest in modern history. Over the last five years (2010 to 2014), quarterbacks have won 52% of games when cracking that mark; during the decade of the ’90s, quarterbacks won 53% of their games when throwing for 300+ yards.
Of course, the likelihood of a quarterback throwing for 300+ yards has increased significantly. Over the last four years, quarterbacks have thrown for 300+ yards in 25% of all games, an enormous increase relative to most of NFL history. The graph below shows both pieces of information: in blue, and measured against the left Y-Axis, shows winning percentage by year when a quarterback throws for 300+ yards; in red, and against the right Y-Axis, is the percentage of all games where a quarterback hit the 300+ yard mark: [continue reading…]
{ }
by Chase Stuart
on August 16, 2015
You probably don’t think of the St. Louis Rams as a team that’s built along the offensive line. And for good reason: according to Pro Football Focus, St. Louis ranked 30th in pass blocking and 29th in run blocking in 2014. Football Outsiders also ranked the Rams offensive line in the bottom five in both power rushing and stuffed rates. But the Rams struggles on the offensive line are not for a lack of acquiring highly-drafted linemen.
Let’s put aside the selection of Jason Smith with the second overall pick of 2009, who would presumably be in the prime of his career right now had he not been a bust. Because even without him, no offensive line had as strong a pedigree in 2014 as the Rams.
- At left tackle, Jake Long started 7 games; Long was the first overall pick in the ’08 Draft, albeit by the Dolphins. The other nine games were started by Greg Robinson, taken by St. Louis with the second overall pick in the 2014 Draft.
- The left guard spot generally belonged to Rodger Saffold (who started 16 games), taken by St. Louis with the 33rd overall pick in 2010.
- Center was manned by Scott Wells, the 251st pick by the Packers way back in 2004.
- At right guard was Davin Joseph for 13 games, the 23rd pick in 2006 by the Bucs. The other three games were started by Saffold, and during those games, Robinson moved into the left guard spot during (with Long sticking at left tackle).
- At right tackle was Joe Barksdale for all 16 games. Barksdale was the 92nd pick in the draft in 2011 by the Raiders.
[continue reading…]
Tagged as:
Offensive Line
{ }
by Chase Stuart
on August 15, 2015
Today’s guest post/contest comes from Thomas McDermott, a licensed land surveyor in the State of California, a music theory instructor at Loyola Marymount University, and an NFL history enthusiast. As always, we thank him for his hard work.
In a previous post, I provided SRS-style ratings for all offenses since 1970, using only points scored by the actual offense (including field goals). Today, I’ll do the same thing for defenses – meaning, of course, our “metric” will be points allowed only by the actual defense.
Here’s how to read the table below: in 1970, the Vikings allowed 10.2 points per game, 8.2 of which came from touchdowns and field goals allowed by the defense. This leaves 2.0 PPG scored by their opponent’s defense or special teams (i.e., due to Minnesota’s offense or special teams). Their 8.2 Def PA/G was 9.5 points better than league average; after adjusting for strength of opponent, their rating remains at 9.5. Their overall points allowed SRS rating (DSRS) is 9.2, meaning PFR’s defensive SRS rating undersells them by 0.3 points. [continue reading…]
Tagged as:
Guest Posts,
SRS,
Tom McDermott
{ }
by Chase Stuart
on August 14, 2015
Bryan Frye, owner and operator of the great site http://www.thegridfe.com, is back for another guest post. You can also view all of Bryan’s guest posts at Football Perspective at this link, and follow him on twitter @LaverneusDingle.
On Monday, I looked at which quarterbacks since 1960 helped or hurt their teams the most by taking or avoiding sacks. On Tuesday, I looked at the quarterbacks who gained the most or fewest yards through the air per attempt or dropback, and on Wednesday, we looked at completions relative to league average. Yesterday, the metric of the day was touchdown pass rate.
As promised, this article, “Dr. Safelove or: How I Learned to Start Worrying and Fear the Bomb,” centers on interceptions. The methodology here is no different from before: Figure out each player’s rate stats relative to the average of the rest of the league minus that player (LMP) that year and multiply it by his attempts to find the marginal total.
The caveat for this article is a big one: it is mathematically impossible for modern players to rank highly on a per play basis. In 1945, Sammy Baugh threw interceptions at a rate 7.4% lower than his peers. Because the league average today is so low (about 2.5%), a current quarterback would have to throw negative interceptions to match a -7.4% relative pick rate. Even if a quarterback threw 700 passes without an interception, the best he could possibly do is about -2.5%. [continue reading…]
Tagged as:
Bryan Frye,
Guest Posts
{ }
by Chase Stuart
on August 13, 2015
Bryan Frye, owner and operator of the great site http://www.thegridfe.com, is back for another guest post. You can also view all of Bryan’s guest posts at Football Perspective at this link, and follow him on twitter @LaverneusDingle.
On Monday, I looked at which quarterbacks since 1960 helped or hurt their teams the most by taking or avoiding sacks. On Tuesday, I looked at the quarterbacks who gained the most or fewest yards through the air per attempt or dropback. And yesterday, we looked at completions relative to league average.
Today’s article, “Mile High Club or: Scoring through the Air,” is an examination of how often quarterbacks threw touchdowns.
I have used the same methodology as before (similar to Chase’s model for Relative Adjusted Net Yards), and I have maintained the same minimum attempt cutoffs. That means we’ll only look at seasons with 224 or more attempts and careers with 1,000 or more attempts. Like before, I didn’t prorate for shorter seasons. [continue reading…]
Tagged as:
Bryan Frye,
Guest Posts
{ }
by Chase Stuart
on August 12, 2015
Bryan Frye, owner and operator of the great site http://www.thegridfe.com, is back for another guest post. You can also view all of Bryan’s guest posts at Football Perspective at this link, and follow him on twitter @LaverneusDingle.
On Monday, I looked at which quarterbacks since 1960 helped or hurt their teams the most by taking or avoiding sacks. Yesterday, I looked at the quarterbacks who gained the most or fewest yards through the air per attempt or dropback. As you may have guessed, I’m keeping the theme going today. This article, “Sharpshooters or: Quarterbacks who were Good at Completing Passes,” is an examination of how passers stacked up statistically against their peers in the not-super-important category of completion rate. [continue reading…]
Tagged as:
Bryan Frye,
Guest Posts
{ }
by Chase Stuart
on August 11, 2015
Bryan Frye, owner and operator of the great site http://www.thegridfe.com, is back for another guest post. You can also view all of Bryan’s guest posts at Football Perspective at this link, and follow him on twitter @LaverneusDingle.
Yesterday, I looked at which quarterbacks since 1960 helped or hurt their teams the most by taking or avoiding sacks. In this post, “Frequent Flyers or: Quarterbacks who Gained Yards through the Air,” I’ll do something similar but with passing yards instead of sacks.
Because we have the necessary passing stats dating back to 1932, I can take this study back nearly three decades further than the previous one. However, I will use Chase’s estimated sack statistics to examine net yards for all post-1960 quarterbacks.
The math is simple: for each player, subtract his individual raw totals from those of every other quarterback in the league to find the league minus player (LMP) Y/A or NY/A. Next, subtract the LMP rates from the individual player rates to find each player’s marginal rate stats. Last, multiply each quarterback’s marginal Y/A by his attempts (or marginal NY/A by his dropbacks) to find marginal yards (or marginal net yards).
Enough explanation – Let’s look at some stats. The first table displays the 1,563 qualifying QB seasons, sorted by marginal yards. Read it thus: In 2001, Kurt Warner threw 546 passes for 4,830 yards, giving him 8.85 Y/A. The average of the rest of the league was 6.69, so Warner had a marginal Y/A of 2.15. This means his 2001 season is worth 1,176 yards above expectation. [continue reading…]
Tagged as:
Bryan Frye,
Guest Posts
{ }
by Chase Stuart
on August 10, 2015
Bryan Frye, owner and operator of the great site http://www.thegridfe.com, is back for another guest post. You can also view all of Bryan’s guest posts at Football Perspective at this link, and follow him on twitter @LaverneusDingle.
Last Wednesday, Chase unveiled his estimated sack numbers for 1960-1968. I already had this post planned, but I wanted to wait for the estimated stats before running the numbers, as doing so would allow me to go back to 1960 instead of 1969.
This article, “Upright Citizens (Quarterbacks who Avoided Sacks)” is a brief examination of those quarterbacks who saved their teams valuable field position by avoiding sacks. By extension, it is also an examination of those quarterbacks who did the opposite. When Chase presented his 1960-1968 data, he included everyone who threw a pass during that timeframe. Because I am only concerned with quarterbacks, I have removed all non-quarterback plays and recalculated the metrics. [continue reading…]
Tagged as:
Bryan Frye,
Guest Posts
{ }
by Chase Stuart
on August 9, 2015
I’ve been reading Chris Brown’s excellent new book, The Art of Smart Football. One of the passages in Brown’s book about legendary head coach Sid Gillman stood out to me:
Realizing that a football field is nothing more than a 53⅓-yard-wide geometric plane, Gillman designed his pass patterns to stretch defenses past their breaking points. His favorite method was to divide the field into five passing lanes and then allocate five receivers horizontally in each one. Against most zones, at least one receiver would be open.
Below is an example of what Gillman was referring to: you can see that, horizontally, one target will end up in each fifth of the field:
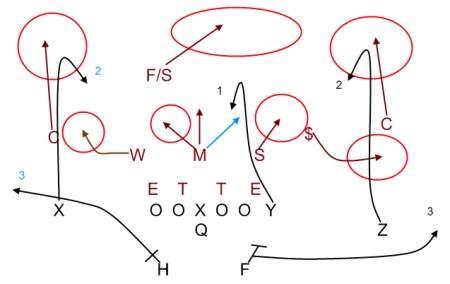
When it comes to pass patterns, the receivers are the players on the attack, and there’s a relatively wide variance in how effective a receiver can be (i.e., he can get open all the time, some of the, none of the time, etc.). But the players in pass coverage should be viewed in a different way: all they can do is mitigate the player in front of them. [continue reading…]
Tagged as:
Smart Football
{ }
by Chase Stuart
on August 8, 2015
At the start of the new season, every team has hope. Well, just about every team. And that made me wonder: how did Super Bowl champions look in the year before winning the Super Bowl?
The Jets were at -5.0 in the SRS last year: has any team ever been that bad (or worse) and won the Super Bowl the next season? Why yes, one — and only one — team has. The graph below shows the SRS ratings of each Super Bowl champion in the year before they won the Super Bowl. Note that I’m still using the Super Bowl year in the graph below, so if you go to 1972, you’ll see the 1971 Dolphins’ SRS. [continue reading…]
Tagged as:
SRS
{ }
by Chase Stuart
on August 7, 2015
If you’re reading this blog, chances are you already know all about our friends at Football Outsiders and the terrific analysis they provide every year. However, if by some chance you don’t know of them, or maybe you haven’t heard about their outstanding annual book, they now have copies of the 2015 Football Outsiders Almanac available for purchase. The book is jam-packed with FO’s signature data (including game-charting stats), plus the usual stat-geeky essays, team and player previews, and 2014 projections. And it’s not just the NFL, as Football Outsiders has some pretty sharp minds (Matt Hinton, Bill Connelly, Brian Fremeau) covering the college game, too.
Football Outsiders has been a supporter of Chase Stuart for a while and Football Perspective from the beginning. But don’t confuse this for charity post: the FOA is a great guide, and I’m sure anyone who buys it will be very happy. Here’s the link:
http://www.footballoutsiders.com/store
After working on the Almanac for the past two years, due to time constraints, I wasn’t able to contribute in 2015. But I am still happy to endorse one of the most thorough football products produced every year.
Tagged as:
Football Outsiders
{ }
by Chase Stuart
on August 6, 2015
Today’s guest post/contest comes from Thomas McDermott, a licensed land surveyor in the State of California, a music theory instructor at Loyola Marymount University, and an NFL history enthusiast. As always, we thank him for his hard work.
When looking at teams’ offensive SRS ratings (OSRS) on PFR, we know that those number also include points scored by the defense and special teams – punt and kick return touchdowns, interception and fumble return touchdowns, return scores on blocked punts and field goals, and safeties. This makes OSRS not as accurate a point-based rating of the offense “proper” as it could be. But, considering those “non-offense” types of scores make up a small fraction of a team’s overall points scored in a season (the average is around 8% since 1970), we can generally ignore this “hiccup” in the system.
Well, most of us can ignore it; for some reason, I cannot! My curiosity has gotten the better of me, so I decided to run offensive and defensive SRS ratings for each team since the merger, using only points that we would normally credit the offense for scoring (or the defense for allowing) – passing and rushing touchdowns, and field goals.
As the title states, this is a data dump; I’m hoping that readers of this site will find the info useful for their own research or general interest. Today, we’ll just look at the offense, I’ll post the numbers for defense in a follow-up post. [continue reading…]
Tagged as:
Guest Posts,
SRS,
Tom McDermott
{ }
by Chase Stuart
on August 5, 2015
You remember the November 20th game between the Bears and Lions in 1960, right? If you look at the boxscore on PFR, you will see that Detroit quarterback Jim Ninowski was 10 for 26 for 121 yards with 0 touchdown passes and 2 interceptions. You’ll also see that the Lions as a team went 10 for 26 for 121 yards with 0 touchdown passes, 2 interceptions, and 12 sacks for 107 yards. But the PFR boxscore does not indicate how many sacks Ninowski took that game, because the individual game log data wasn’t kept on that metric.
But, you know, I’m a pretty smart guy. I have a feeling that Ninowski was probably sacked 12 times in that game for 107 yards. I could be wrong, of course — maybe a backup came in and took two dropbacks, and was sacked on both of them — but it seems like making a good faith effort here is better than ignoring it completely. [continue reading…]
Tagged as:
George Blanda,
Joe Namath,
John Hadl
{ }
by Chase Stuart
on August 4, 2015
Through 48 starts, Russell Wilson has been pretty darn good. Since Wilson entered the league, he ranks 5th in ANY/A and tied for 2nd in wins. The idea of measuring quarterback by wins is a curious one, especially in the case of Wilson, who has benefited from a historically dominant defense. No, Wilson is not a great quarterback because his team has won 36 games over the last three years.
On the other hand, analysts can go too far in the other direction. For example, among the 31 quarterbacks to play in 24 games and throw 500 passes since 2012, Wilson ranks just 24th in passing yards per game. Some could use that statistic, or another variation, to argue that Wilson hasn’t been responsible for much of his team’s success. But that ignores that Wilson leads all quarterbacks in rushing yards since 2012, and ranks 3rd among those 31 quarterbacks in rushing yards per game. It also ignores the fact that Seattle has run the 5th fewest plays of any team over the last three years.
So how about this stat: over the last three years, Wilson has been responsible for two-thirds of all Seahawks yards. How does that compare to other quarterbacks through 48 starts? And how many wins did those quarterbacks have? [continue reading…]
{ }
by Chase Stuart
on August 3, 2015
In each of the last two years, I’ve derived implied SRS ratings for NFL teams based on the Vegas point spreads (I also do the same for college football teams). Well, in late April, CG Technology released lines for 238 NFL games. Things have changed since late April, of course, but for now, let’s work with that data.
For the third straight year, Seattle, Denver, New England, and Green Bay are ranked among the top five teams in the NFL. And before you ask, yes, we will get to the Tom Brady issue in a few moments. The Seahawks are underdogs in just one game this year, and even in that game, Seattle is a just 1-point underdog in Green Bay. The Packers are underdogs in just one game, too: Green Bay is a 1.5-point underdog during a week 8 trip to Denver. On the other side, the Raiders aren’t favored in a game all year: the closest is a pick’em when the Jets come to Oakland.
As a reminder, we can use the Simple Rating System to take all 238 point spreads and derive ratings. But as a sign of how good Vegas viewed Seattle, consider these four Seahawks road lines: [continue reading…]
Tagged as:
SRS
{ }
by Chase Stuart
on August 2, 2015
Last weekend, we looked at the league-average ratios between receiving yards and touchdowns, and which players scored far more touchdowns than we would expect. Today, we do the same but for rushing yards.
For whatever reason, Jerome Bettis’ 2005 has become etched in the memories of many folks. That year, he rushed for 368 yards and 9 touchdowns. Back in ’05, the NFL average was 133.6 rushing yards per rushing touchdown. So we would expect Bettis, with 368 rushing yards, to rush for 2.8 touchdowns. That means Bettis actually rushed for 6.2 more touchdowns than we would “expect” given his rushing total. [continue reading…]
Tagged as:
Weekend Trivia
{ }
