by Chase Stuart
on August 24, 2018
Today’s guest post/contest comes from Thomas McDermott, a frequent guest contributor. As always, we thank him for his hard work.
Author’s note regarding the numbers: The Win Probability (WP) numbers shown below were, for the most part, generated using a formula presented by Wayne Winston in his book Matheletics, and subsequently improved upon by Pro Football Reference for their WP model.
The heart of the formula is the Excel NORMDIST function, which returns the normal distribution (the probability) for a given mean and standard deviation. I have made some minor adjustments to this formula, but it is basically the same. The formula requires the use of Expected Points data; the EP dataset I use comes from Brian Burke’s Advanced Football Analytics site (when it was active), and I have adjusted those numbers for era. Since the formula falls apart in certain areas – most importantly, the 4th quarter when the game is close – I abandon it and use other data to generate a WP number. Field goal success rates, 4th down success rates, drive results, PFR’s Play Index and the recently provided play-by-play data from Ron Yurko on GitHub, are some of my alternate sources. I realize there’s a “black box” aspect to Win Probability analysis (if you can find two models that completely agree, let me know), since it’s not something that can be easily checked, and perhaps especially suspect when the author openly states that he adjusts the numbers “manually”. To that I can only say that my intent is to provide as accurate a picture as possible of the games that I analyze, and I’m open to any suggestions, comments or questions. Thanks. [continue reading…]
Tagged as:
Guest Posts,
Tom McDermott
{ }
by Chase Stuart
on June 30, 2017
Today’s guest post/contest comes from Thomas McDermott, a licensed land surveyor in the State of California, a music theory instructor at Loyola Marymount University, and an NFL history enthusiast. As always, we thank him for his hard work. You can view all of his work at Football Perspective here.
If you can get five people in a room to agree on what a sports dynasty is, you’ll probably have achieved the most miraculous agreement in history since the Congress of Vienna. We know a sports dynasty when we see one (the current Patriots, the New York Yankees, 1990s Bulls, etc.), but it becomes less clear once we attempt to actually define it:,When does the dynasty start? How long must it last? What are the requirements?
In this article on NFL dynasties, FiveThirtyEight does a nice job of negotiating the quagmire by just listing the “best team over any number of years”. I’m going to do the same thing here, but focusing solely on NFL defenses since the merger (regular season only). The metric is points allowed by the defense (meaning: fumble, interception, kick and punt return touchdowns, and safeties aren’t included), adjusted for era and strength of schedule (basically, SRS ratings). Regular readers may recall that I published these results back in August 2015. To differentiate this stat from Pro-Football-Reference’s DSRS, I’ll call it “DfSRS”.
Below is a table of defensive dynasties, ranging from 1 to 15 years: [continue reading…]
Tagged as:
Guest Posts,
Tom McDermott
{ }
by Chase Stuart
on January 27, 2017
Today’s guest post/contest comes from Thomas McDermott, a licensed land surveyor in the State of California, a music theory instructor at Loyola Marymount University, and an NFL history enthusiast. As always, we thank him for his hard work. You can view all of his work at Football Perspective here.
I wrote this article last year, when I generated the statistics and then ranked all starting quarterbacks in 2015 based on how well they played in “clutch” situations. I used a simple definition: if it occurred in the 4th quarter or overtime, when the game was tied or the quarterback’s team was trailing by as much as one score (8 points), then it was a clutch situation.
The main metric used was Bryan Frye’s Total Adjusted Yards per Play, and today we’ll use the same methodology to find the 2016 Clutch Value Leader as well as the single season leaders since 1994. Here’s Bryan’s TAY/P formula, which Chase supports as an all-encompassing basic measure of quarterback performance:
(passing & rushing yards + (touchdowns * 20) – (interceptions * 45) – (fumbles lost * 25) – ( sack yards)) / (pass attempts + rush attempts + sacks)
The other change I’m making from the previous post, is that I’ll be using a 3-year rolling league average, as opposed to a single year league average, when adjusting for era. Thanks to Bryan (through his great website GridFe) for providing me with that information.
So let’s get to it. Below are the quarterbacks in 2016 who had at least 30 clutch action plays, and here’s how to read the table: [continue reading…]
Tagged as:
Guest Posts,
Tom McDermott
{ }
by Chase Stuart
on September 9, 2016
Today’s guest post/contest comes from Thomas McDermott, a licensed land surveyor in the State of California, a music theory instructor at Loyola Marymount University, and an NFL history enthusiast. As always, we thank him for his hard work. You can read all of his guest posts at Football Perspective at this link.
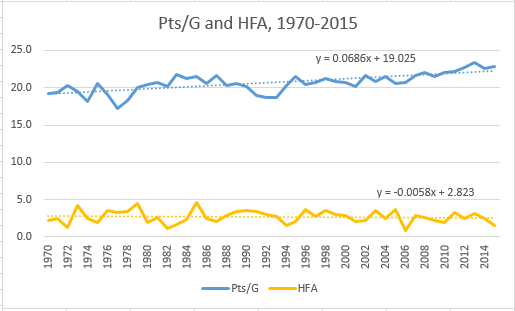
The following is a bunch of data I’ve gathered regarding home-field advantage; hopefully some of you will find it useful for analysis, or for picking winners against the spread in your pick’em games this year!
The general consensus is that the home team in a typical NFL game has an advantage of around 2.5 to 3 points, and this is right on: since 1970, the average team wins their regular season home games by 2.7 points, with a high of 4.6 in 1985 and a low of 0.8 in 2006. If we do a linear regression, we can see that HFA appears to be in decline, but only slightly compared to points per game, which is obviously increasing:
 [continue reading…]
Tagged as:
Guest Posts,
Tom McDermott
{ }
by Chase Stuart
on June 2, 2016
Today’s guest post/contest comes from Thomas McDermott, a licensed land surveyor in the State of California, a music theory instructor at Loyola Marymount University, and an NFL history enthusiast. As always, we thank him for his hard work.
One way we can tell if a quarterback is “clutch” – meaning, he plays well when he absolutely has to – is by looking at his 4th Quarter Comebacks (4QC) and Game Winning Drives (GWD). Below are definitions for both :
4th Quarter Comeback: In the 4th quarter, the quarterback leads a scoring drive while being down one score or less that results in the game being tied or his team taking the lead. As long as the QB’s team wins the game, the QB gets credit for the 4QC, even if his scoring drive wasn’t the game-winning drive.
Game-Winning Drive: In the 4th quarter or overtime, the quarterback leads a scoring drive that results in his team taking the lead (meaning, breaking a tie or overcoming a deficit) for the last time.
[continue reading…]
Tagged as:
Guest Posts,
Tom McDermott
{ }
by Chase Stuart
on August 15, 2015
Today’s guest post/contest comes from Thomas McDermott, a licensed land surveyor in the State of California, a music theory instructor at Loyola Marymount University, and an NFL history enthusiast. As always, we thank him for his hard work.
In a previous post, I provided SRS-style ratings for all offenses since 1970, using only points scored by the actual offense (including field goals). Today, I’ll do the same thing for defenses – meaning, of course, our “metric” will be points allowed only by the actual defense.
Here’s how to read the table below: in 1970, the Vikings allowed 10.2 points per game, 8.2 of which came from touchdowns and field goals allowed by the defense. This leaves 2.0 PPG scored by their opponent’s defense or special teams (i.e., due to Minnesota’s offense or special teams). Their 8.2 Def PA/G was 9.5 points better than league average; after adjusting for strength of opponent, their rating remains at 9.5. Their overall points allowed SRS rating (DSRS) is 9.2, meaning PFR’s defensive SRS rating undersells them by 0.3 points. [continue reading…]
Tagged as:
Guest Posts,
SRS,
Tom McDermott
{ }
by Chase Stuart
on August 6, 2015
Today’s guest post/contest comes from Thomas McDermott, a licensed land surveyor in the State of California, a music theory instructor at Loyola Marymount University, and an NFL history enthusiast. As always, we thank him for his hard work.
When looking at teams’ offensive SRS ratings (OSRS) on PFR, we know that those number also include points scored by the defense and special teams – punt and kick return touchdowns, interception and fumble return touchdowns, return scores on blocked punts and field goals, and safeties. This makes OSRS not as accurate a point-based rating of the offense “proper” as it could be. But, considering those “non-offense” types of scores make up a small fraction of a team’s overall points scored in a season (the average is around 8% since 1970), we can generally ignore this “hiccup” in the system.
Well, most of us can ignore it; for some reason, I cannot! My curiosity has gotten the better of me, so I decided to run offensive and defensive SRS ratings for each team since the merger, using only points that we would normally credit the offense for scoring (or the defense for allowing) – passing and rushing touchdowns, and field goals.
As the title states, this is a data dump; I’m hoping that readers of this site will find the info useful for their own research or general interest. Today, we’ll just look at the offense, I’ll post the numbers for defense in a follow-up post. [continue reading…]
Tagged as:
Guest Posts,
SRS,
Tom McDermott
{ }
