by Chase Stuart
on May 26, 2021
My preferred way to come up with NFL team ratings and NFL strength of schedule ratings is to trust the experts: in this case, the Vegas oddsmakers. Every year (or at least the years where I remember to do so), after Vegas releases the point spreads for every game, I take those weekly “ratings” to derive the Vegas ratings are for each team. Hence the title of today’s post: we can use the Vegas point spreads in each game to derive the implied ratings by the oddsmakers (in this case, Action Network) for each team.
The way to generate team ratings is to take the point spread in each game, adjust for home field (except for the two international games), and then determine by how many points Vegas thinks Team A is better than Team B. For example, when the Jets are 4.5-point underdogs to the Panthers in Carolina, we can imply that Carolina is viewed as 2 points better than the Jets (I am using 2.5 points for home field advantage). Using the iterative SRS process, and because the transitive property of point spreads applies, we can generate team ratings based on the 272 point spreads involved. [continue reading…]
Tagged as:
SRS
{ }
by Chase Stuart
on January 2, 2020

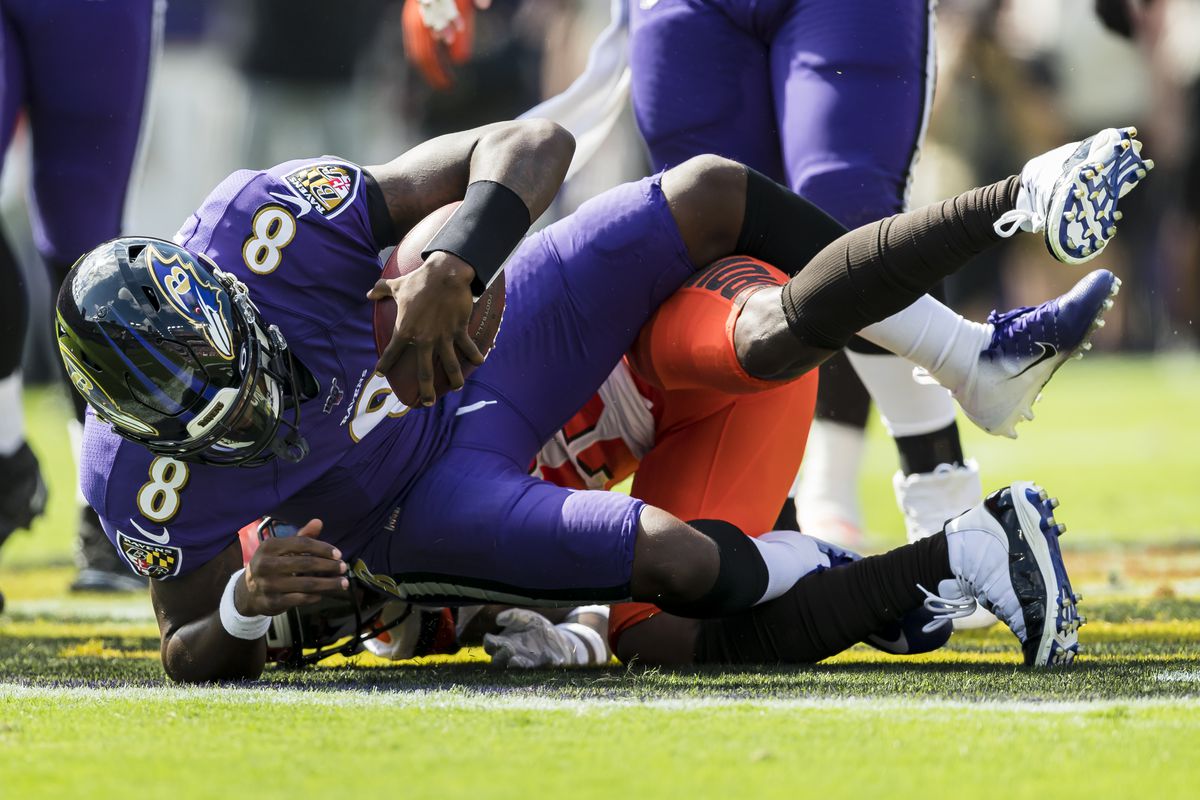
The low point of Baltimore’s brilliant season came at the hands of… Cleveland?
In week 4, the Cleveland Browns traveled to Baltimore and beat the Ravens, 40-25.
At the time, this moved the Browns into first place in the AFC North, as Baltimore and Cleveland were both 2-2.
Since then, Baltimore went 12-0, while Cleveland went 4-8. In retrospect, that game is really, really strange.
Every year, I like to examine the least-conforming games of the season. I do this by generating each team’s Simple Rating System rating — which is just points differential per game adjusted by opponent and home field. Note that I am not using SRS ratings at the time of the game, but SRS ratings as of the end of the season. Baltimore finished the season with a 15.6 average margin of victory against a perfectly average schedule; therefore the Ravens SRS rating was +15.6. Cleveland in 2019 had a -3.7 average margin of victory against a touch schedule (+1.7); therefore, the Browns finished with a -1.9 SRS rating. The beauty of the SRS is each point represents a point above or below average, and you can use the SRS ratings to predict games.
So when the Ravens (+15.6) host the Browns (-1.9), giving 3 points for home field, we would predict that Baltimore would win by 20.5 points. And when Baltimore travels to Cleveland, we would predict Baltimore to win by 14.5 points. In the latter case, that was nearly a perfect prediction: the Ravens won in Cleveland 31-15. In the former case, though, it was off by 35.5 points! That makes it the least-conforming game of 2019.
The table below shows the 2019 SRS ratings: [continue reading…]
Tagged as:
SRS
{ }
by Chase Stuart
on May 21, 2019

Belichick is ecstatic after checking out his team’s schedule.
After the release of
the 2019 Schedule, the next big item on the agenda is figuring out who are the best and worst teams in the NFL. Every year,
CG Technology releases point spreads for each of the first 240 games of the NFL season (i.e., spreads for every game during each of the first 16 weeks). And,
every year, I then use those weekly ratings to derive the Vegas ratings are for each team. Hence the title of today’s post: we can use the Vegas point spreads in each game to derive the implied ratings by CG Technology for each team.
The way to do this is to take the point spread in each game, adjust for home field (except for the five international games), and then determine by how many points Vegas thinks Team A is better than Team B. For example, when the Jets are favored by 6 points in a home game against the Dolphins, we can take this to mean that Vegas thinks New York is about three points better than Miami. When we see that the Jets and Dolphins game is a pick’em for the matchup in Miami, this helps reinforce that view. And when Vegas says the Jets are a pick’em against the Browns at home, that tells us that Vegas thinks the Jets are about 3 points worse than the Browns *and* that the Dolphins are about 6 points worse than Cleveland. Using the iterative SRS process, and because the transitive property of point spreads applies, we can generate team ratings based on the 240 point spreads involved.
Here’s how to read the table below, in each case excluding week 17 action. After adjusting for home field advantage, the Patriots are expected to beat their average opponent by 6.6 points. On average, New England’s opponents (after adjusting for *their* strength of schedule) are 1.0 points below average, which means the Patriots are expected to be 5.5 points better than average (difference due to rounding). That’s the best in the league; the worst team in the league is the Cardinals. [continue reading…]
Tagged as:
SRS,
Vegas
{ }
by Chase Stuart
on August 14, 2017
Back in May, CG Technology released point spreads for all NFL games during the first 16 weeks of the 2016 season. We can use these lines to generate implied NFL ratings — as of May 10, 2017 — for this upcoming season.
Basically, we take the point spread in each game, adjust for home field, and then determine how by many points Vegas thinks Team A is better than Team B. When the Seahawks are favored by 13.5 points in a home game against the Rams, we can take this to mean that Vegas thinks the Seahawks are 10.5 points better than Los Angeles. When Seattle is a 6-point road favorite in Los Angeles against the Rams, that tells us that Vegas thinks the Seahawks are 9 points better than the Rams. That’s just two games, of course: Using the iterative SRS process, we can generate season ratings based on the 240 point spreads involved. Here are those ratings, again as of May 10, 2017.
Here’s how to read the table below. After adjusting for home field, the Patriots are expected to beat their average opponent by 6.6 points. On average, New England’s opponents (after adjusting for *their* strength of schedule) are 0.3 points better than average, which means the Patriots are expected to be 6.8 points better than average (difference due to rounding). That’s the best in the league, far ahead of the Seahawks, Cowboys, and Packers (the only other teams that are 4 points better than average). [continue reading…]
Tagged as:
SRS
{ }
by Chase Stuart
on August 31, 2016
On Friday, I looked at the SRS ratings of AFC teams. Today, let’s do the same for the NFC. And let’s start with the NFC East, which has been a consistently inconsistent division that, over time, looks average. The four NFC East teams have each won the division twice over the last 8 years, but the division as a whole has clearly declined over that period:

The peak NFC East came in 2007: the Cowboys were the #1 seed, the Giants won the Super Bowl, and both Philadelphia and Washington had positive SRS grades. Last year? None of the four teams had a positive SRS grade. [continue reading…]
Tagged as:
SRS
{ }
by Chase Stuart
on August 26, 2016
I thought it would be fun to look at the SRS ratings for each division in the AFC since realignment in 2002. SRS, of course, stands for Simple Rating System: at its core, it’s just points differential (per game) adjusted for strength of schedule. To derive division ratings, I simply took the average of the SRS ratings of each of the four teams in any given season.
Let’s start with the best division in the conference over the last 14 years, the AFC East. From 2002 to 2015, the average AFC East team season has produced an SRS of +2.0. That’s the best division in football, and by a pretty large margin, too (second is the AFC North at +0.9). That said, the AFC East is on a bit of a decline lately: the division was below-average in 2012 and 2013, and barely above-average last year. But in ’04, ’06, ’09, and ’10, the AFC East produced some outstanding seasons. Take a look:

The division hasn’t exactly had a lot of turnover at the top: the Patriots won the division every year but ’02 (Jets) and ’08 (Dolphins), and New England obviously is the driving force here. The Patriots are at +9.5, while the other three teams average a -0.6 rating. But the AFC East also doesn’t have a bottom-feeder, and that helps. The AFC doesn’t have a Raiders, Jaguars, or Browns dragging it down; the Bills SRS rating since ’02 is -1.4, which is easily the best of any 4th-place team in any division in the NFL. Having the best team in the NFL and the best worst team makes it pretty easy to see why the AFC East fares so well here. [continue reading…]
Tagged as:
SRS
{ }
by Chase Stuart
on October 18, 2015
Last week, Michigan topped the SRS. Following the Gift Six, the Wolverines fall to the fifth spot after one of the craziest games in recent history. Jumping into the top spot is Baylor, after the Bears scored 56+ points for the sixth time in six games this year.
Baylor wide receiver Corey Coleman already has 16 touchdowns this year. 16! In six games! Okay, the Bears have only played two games of note — against Texas Tech two weeks ago and against West Virginia on Saturday — but the Bears also have the track record to show that they’re a top five team. Are they truly the best team in college football? We won’t find out more until a date with Oklahoma in four weeks, and the showdown with TCU two weeks later still looms as a de facto playoff game.
Without further ado, below are the SRS ratings through seven weeks. As always thanks to Dr. Peter R. Wolfe for providing the weekly game logs. [continue reading…]
Tagged as:
NCAA SRS,
SRS
{ }
by Chase Stuart
on August 15, 2015
Today’s guest post/contest comes from Thomas McDermott, a licensed land surveyor in the State of California, a music theory instructor at Loyola Marymount University, and an NFL history enthusiast. As always, we thank him for his hard work.
In a previous post, I provided SRS-style ratings for all offenses since 1970, using only points scored by the actual offense (including field goals). Today, I’ll do the same thing for defenses – meaning, of course, our “metric” will be points allowed only by the actual defense.
Here’s how to read the table below: in 1970, the Vikings allowed 10.2 points per game, 8.2 of which came from touchdowns and field goals allowed by the defense. This leaves 2.0 PPG scored by their opponent’s defense or special teams (i.e., due to Minnesota’s offense or special teams). Their 8.2 Def PA/G was 9.5 points better than league average; after adjusting for strength of opponent, their rating remains at 9.5. Their overall points allowed SRS rating (DSRS) is 9.2, meaning PFR’s defensive SRS rating undersells them by 0.3 points. [continue reading…]
Tagged as:
Guest Posts,
SRS,
Tom McDermott
{ }
by Chase Stuart
on August 8, 2015
At the start of the new season, every team has hope. Well, just about every team. And that made me wonder: how did Super Bowl champions look in the year before winning the Super Bowl?
The Jets were at -5.0 in the SRS last year: has any team ever been that bad (or worse) and won the Super Bowl the next season? Why yes, one — and only one — team has. The graph below shows the SRS ratings of each Super Bowl champion in the year before they won the Super Bowl. Note that I’m still using the Super Bowl year in the graph below, so if you go to 1972, you’ll see the 1971 Dolphins’ SRS. [continue reading…]
Tagged as:
SRS
{ }
by Chase Stuart
on August 6, 2015
Today’s guest post/contest comes from Thomas McDermott, a licensed land surveyor in the State of California, a music theory instructor at Loyola Marymount University, and an NFL history enthusiast. As always, we thank him for his hard work.
When looking at teams’ offensive SRS ratings (OSRS) on PFR, we know that those number also include points scored by the defense and special teams – punt and kick return touchdowns, interception and fumble return touchdowns, return scores on blocked punts and field goals, and safeties. This makes OSRS not as accurate a point-based rating of the offense “proper” as it could be. But, considering those “non-offense” types of scores make up a small fraction of a team’s overall points scored in a season (the average is around 8% since 1970), we can generally ignore this “hiccup” in the system.
Well, most of us can ignore it; for some reason, I cannot! My curiosity has gotten the better of me, so I decided to run offensive and defensive SRS ratings for each team since the merger, using only points that we would normally credit the offense for scoring (or the defense for allowing) – passing and rushing touchdowns, and field goals.
As the title states, this is a data dump; I’m hoping that readers of this site will find the info useful for their own research or general interest. Today, we’ll just look at the offense, I’ll post the numbers for defense in a follow-up post. [continue reading…]
Tagged as:
Guest Posts,
SRS,
Tom McDermott
{ }
by Chase Stuart
on August 3, 2015
In each of the last two years, I’ve derived implied SRS ratings for NFL teams based on the Vegas point spreads (I also do the same for college football teams). Well, in late April, CG Technology released lines for 238 NFL games. Things have changed since late April, of course, but for now, let’s work with that data.
For the third straight year, Seattle, Denver, New England, and Green Bay are ranked among the top five teams in the NFL. And before you ask, yes, we will get to the Tom Brady issue in a few moments. The Seahawks are underdogs in just one game this year, and even in that game, Seattle is a just 1-point underdog in Green Bay. The Packers are underdogs in just one game, too: Green Bay is a 1.5-point underdog during a week 8 trip to Denver. On the other side, the Raiders aren’t favored in a game all year: the closest is a pick’em when the Jets come to Oakland.
As a reminder, we can use the Simple Rating System to take all 238 point spreads and derive ratings. But as a sign of how good Vegas viewed Seattle, consider these four Seahawks road lines: [continue reading…]
Tagged as:
SRS
{ }
by Chase Stuart
on January 26, 2015

50/50 chance these guys show up
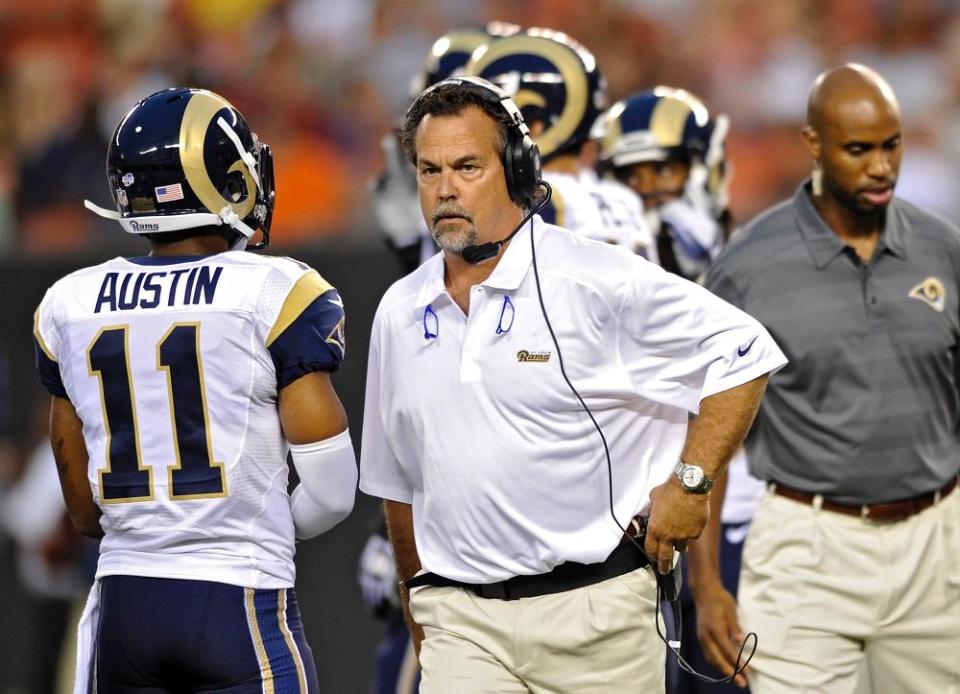
They’re baaack! In November 2013, the St. Louis Rams blew out the visiting Indianapolis Colts in what was the
least-conforming game of the 2013 season.
In November 2014, the Rams blew out the visiting Oakland Raiders in what was the least-conforming game of 2014 (although for my money, the runner-up game between the Titans and Chiefs was probably still the strangest result of the year). The Rams finished the season with a -0.8 SRS rating, eight points better than the 2014 Raiders SRS rating of -8.8. Given that the game was in St. Louis, we would have expected the Rams to win by around 11 points.
In reality, the Rams shut out the Raiders, 52-0. That gave St. Louis a single-game SRS score of 40.2, meaning the Rams were 40.2 points better than average that day. Since St. Louis won by 52 when the Rams were expected to win by 11, they exceeded expectations by a whopping 41 points.
That 41-point total — the amount by which St. Louis exceeded expectations — was the highest of any game in 2014. The table below lists all relevant information from every regular season game this year, with the “diff” column showing the difference between the expected and actual margins of victory. I have also included a link to the boxscore of each game embedded in the “Wk” cell. Note that the table, by default, lists only the top 10 games, but you can view more using either the dropdown box, the search bar, or the previous/next buttons at the bottom of the table. [continue reading…]
Tagged as:
SRS
{ }
by Chase Stuart
on September 27, 2014
I thought it would be fun to create NFL SRS ratings through three weeks and one Thursday Night football game. After just 3.0625 weeks, all data are heavily influenced by events that are unlikely to be repeated. Remember Neil’s old post that showed how for teams with any record, to determine their “true winning percentage”, we need to add 5.5 wins and 5.5 losses. That means through three weeks, a team’s actual record should still be regressed to league average by nearly 80%; in other words, take all these ratings with a big grain of salt. But there’s no reason not to run the numbers, so here are the customary parameters:
- Home wins of less than 3 points are treated as ties;
- For all other games, give the road team 3 points. From there, wins of fewer than 7 points are treated as 7-point wins;
- Wins of between 7 and 24 points (after adjusting for home field) are treated as they are. So a 14-point home win is a 11-point MOV, and a 17-point road win is a 20-point MOV;
- Wins of greater than 24 points convert to a Margin of Victory that is the average of 24 and the HFA-adjusted MOV. So the Falcons get a 31.5 for beating Tampa Bay by 42 at home, while the Giants get a MOV of 29 for winning in Washington by 31.
From there, we simple use the typical SRS iteration process to produce a set a season ratings. Those are presented below: [continue reading…]
Tagged as:
SRS
{ }
by Chase Stuart
on February 6, 2014

Denver had one of the greatest offenses ever.
On
Monday, I looked at the greatest defenses — measured simply by points allowed and adjusted for strength of schedule — in NFL history. Today, I want to look at which offenses were the greatest in regular season history, and see where the 2013 Broncos stack up.
As noted in the post on defenses, during Super Bowl week, Bill Barnwell’s article ranked Denver’s 2013 offense as the greatest scoring machine ever. He used the statistical measurement known as the Z-Score to show that Denver’s offense was 3.3 standard deviations above average, and no offense had ever been 3.3 standard deviations above average before.
Where does that 3.3 number come from? Denver averaged 37.9 points per game during the regular season. The league average was 23.4 points, which means that Denver’s offense was 14.5 PPG better than average. The standard deviation of points per game among the 32 NFL offenses in 2013 was 4.36 points; therefore, Denver gets a Z-score of 3.32, because the Broncos scored points at a rate that was 3.32 standard deviations better than the mean. [continue reading…]
Tagged as:
SRS
{ }
by Chase Stuart
on November 5, 2013
Let’s start with the SRS ratings through nine weeks, excluding the Green Bay/Chicago Monday Night Football game:
| Rk | Team | G | MOV | SOS | SRS | Record |
| 1 | Denver Broncos | 8 | 14.9 | -3.2 | 11.7 | 7-1 |
| 2 | Carolina Panthers | 8 | 12.3 | -2.8 | 9.4 | 5-3 |
| 3 | Green Bay Packers | 7 | 8.1 | 0.9 | 9 | 5-2 |
| 4 | Seattle Seahawks | 9 | 9.6 | -1 | 8.6 | 8-1 |
| 5 | San Francisco 49ers | 8 | 8.8 | -0.3 | 8.4 | 6-2 |
| 6 | Indianapolis Colts | 8 | 7.4 | -0.5 | 6.9 | 6-2 |
| 7 | Kansas City Chiefs | 9 | 11.2 | -4.3 | 6.9 | 9-0 |
| 8 | New Orleans Saints | 8 | 8.8 | -2.3 | 6.5 | 6-2 |
| 9 | Cincinnati Bengals | 9 | 6 | -0.5 | 5.5 | 6-3 |
| 10 | Dallas Cowboys | 9 | 5 | -0.1 | 4.9 | 5-4 |
| 11 | Detroit Lions | 8 | 2.5 | 1 | 3.5 | 5-3 |
| 12 | New England Patriots | 9 | 6.2 | -2.8 | 3.4 | 7-2 |
| 13 | Arizona Cardinals | 8 | -1.8 | 2.6 | 0.8 | 4-4 |
| 14 | Tennessee Titans | 8 | 0.8 | -0.2 | 0.5 | 4-4 |
| 15 | Baltimore Ravens | 8 | 0.3 | 0.2 | 0.4 | 3-5 |
| 16 | Miami Dolphins | 8 | -1.6 | 1.7 | 0.1 | 4-4 |
| 17 | San Diego Chargers | 8 | 3 | -3.1 | -0.1 | 4-4 |
| 18 | Chicago Bears | 7 | 0.6 | -1.4 | -0.8 | 4-3 |
| 19 | Philadelphia Eagles | 9 | -0.3 | -0.9 | -1.3 | 4-5 |
| 20 | Cleveland Browns | 9 | -3.1 | 1.8 | -1.3 | 4-5 |
| 21 | Buffalo Bills | 9 | -5.6 | 2.6 | -3 | 3-6 |
| 22 | Washington Redskins | 8 | -6.3 | 2.3 | -3.9 | 3-5 |
| 23 | St. Louis Rams | 9 | -4.8 | 0.4 | -4.4 | 3-6 |
| 24 | Atlanta Falcons | 8 | -5.3 | 0.2 | -5 | 2-6 |
| 25 | Houston Texans | 8 | -9.4 | 3.4 | -6 | 2-6 |
| 26 | Tampa Bay Buccaneers | 8 | -8.3 | 1.9 | -6.4 | 0-8 |
| 27 | Minnesota Vikings | 8 | -7.9 | 1.3 | -6.6 | 1-7 |
| 28 | New York Giants | 8 | -9.5 | 2.9 | -6.6 | 2-6 |
| 29 | New York Jets | 9 | -7.2 | -0.3 | -7.5 | 5-4 |
| 30 | Pittsburgh Steelers | 8 | -6.1 | -1.6 | -7.8 | 2-6 |
| 31 | Oakland Raiders | 8 | -7.4 | -0.7 | -8.1 | 3-5 |
| 32 | Jacksonville Jaguars | 8 | -21.9 | 3.7 | -18.1 | 0-8 |
[continue reading…]
Tagged as:
SRS
{ }
by Chase Stuart
on August 2, 2013
Here is a recap of the 2012 Chicago Bears season. Notice anything strange? Trick question!
[continue reading…]
Tagged as:
Bears,
RPO 2013,
SRS
{ }