≡ Menu

In week 3, Arizona picked off two Colin Kaepernick passes and returned them for touchdowns… in the first six minutes of the game. The Cardinals led 28-0 before we were halfway through the second quarter! On average, Arizona led by 24.3 points during every second of game play, the most dominant Game Script so far in 2015 (it would rank 5th last year).

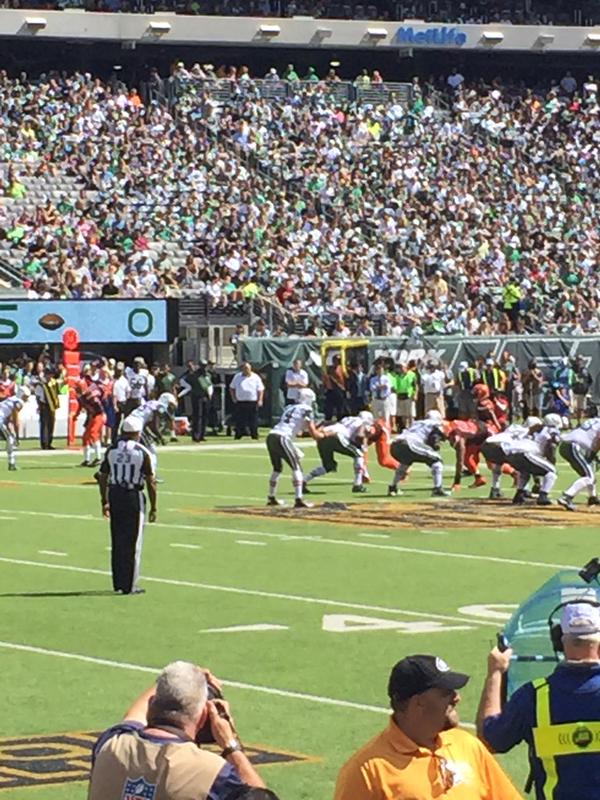
But while the Cardinals provided the biggest blowout of week three, it was hardly the only one. A full half of all 16 games had a double digit Game Script, and only the Jets managed to finish within one score of their opponent. Three other games finished with double-digit margins; there simply weren’t that many nail biters last weekend.

The Falcons, though, did pull off an impressive upset: Atlanta trailed 14-0 midway through the first quarter against the Cowboys, and then 21-7 midway through the second. Atlanta even went into halftime down 11, but scored three second half touchdowns while shutting out the Cowboys to pull away with the victory. In the process, the Falcons became just the 11th team since 1990 to trail by at least 11 at halftime and still win by at least 11 points.

Below are the week 3 game scripts: [continue reading…]

{ 1 comment }

This week at the New York Times, we begin with a look at the impressive triplets being groomed in Oakland: quarterback Derek Carr, running back Latavius Murray, and wide receiver Amari Cooper.  They made a bit of history on Sunday:

Against the Browns, Carr threw for 314 yards, Murray rushed for 139 yards, and Cooper gained 134 receiving yards. It was the first time the Raiders had a 300-yard passer, a 100-yard rusher and a 100-yard receiver since 2010. But perhaps more impressive, this game marked only the 12th time since 1970 that any franchise had a 300-yard passer, a 100-yard rusher and a 100-yard receiver, with all three being 25 years or younger.

You can read the full article here.

Also, here is yet another ode to the greatness that is Aaron Rodgers.


It has been over three years since Rodgers lost a regular-season game at Lambeau, excluding a November 2013 game against the Bears in which he left the game because of an injury after two pass attempts. Putting aside that contest, the Packers have won 20 consecutive regular-season home games under Rodgers, with an average margin of victory of over 16 points.

The raw totals are mind-boggling. In Rodgers’s last 18 games at home (excluding that Bears game), he has completed 394 of 572 passes (68.9 percent) for an incredible 5,212 yards (9.1 yards per attempt), with 48 touchdowns and zero interceptions. During that time, the Packers have gone 17-1 and averaged 34.8 points per game, with the only loss coming in the 2013 playoffs to the San Francisco 49ers.

You can read the full article here.

{ 1 comment }

Last year, the Cardinals started the season 8-1, but did so in a fashion that screamed, “UNSUSTAINABLE!” Here is what I wrote at the time last year:

The Cardinals have scored 223 points and allowed 170. That translates to just a 0.668 Pythagenpat winning percentage. That’s easily the worst of any team since 1990 to start 8-1 or 9-0.

The Cardinals promptly followed that up by going 3-2 over their next five games despite being outscored by 10 points! But then Ryan Lindley took over, and Arizona lost their final three games of the year.

This year, the Cardinals started the season in a fashion not-too-dissimilar from what we saw from them last year: Arizona defeated New Orleans, 31-19, but only thanks to a 55-yard touchdown to David Johnson in the final two minutes.

But since then, Arizona won 48-23 against the Bears and 47-7 against the 49ers yesterday. Through three weeks, the Cardinals have outscored opponents by a whopping 77 points, which is tied for the 13th best margin through three weeks among all teams since 1950. The good news for Arizona fans: the first 12 all made the playoffs, three won it all, and five more lost in the title game. [continue reading…]

{ 2 comments }

What am I looking to watch today? Some quick thoughts on each game.

New Orleans Saints @ Carolina Panthers

Luke McCown last threw a touchdown pass on December 30, 2007.  Cam Newton was a freshman at Florida, and this was three weeks after Tim Tebow just won the Heisman Trophy.  It was a long time ago, although we will stretch back a few weeks earlier later in this preview.

The Panthers are on track to become one of the worst 3-0 teams in a long time. A win over Jacksonville is the best trophy on the wall, matched up against wins vs. a Ryan Mallet-led Texans team and whatever you want to call this version of the Saints. The Panthers are banking wins, though, and could get to 4-0 next week courtesy of a visit to Tampa Bay.

Carolina 20, New Orleans 6

Oakland Raiders @ Cleveland Browns

The last time the McCown brothers both started on the same day? December 9, 2007. But let’s not focus on Josh McCown or even Johnny Manziel: Derek Carr appeared to have his breakout game last week. Can he keep that up against a Cleveland defense that was very strong against the pass in 2014, but has been inconsistent so far this year? [continue reading…]

{ 2 comments }

Guest Post: Quarterback Tiers Based On Age and Talent

Today we have a guest post from James Deyerle, a longtime reader of this blog and the PFR blog, and who lives in Richmond, VA. As always, we thank our guests for contributing to the site.


If there’s one thing NFL fans can’t resist, it’s ranking quarterbacks, but while those conversations are often framed with stats, playoff success, awards, and more, it misses a big part of how fans and front offices treat quarterbacks. For example, despite similar stat lines in 2014 Vikings fans are justified in feeling very differently about Teddy Bridgewater than Bears fans feel about Jay Cutler.

One of the biggest reasons is age: Cutler was 31 and in his 9th season last year, while Bridgewater was only a 22 year old rookie, making him one of the youngest rookies in the past 15 years to see significant playing time. A collection of studies on quarterback aging from Chase, Neil Paine, and Brian Burke show that as a group, quarterbacks rapidly improve into their late 20s, peak for a few years, and then begin an accelerating decline throughout their 30s. This expected improvement lends promise to Bridgewater’s young career while the projected decline condemns Cutler’s, which informs our opinions and feelings on these quarterbacks. As such, I decided to create a system that more accurately reflects a team’s quarterback situation. [continue reading…]

{ 26 comments }

It’s safe to say that no team has exceeded expectations through two weeks quite like the Jets. In week 1, New York was a 3.5-point home favorite against the Browns, but won by 21 points (a 17.5-point cover). In week 2, the Jets won 20-7 in Indianapolis, despite being 7-point underdogs (a 20-point cover). The Jets are the only team to cover by 17+ points in each of the first two weeks; in fact, Arizona (+10 against New Orleans, +23 against Chicago) is the only other team to even cover by at least five points in both games so far.

The last team to pull off this feat? The 2007 Patriots. Yes, another day, another Tom Brady/Ryan Fitzpatrick comparison. From 1978 to 2014, there were 19 teams that covered by at least 17 points in each of their first two games. How did those teams do the prior year, and during the rest of that season?

I’ve included the relevant data for each team in the table below. Here’s how to read the line of the ’06 Chargers. San Diego covered by 24 points in week 1, and 21 points in week 2. The Chargers won 9 games in 2005, but the hot start in ’06 was a sign of things to come, as San Diego won 14 games. That was an improvement of 5 wins, although the Chargers season ended in the Division round of the playoffs. [continue reading…]

{ 0 comments }

This week at the Washington Post, a look at the offensive line struggles that have tanked the Colts and Eagles offenses to date

The Eagles experienced unprecedented offensive turnover this offseason for a team that ranked third in points scored just one year ago. And while much was made of the departures of running back LeSean McCoy and wide receiver Jeremy Maclin, and the arrivals of quarterback Sam Bradford and McCoy replacement DeMarco Murray, Philadelphia also decided to release both of the team’s starting guards, Todd Herremans and Evan Mathis (a first-team All-Pro in 2013).

The Eagles did retain the rest of the starting offensive line, but that hasn’t stopped that unit from struggling mightily through two weeks. According to Pro Football Focus, Eagles halfbacks averaged an NFL-high 2.43 yards per carry before contact in 2013. Last year, Philadelphia halfbacks averaged 2.29 yards before contact, good enough for a third-place ranking. Eagles running backs were the beneficiaries of lots of space before getting hit over the past two seasons, which helped the team rank second in rushing yards, second in yards per rush and first in touchdowns during that time.

You can read the full article here.

{ 0 comments }

On Sunday, New England defeated Buffalo by the misleading score of 40-32. The Patriots may have won by only one score, but New England held an 11-point lead at halftime and a 24-point lead after three quarters. The Patriots were in control of the game for most of the contest, and held an average lead of 9.8 points during each second of game play (the “Game Script”).

Teams with large leads don’t pass very often; in general, you’d expect a team with a Game Script of +10.0 to pass around 50% of the time. But New England threw on 80% of all snaps! That even includes three Tom Brady kneels, and one run each by wide receivers Julian Edelman and Danny Amendola. Excluding those plays, New England passed on 61 of 71 plays, an astonishing 86% pass rate. Much of that number owes to a stout Buffalo run defense, but that’s a remarkable pass-happy performance regardless of Game Script or opponent; given that it came in a game where New England dominated, it was even more noteworthy. By comparison, Minnesota had a Game Script of +10.4 against Detroit, and passed on just 31.7% of plays. In fact, none of the other 31 teams passed as often as New England in week two. [continue reading…]

{ 7 comments }

This week at the New York Times, a look at how four young quarterbacks gave their team’s long-suffering fans some hope:

Bortles helped the Jaguars upset the Miami Dolphins, 23-20, courtesy of a number of big plays. Bortles was responsible for eight plays of at least 15 yards, including a 28-yard scramble on one third down. A second-year quarterback, he was responsible for 76 percent of Jacksonville’s yards on the day, and helped drive the team to the game-winning field goal.

Carr was responsible for 83 percent of Oakland’s offensive output on a day in which the Raiders were extremely pass-happy. Carr saved his best work at the end of the game: Taking over at his 20-yard line, trailing by 33-30 with 2 minutes 10 seconds remaining, Carr marched the Raiders to the game-winning score. He was seven for nine for 65 yards, and connected with Seth Roberts for a 12-yard touchdown with 26 seconds remaining.

You can read the full article here.


Arizona Is 14-2 In Carson Palmer’s Last 16 Games

Part II this week focuses on Arizona, which has been one of the best teams in football when Palmer stays healthy.

Expectations were not very high for the Cardinals entering 2015, despite the return of their starting quarterback, Carson Palmer. But through two weeks, the Cardinals lead the N.F.L. with 79 points. And dating to the 2013 season, Arizona has a 14-2 record and has outscored its opponents by 160 points in its last 16 games started by Palmer. Over that stretch, Palmer has completed 365 of 568 passes for 4,479 yards and 32 touchdowns with just 12 interceptions in what amounts to a full season’s worth of action. In other words, Arizona with a healthy Palmer deserves to be in the discussion for best team in the league.

You can read the full article here.

{ 5 comments }

Brees may not be throwing for awhile

Brees may not be throwing for awhile

Ian Rapoport is reporting that Drew Brees may miss several games with a shoulder injury. That’s tough news for all involved, including those who will now have to watch a bad Saints team led by Luke McCown (or Garrett Grayson). But it also could mark the end of a weird bit of trivia.

Believe it or not, Marques Colston and Brees have connected for 72 touchdowns, tied with Philip Rivers and Antonio Gates for the 5th most in NFL history by any receiver/quarterback combination. I’ve written about that streak before, but here’s something else unique to consider: Colston has never caught a touchdown pass from anyone other than Brees. [continue reading…]

{ 4 comments }

38 Questions Summary

On September 7th, I announced the 38 Questions Contest. There were 82 entries, so that gives us some data to analyze. Let’s look at what turned out to be the most lopsided questions:

1) Number of wins by the team with the second-most wins (72) vs. Number of wins by Washington and Oakland combined (10)

I am not surprised that more people voted for the first option there, but the magnitude caught me off guard. Last year, the team with the second-most wins had 12 wins, although it had been 13 in each of the previous five years. If you had to guess, 13 is probably the most likely answer here, and I don’t think it’s unreasonable to say that Washington and Oakland aren’t likely to combine for 13 (or more) wins.  This one looked like a slam dunk after week one, but is on shakier ground after week two. [continue reading…]

{ 1 comment }

It’s a little late, but good news: I have the week 1 Game Scripts!

Regular readers know all about Game Scripts, but you can learn more about them here. Essentially, Game Scripts is the term I’ve used to represent the average margin of lead or deficit over the course of every second of a game.

In week 1, three won in week 1 despite having a negative Game Script: the Dolphins trailed by 1 point, on average, throughout the game against Washington, Dallas had a -2.7 Game Script against the Giants, and the Chargers came back from a 21-3 deficit to win, which produced a -4.8 Game Script.

Below are the results of every game from week 1. [continue reading…]

{ 2 comments }

What Can We Learn About The 49ers Defense From Week 1?

Yesterday, we looked at what Tennessee’s offensive explosion in week 1 might mean for the rest of the year. Today, let’s do the same but for the 49ers defense. The 49ers were 2.5-point underdogs against Minnesota in week one, and the Over/Under in the game was 41.5 points. This translates to a projected a final score of 22-19.5 in favor of Minnesota. As it turns out, San Francisco won the game, 20-3, which means the Vikings were held 19 points below their expected total. That’s the 4th best performance by a team by this methodology since 2002.

The most impressive game? That came in 2003, in the Lawyer Milloy game. The Bills shut out New England, 31-0, while the pre-game spread projected New England to score 21.75 points. That wasn’t a sign that Buffalo was about to break through (the team finished 6-10), but it did provide some insight into a Bills defense that jumped from 27th (in 2002) to 5th (in 2003) in points allowed. [continue reading…]

{ 1 comment }

The Titans were 3-point underdogs against Tampa Bay in week one, and the Over/Under in the game was 41 points.  This translates to a projected a final score of 22-19 in favor of Tampa Bay. Of course, Tennessee scored 42 points, outscoring its projection by a whopping 23 points, tied for the fourth biggest number in all week 1 games since 2002.  In the graph below, I’ve plotted each team’s expected points scored in week 1 on the X-axis, and their actual week 1 score on the Y-axis. [continue reading…]

{ 3 comments }

This week at The Washington Post, I look at how Peyton Manning is currently in the worst four-game slump of his career:

Peyton Manning just finished the worst four game stretch of his career. For a player who has started 281 career games, that’s a pretty bold statement. Then again, few quarterbacks have reached the incredible peaks that for years Manning turned into his permanent residence.

…..

If we take a simple rolling, four-game average of Manning’s ANY/A in each game relative to the average ANY/A allowed by the opposing defense in that game, Manning’s last four games would rate as the worst of his career

You can read the full article here.

{ 8 comments }

Guest Post: How Good Was The Super Bowl Champ Last Year?

Longtime commenter Jason Winter has chimed in with today’s guest post. Jason is a part-time video game journalist and full-time sports fan. You can read more of him at his blog: https://jasonwinter.wordpress.com/, and follow him on twitter at @winterinformal.

As always, we thank Jason for contributing. He submitted this article a couple of weeks before the season began, but I was a bit tardy in posting. But hey, it’s still relevant.


A couple of months ago, I happened upon Peter King’s NFL power rankings, where he listed Baltimore as his #1 team. “Really?” I thought. I mean, they were pretty good last year, going 10-6, but they were the #6 seed in the AFC and hadn’t done anything really notable in the offseason. Surely you wouldn’t rank them above obvious powerhouses like Seattle, New England, Green Bay, Indianapolis, or Denver, right?

We know that the best teams in any given year rarely are the best the next year. And sometimes teams can have complete turnarounds – for better (like the 1998-1999 Rams) or worse (like the 1993-1994 Oilers). But how uncommon would it be for a team like the 2014 Ravens to actually be the best team – or at least the Super Bowl winner – the next year?

Excluding the years following the two strike-shortened years, I took every Super Bowl-winning team in the NFL in the 16-game-season era and looked at how good they were the year before winning it all. I charted each team’s wins and SRS the previous year, as well as their league-wide rank in wins and SRS in those years. In case of ties, I averaged out the ordinal rankings, which is why you’ll see several fractional rankings in the table below. [continue reading…]

{ 3 comments }

This week at the New York Times, some thoughts on Marcus Mariota’s insanely productive debut:

Mariota became the youngest player in N.F.L. history to throw for four touchdowns in the first half of a game. Just one other rookie quarterback has thrown four first-half touchdowns in a single game: Johnny Green of Buffalo in 1960. Mariota also joined Matthew Stafford, Drew Bledsoe, and Fran Tarkenton as the only players since 1950 to pass for four touchdowns in a single game before turning 22 years old, and he and Tarkenton are the only rookie quarterbacks to throw for four touchdowns in their team’s first game.

You can read the full article here.

I also wrote about the A.F.C. East going 4-0 in week 1. You can read that article here.

The Dolphins may be the most balanced team in the division, with a better defense than New England and a more reliable offense than either New York or Buffalo. But Miami is also the one team without a clear identity. The strength of the team last year was the rushing attack and running back Lamar Miller, but Miami had a curious tendency to refrain from relying on the ground game. That trend continued in Week 1: Before the final, run-the-clock-out drive, Miller had only 9 carries (for 49 yards). The Dolphins finished the day with 18 carries, five fewer than any other team that won in Week 1. The rush defense, which was supposed to be bolstered by the off-season acquisition of Ndamukong Suh, was shredded for 161 rushing yards, the third highest total of the week. But one bright spot for the Dolphins was on special teams. According to Football Outsiders, Miami had the worst special teams in the N.F.L. in 2014; on Sunday, Jarvis Landry’s 69-yard fourth-quarter punt return was the game winner.

{ 1 comment }

Instant Analysis: Jets Top Browns In Week 1

fitzmagicFor the fourth straight year, the Jets have opened at home. Each time, the Jets have been blessed with the good fortune of getting to face one of the weaker teams in the league. And each time, the Jets have emerged victorious. Given that I spent half of my Sunday at the game, my week 1 analysis is going to be limited to the wonder that was Jets/Browns.

The optimistic view is that over 60 minutes, the Jets were pretty clearly the better team. New York averaged 4.3 rushing yards per play with 9 first downs, while holding the Browns to 3.7 rushing yards and just 5 rushing first downs. And, frankly, that’s pretty misleading, because Cleveland’s top two rushers were the team’s quarterbacks, who gained 58 yards on 8 carries, carries which came with a large cost: three fumbles. Cleveland running backs had 20 carries for just 46 yards. [continue reading…]

{ 3 comments }

2015 NFL Predictions

Welcome back, NFL. With the NFL season finally here, I thought I would get in my pre-season predictions before it was too late. Prior to Thursday Night’s game between the Steelers and Patriots, I posted my predicted records for those two teams: 11-5 for New England, and 8-8 for Pittsburgh. But let’s run through my full standings, since, you know, these things are always so useful. [continue reading…]

{ 6 comments }

TTaylorTyrod Taylor was a sixth round pick of the Baltimore Ravens in 2011. Since then, he’s thrown just 35 passes over four years, before signing with the Bills as a free agent in the 2015 offseason. Now, after beating out Matt Cassel and EJ Manuel in training camp, Taylor will be the Buffalo Bills opening day starter in 2015.

How rare is this? Taylor was in the NFL for at least four seasons and never started a game in his NFL career; now he’s his team’s opening day starter. Since 1970, there are just four other quarterbacks who meet that profile. In reverse order… [continue reading…]

{ 14 comments }

WP: Pre-Week 1 – How Valuable Is An All-Pro Center?

This season, I will be writing weekly articles at The Washington Post. My first article looks at how valuable Maurkice Pouncey is to the Steelers.

Pittsburgh center Maurkice Pouncey suffered a severe lower leg injury in an Aug. 23 preseason game against the Green Bay Packers, landing the team’s top offensive lineman on the short-term injured reserve list, which will sideline him until at least Week 9, though the injury may keep him out for even longer. Given that the team once again figures to have one of the weaker defenses in the NFL, Pittsburgh’s playoff hopes rest on the offense performing at a peak level. So how much worse should we expect the Steelers offense to be without Pouncey?

The Steelers were very successful on offense in 2014, ranking among the top eight teams by most metrics, including traditional categories such as points, yards and first downs, as well as advanced tools, including Football Outsiders’ DVOA, and Advanced Football Analytics’ EPA model. One hidden reason for the team’s success on offense last year was great health: According to Football Outsiders, no offense lost fewer games to injury last year than Pittsburgh.

You can read the full article here.

{ 3 comments }

Nick the Kick

Nick the Kick

On Tuesday, I explained the formula used in my system of grading field goal kickers, which is based on field goal success rate adjusted for distance and era.  Yesterday, I looked at the single-season leaders using that methodology. Today, we look at the best field goal kickers since 1960 on the career level.

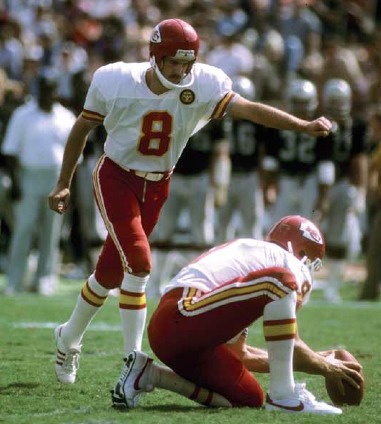
And frankly, it’s not much of a question as to who is the best kicker ever. Until presented with evidence to the contrary, that honor belongs to Nick Lowery (you can tell him about that here). The table below shows the top field goal kickers ever; let’s walk through Lowery’s line as an example.

Lowery played from 1978 to 1996. The length of his average field goal attempt was 36.6 yards, and the length of his average made field goal was 34.8 yards. Lowery attempted 479 field goals in his career; based on the distance of those kicks and the era in which he played, we would expect an average kicker to have made about 337.6 of those attempts. Instead, Lowery made 383 of them, a whopping 45.4 field goals above expectation. Thought of another way, Lowery’s expected field goal rate was 70.5%, while his actual was 80.0%, so he was successful an extra 9.5% of the time he lined up to kick. That’s remarkable. In short, Lowery was the most valuable field goal kicker in NFL history. [continue reading…]

{ 76 comments }

In 1983, there were 46 field goal attempts of 52 yards or longer. That year, just 17 of them were successful… and four of them came from Baltimore Colts rookie kicker Raul Allegre. But that’s just the highlight for perhaps the best kicking season ever.

During the Colts last year in Baltimore, fans voted Allegre the team’s most valuable player. And with good reason: Allegre attempted 35 field goals, but given the distances of those kicks and the kicking environment in 1983, we would have expected Allegre to make 21.2 of those attempts. Instead, Allegre connected on 30 field goals, giving him 8.8 more field goals above average. That’s the highest rate in any single season ever. Yesterday, I unveiled a methodology for ranking kickers, based on two factors: the length of each field goal attempts and the year in which they kick was attempted. Using that formula, I then was able to grade every field goal kicking season since 1960.

Let’s use Nick Lowery’s 1985 season to walk through the table below. That year, playing for the Chiefs, Lowery went 4/4 on kicks from 20-29 yards, 10/11 from 30-39 yards, 7/7 from 40-49 yards, and 3/5 from over 50 yards. (Note that while I have the data on the specific distance of each attempt, it made sense to present it for consumption in this way.) He attempted 27 kicks, and given the distances and the era, was expected to be successful on 17.2 of them. Instead, he made 24, giving him 6.8 field goals above average. If you prefer to think in terms of rates, Lowery was expected to be true on 63.7% of kicks, but actually made 88.9% of his attempts; that’s 25.2% above expectation, the highest rate by any kicker with at least 25 attempts. The table below shows the top 300 seasons since 1960: [continue reading…]

{ 13 comments }

Six years ago, I took my first crack at analyzing field goal kickers. I have been meaning to update that article for each of the last three offseasons, and with the sun setting on the 2015 offseason, I didn’t want to let this slip yet again.

Ranking field goal kickers is not difficult conceptually, but it can be a bit challenging in practice. One thing I’ve yet to refine is the appropriate adjustments for playing surface, stadium, time of game, temperature, and wind. That’s a lot of adjustments to deal with, all on top of the most obvious adjustment: for era.

But as I understand it, Rome was not built in a day; further, I believe that a journey of a thousand miles begins with one step. As a result, I’m okay with only getting part of the way there for now, and punting (which is very, very different from kicking) the rest of this process to next offseason.

Let’s begin with the obvious: era adjustments are really, really, important.  To provide some examples, I looked at the field goal rates at four different increments: 22-24 yard kicks, 31-33 yard attempts, kicks from 40-42 yards away, and finally, field goal attempts from 49-51 yards.  In the graph below, I’ve plotted the success rate at those four distances for each year since 1960, along with a “best-fit” curve at each distance. Take a look: [continue reading…]

{ 5 comments }

38 Questions: A Football Perspective Contest

Below you will find 38 pairs of numbers. In each case, you tell me which number will be bigger. One point for each correct answer. Most points wins.

Ties — and I expect there to be a nontrivial number of them — go to the side that had fewer votes. For example, here is a pair:

Number of wins by the Lions
Number of wins by the Ravens

Let’s say 41 people take the Lions and 54 take the Ravens. If the Lions and Ravens end up with the same number of wins, then each Lions-backer will get a point and each Ravens-backer will not.

GRAND PRIZE: the main prizes will be (1) honor and (2) glory. There will also be some sort of trinket to be named later. By the time this thing is over, more than five months will have passed, so that gives me some time to scrape something together. But you probably shouldn’t enter unless honor and glory are sufficient.

MORE RULES:

1. Everyone is limited to one entry per person. This will be enforced by the honor system. If caught breaking this rule, you, your children, and your children’s children will be banned from all future FP contests.

2. I won’t enter the contest myself, which will allow me to arbitrate any dispute impartially. Any ambiguities in the rules will be clarified by me in whatever way causes me the least amount of hassle.

3. While there are quite a few items that refer in some way to the NFL postseason, unless specifically stated, all the items below refer to regular season totals only. For example, here’s a pair:

Margin of the Titans biggest win.
Number of Passing TDs thrown by Marcus Mariota.

This one will be decided based on the Titans regular season and Mariota’s regular season numbers. I’d hate for there to be confusion when Tennessee wins a playoff game by 28.

4. If you try to get cute and complain that the Titans one-point win over the Colts was actually their “biggest win” even though it wasn’t their win with the biggest point margin, see rule #2. Ignoring your comment is generally my hassle-minimization strategy of choice.

5. You may enter until 1:00 p.m. Eastern time on Sunday, September 13th, 2015. However, you can earn a bonus of two (2) points if you enter before kickoff of Thursday’s game.

6. In the event that the contest ends in a tie, the winner will be the person whose entry was submitted first.

HOW TO ENTER: Cut-and-paste the list of questions below into your editor of choice, delete the choices you don’t like (thereby leaving the ones you do like), and then cut-and-paste your 38 answers into the comments of this thread. Do not worry about whether the players are linked to their PFR page or not. Please do not edit the text in any way other than deleting half of it. If you want to leave non-entry comments, you are free to do so either at the very end of your entry or in a subsequent comment, but please do not put commentary in the body of your entry. [continue reading…]

{ 99 comments }

2014 Defensive Adjusted Yards per Carry Data

A couple of weeks ago, I looked at the Adjusted Yards per Carry data for 2014 offenses; today, the same information but for the other side of the ball. As a reminder, here’s the formula for calculating Adjusted Yards per Carry:

Adjusted Rushing Yards per Carry = (Rush Yards + 11 * Rush TDs + 9 * Rush First Downs – Kneel Yards Lost ) / (Rushes – Kneels)

Let’s use the Detroit Lions defense as an example. The Lions faced 350 rush attempts last year and allowed 1,109 rushing yards and eight touchdowns. However, seven of those rushing attempts were actually kneels by the opponent (for -7 “rushing yards”), so we need to back those out of the data. The Lions also allowed 59 rushing first downs, or a first down on 17.2% of all carries. As a result, Detroit allowed 5.06 Adjusted Rushing Yards per Carry last year, the best rate in the NFL. The league average last year was 6.63, which means the Lions were over a yard and a half above average per carry. Multiply that difference by the 343 non-kneel runs that Detroit faced, and the Lions rush defense was 541 Adjusted Rushing Yards above average (here, negative is better), the top value-producing rush defense in the NFL in 2014. [continue reading…]

{ 1 comment }

Data Dump: Quarterback/Coach Pairs

Reading 538’s NFC East preview got me thinking about head coach and quarterback pairs. The Giants are currently enjoying a very long stretch of quarterback/coach consistency, but New York’s franchise history is filled with that sort of commitment. Washington, meanwhile, has not had one quarterback/coach combination reach five years together in 30 seasons!

So today, a quick data dump. Below are all instances where one coach and one quarterback were together for at least five seasons for each franchise. A quarterback gets credit for a season if he led his team in passing yards that year. For each team, I’ve listed the number of years the coach/quarterback were together in parentheses. [continue reading…]

{ 2 comments }

AV Retention Rates, 2013-2014

Change is inherent in the very fabric of the NFL. From year to year, little stays the same for most teams. But the team that changed the least from 2013 to 2014 was … the Dallas Cowboys?

There were six Dallas players who produced 12 or more points of Approximate Value last year: DeMarco Murray, Tony Romo, Tyron Smith, Dez Bryant, Zack Martin, and Travis Frederick. Of that group, all but Martin were key contributors in 2013, too. As measured by AV, the only big changes for the Cowboys were the losses of Jason Hatcher (8 points of AV in 2013), DeMarcus Ware (5) and Sean Lee (5). And other than Martin, the only notable players for the team last year that weren’t key parts of the team in 2013 were DE Jeremy Mincey, FS J.J. Wilcox, OLB Anthony Hitchens, ILB Rolando McClain, and DE Tyrone Crawford. And, perhaps, another reason the Cowboys may have appeared to have little turnover last year? Dallas generally stayed very healthy, which is one way of keeping the same players in the lineup year over year. [continue reading…]

{ 2 comments }

Bill Cowher And Coaches Retiring Early

It’s been nearly a decade since Bill Cowher stopped coaching, but that hasn’t done much to keep his name out of the rumor mill every December and January. After all, Cowher was both very successful and very young when he retired, and NFL folks believe those dots can be connected to mean he won’t stay retired forever.

That made me wonder: how much of an outlier is Cowher with respect to his age and how successful he was? In particular, Cowher was successful at the end of his stint, which differentiates him from someone like Jon Gruden. Defining “success” is challenging when it comes to coaches, but I want to just generate a set of comparable modern coaches and see how they fared at the ends of their careers and when they retired. I don’t need a particularly precise coaching formula, just something that gets the job done.

As it turns out, six years ago, I created a rudimentary formula to rank head coaching records. Let’s use Cowher’s last three years as an example. This formula gives credit for wins above losses, so Cowher gets a 0 for his work in 2006, his final year, when Pittsburgh went 8-8. The prior year, the Steelers went 11-5, so that’s +6, but I also gave a 12-point bonus for winning the Super Bowl, so he gets a +18 for that season. And in ’04, Pittsburgh went 15-1, so that’s +14. Add it up, and Cowher has a +32 score over his last 3 years. And he was just 49 years old during his final season. [continue reading…]

{ 13 comments }

Checkdowns: 538: NFC North Preview

Over at FiveThirtyEight, you can read my preview of the NFC North teams. Spoiler: the Bears are not very good at defense, the Lions are never very good at defense (except last year!), the Vikings are young but what does that mean?, and the Packers don’t acquire players from other teams.

Enjoy!

{ 2 comments }
Previous Posts