≡ Menu

We’ve come to the end of the line. After several posts ranking and reranking, thinking and rethinking, quarterbacks with Total Adjusted Yards per Play and its descendants, this is the one I imagine most readers really want to see. Today, we are looking at measured performance in the regular season and playoffs combined. This is where guys like Y.A. Tittle, who feasted in the regular season but nearly always faltered in the postseason, see their positions fall down the list. Where passers like Jim Plunkett, whose regular season performances left much to be desired but went full tilt bozo in the playoffs, rise up the ranks. As far as the NFL record book is concerned, the playoffs don’t count toward career stats or win-loss totals. While I understand not rewarding players for getting to participate in more games, I can see the argument that it is equally unfair not to reward them for playing well enough to continue the march toward a championship. In order to balance those ideas, I have only counted playoff performances that measured above average by TAY/P.

A quick word on the numbers I’m using. You can find more detail in previous articles in the series, but this should be sufficient to introduce the rookies and refresh the veterans. [continue reading…]

{ 0 comments }

Adam Steele is back (sort of) with the results of the greatest team of all time installment of his Wisdom of Crowds project. He was busy and asked me to do the writeup, so I shall do my best to do it justice.


This wasn’t exactly the busiest ballot topic—we only received 14 ballots, 12 of which were accepted. [1]One ballot had just 10 teams, and the other contained a few duplicate teams. So, with the caveat that the sample size is dreadfully small, the Football Perspective readers chose the 1985 Chicago Bears as the greatest team of all time. I don’t think that comes as much of a surprise to anyone. Also expected, the juggernaut 1991 Washington squad that probably gets underrated in most circles due to the lack of a Hall of Fame passer, took silver, and the dominant 1962 Packers snagged a bronze. [continue reading…]

References

References
1 One ballot had just 10 teams, and the other contained a few duplicate teams.
{ 0 comments }

Wisdom of Crowds: Greatest Team in NFL History

Adam Steele is back with a new entry into his Wisdom of Crowds series, and we thank him for it. Below are Adam’s thoughts.


We’re in the dog days of the offseason, so what better time for another Wisdom of the Crowds exercise? This time, Football Perspective readers will be voting on the greatest teams in NFL history. For the sake of accessibility, the rules will be even simpler than usual:

  • List your top 25 team seasons of all time in numerical order (For example, the 2008 Lions)
  • All teams from the NFL, AFL, and AAFC are eligible (Like the undefeated and untied 1948 Browns)
  • Winning a championship is not required for inclusion (Hello, 2007 Patriots)
  • Multiple seasons from the same dynasty are permitted (1975 and 1976 Steelers? Why not?)

Polls will be open for two weeks after this is posted. As always, comments and discussion are strongly encouraged. Let’s go!


{ 0 comments }

Wisdom of Crowds Wide Receiver Edition: Results

Adam Steele is back to provide a recap for his Wisdom of Crowds project, and we thank him for it.


After two weeks of polling, we received 20 legal ballots and lots of great discussion. Thank you to everyone who participated! Let’s get straight to the results:


In this table you’ll see total points for each WR, average points per ballot, and the specific points distribution by each voter. I only ranked players who were listed on more than one ballot. Now you can compare your votes to others’ side by side!

To the surprise of absolutely no one, Jerry Rice is the runway winner for Greatest Wide Receiver of All-Time. He’s probably the only player in NFL history at any position that has no holes in his resume. Rice had a dominant peak, absurd longevity, holds every postseason record, and gave 100% effort at all times. He may very well be the greatest football player ever, period. [continue reading…]

{ 0 comments }

Nick the Kick

Nick the Kick

On Tuesday, I explained the formula used in my system of grading field goal kickers, which is based on field goal success rate adjusted for distance and era.  Yesterday, I looked at the single-season leaders using that methodology. Today, we look at the best field goal kickers since 1960 on the career level.

And frankly, it’s not much of a question as to who is the best kicker ever. Until presented with evidence to the contrary, that honor belongs to Nick Lowery (you can tell him about that here). The table below shows the top field goal kickers ever; let’s walk through Lowery’s line as an example.

Lowery played from 1978 to 1996. The length of his average field goal attempt was 36.6 yards, and the length of his average made field goal was 34.8 yards. Lowery attempted 479 field goals in his career; based on the distance of those kicks and the era in which he played, we would expect an average kicker to have made about 337.6 of those attempts. Instead, Lowery made 383 of them, a whopping 45.4 field goals above expectation. Thought of another way, Lowery’s expected field goal rate was 70.5%, while his actual was 80.0%, so he was successful an extra 9.5% of the time he lined up to kick. That’s remarkable. In short, Lowery was the most valuable field goal kicker in NFL history. [continue reading…]

{ 76 comments }

In 1983, there were 46 field goal attempts of 52 yards or longer. That year, just 17 of them were successful… and four of them came from Baltimore Colts rookie kicker Raul Allegre. But that’s just the highlight for perhaps the best kicking season ever.

During the Colts last year in Baltimore, fans voted Allegre the team’s most valuable player. And with good reason: Allegre attempted 35 field goals, but given the distances of those kicks and the kicking environment in 1983, we would have expected Allegre to make 21.2 of those attempts. Instead, Allegre connected on 30 field goals, giving him 8.8 more field goals above average. That’s the highest rate in any single season ever. Yesterday, I unveiled a methodology for ranking kickers, based on two factors: the length of each field goal attempts and the year in which they kick was attempted. Using that formula, I then was able to grade every field goal kicking season since 1960.

Let’s use Nick Lowery’s 1985 season to walk through the table below. That year, playing for the Chiefs, Lowery went 4/4 on kicks from 20-29 yards, 10/11 from 30-39 yards, 7/7 from 40-49 yards, and 3/5 from over 50 yards. (Note that while I have the data on the specific distance of each attempt, it made sense to present it for consumption in this way.) He attempted 27 kicks, and given the distances and the era, was expected to be successful on 17.2 of them. Instead, he made 24, giving him 6.8 field goals above average. If you prefer to think in terms of rates, Lowery was expected to be true on 63.7% of kicks, but actually made 88.9% of his attempts; that’s 25.2% above expectation, the highest rate by any kicker with at least 25 attempts. The table below shows the top 300 seasons since 1960: [continue reading…]

{ 13 comments }

Brad Oremland is a longtime commenter and a fellow football historian. Brad is also a senior NFL writer at Sports Central. There are few who have given as much thought to the history of quarterbacks and quarterback ranking systems as Brad has over the years. What follows is Brad’s latest work on the greatest quarterbacks of all time.

Part I: Pre-Modern Era
Part II: 49-101
Part III: 40-48
Part IV: 31-39
Part V: 21-30
Part VI: 11-20
Part VII: 6-10
Part VIII: 1-5


I’ve been studying NFL history my whole life, but until this year, I never published my list of the greatest quarterbacks in NFL history. This is the final installment in an eight-part series, so let’s review the list thus far.

The best pre-Modern Era quarterbacks: Sammy Baugh, Dutch Clark, Ed Danowski, Paddy Driscoll, Benny Friedman, Arnie Herber, Cecil Isbell, Sid Luckman, Bernie Masterson, Ace Parker, and Bob Waterfield. [continue reading…]

{ 488 comments }

Brad Oremland is a longtime commenter and a fellow football historian. Brad is also a senior NFL writer at Sports Central. There are few who have given as much thought to the history of quarterbacks and quarterback ranking systems as Brad has over the years. What follows is Brad’s latest work on the greatest quarterbacks of all time.

Part I: Pre-Modern Era
Part II: 49-101
Part III: 40-48
Part IV: 31-39
Part V: 21-30
Part VI: 11-20
Part VII: 6-10
Part VIII: 1-5


This week, I’m profiling the players who rank 6-10 on my list, counting down toward number one. Please note: at this point, we’re talking about the best of the best QBs. When I mention a player’s weaknesses, I’m not trying to insult him, just explaining why he doesn’t rate even higher.

10. Roger Staubach
Dallas Cowboys, 1969-79
22,700 yards, 153 TD, 109 INT, 83.4 rating

Roger Staubach was the best quarterback of the 1970s. He led all passers in rating and in TD/INT differential (+45), the latter nearly doubling a second-place tie between Fran Tarkenton and Kenny Anderson (+24). Despite playing only eight full seasons, Staubach also ranked among the top three QBs of the ’70s in both passing yards and rushing yards. He was the first-team QB on the NFL’s All-1970s Team.

Staubach’s statistics are exceptional. He led the league in passer rating four times, and retired with the highest rating in NFL history. Staubach was distinguished by his combination of short-range and downfield accuracy. Throwing underneath, he hit the receiver in stride, but he was also a great downfield passer. A dangerous dual-threat, Staubach was also known for his running, an ability that earned him the nickname “Roger the Dodger.” Staubach rushed for 2,204 yards and 19 TDs, ranking among the top 10 rushing QBs every full season of his career. [continue reading…]

{ 186 comments }

Brad Oremland is a longtime commenter and a fellow football historian. Brad is also a senior NFL writer at Sports Central. There are few who have given as much thought to the history of quarterbacks and quarterback ranking systems as Brad has over the years. What follows is Brad’s latest work on the greatest quarterbacks of all time.

Part I: Pre-Modern Era
Part II: 49-101
Part III: 40-48
Part IV: 31-39
Part V: 21-30
Part VI: 11-20
Part VII: 6-10
Part VIII: 1-5


This week, I’m profiling the players who rank 11-20 on my list, counting down toward number one. Please note: at this point, we’re talking about the best of the best QBs. When I mention a player’s weaknesses, I’m not trying to insult him, just explaining why he doesn’t rate even higher.

20. Y.A. Tittle
Baltimore Colts, 1948-50; San Francisco 49ers, 1951-60; New York Giants, 1961-64
33,070 yards, 242 TD, 248 INT, 74.3 rating

Y.A. Tittle retired as the all-time leader in passing yards and passing TDs. Those are holy marks, passed from Tittle to Johnny Unitas, then to Fran Tarkenton and Dan Marino, on to Brett Favre and now on their way to Peyton Manning. Tittle led the NFL in passing touchdowns three times — including 36 in 1963, a record that lasted more than 20 years. [continue reading…]

{ 76 comments }

Brad Oremland is a longtime commenter and a fellow football historian. Brad is also a senior NFL writer at Sports Central. There are few who have given as much thought to the history of quarterbacks and quarterback ranking systems as Brad has over the years. What follows is Brad’s latest work on the greatest quarterbacks of all time.

Part I: Pre-Modern Era
Part II: 49-101
Part III: 40-48
Part IV: 31-39
Part V: 21-30
Part VI: 11-20
Part VII: 6-10
Part VIII: 1-5


This week, I’m profiling the players who rank 21-30 on my list. The players are ranked in order, but please don’t read too much into that: I consider this a group of quarterbacks, all roughly the same level. If you’re outraged that #26 is higher than #29, you have my blessing to flip them.

30. John Brodie
San Francisco 49ers, 1957-73
31,548 yards, 214 TD, 224 INT, 72.3 rating
[continue reading…]

{ 110 comments }

Brad Oremland is a longtime commenter and a fellow football historian. Brad is also a senior NFL writer at Sports Central. There are few who have given as much thought to the history of quarterbacks and quarterback ranking systems as Brad has over the years. What follows is Brad’s latest work on the greatest quarterbacks of all time.

Part I: Pre-Modern Era
Part II: 49-101
Part III: 40-48
Part IV: 31-39
Part V: 21-30
Part VI: 11-20
Part VII: 6-10
Part VIII: 1-5


This week, I’m profiling the players who rank about 30-40 on my list. The players are ranked in order, but please don’t read too much into that: I consider this a group of quarterbacks, all roughly the same level. If you’re furious that #34 is higher than #37, you have my blessing to flip them.

39. Steve McNair
Houston/Tennessee Oilers/Titans, 1995-2005; Baltimore Ravens, 2006-07
31,304 yards, 174 TD, 119 INT, 82.8 rating

Mark Brunell, Rich Gannon, Jeff Garcia, and Steve McNair all played in the late ’90s and early ’00s, with low INT rates and excellent running. They’re easy to compare. The stats below include sacks:

QuarterbackAttYdsTDINTRatingNY/ARushYdsTD
Brunell503029,67718410884.05.90513242115
Gannon450827,05418010484.76.00521244921
Garcia385724,5901618387.56.38468214026
McNair479829,73717411982.86.20669359037

McNair has the lowest passer rating, but the most net yards (33,327) and the most total touchdowns (211). He and Brunell had the most good seasons, he and Gannon were named NFL MVP, and McNair stands alone as a playmaking scrambler. Only five players in NFL history have 30,000 passing yards and 3,000 rushing yards: John Elway, Donovan McNabb, Fran Tarkenton, Steve Young, and Steve McNair. As a dual-threat QB, McNair was one of the finest ever to play. His 64 rushing yards in Super Bowl XXXIV is the record for quarterbacks. [continue reading…]

{ 98 comments }

Brad Oremland is a longtime commenter and a fellow football historian. Brad is also a senior NFL writer at Sports Central. There are few who have given as much thought to the history of quarterbacks and quarterback ranking systems as Brad has over the years. What follows is Brad’s latest work on the greatest quarterbacks of all time.

Part I: Pre-Modern Era
Part II: 49-101
Part III: 40-48
Part IV: 31-39
Part V: 21-30
Part VI: 11-20
Part VII: 6-10
Part VIII: 1-5


This week, I’m profiling the players who rank about 40-48 on my list, in alphabetical order:

Charlie Conerly
New York Giants, 1948-61
19,488 yards, 173 TD, 167 INT, 68.2 rating

The hype was always there for Chuck Conerly. He was a star at Ole Miss, and he was the Giants’ quarterback when they were the only team in New York. Playing for a coaching staff that included Tom Landry and Vince Lombardi, alongside Hall of Fame players like Rosey Brown, Frank Gifford, Sam Huff, Andy Robustelli, and Emlen Tunnell, Conerly was set up for success. The Giants were competitive every season, and they won an NFL championship in 1956. [continue reading…]

{ 11 comments }

Brad Oremland is a longtime commenter and a fellow football historian. Brad is also a senior NFL writer at Sports Central. There are few who have given as much thought to the history of quarterbacks and quarterback ranking systems as Brad has over the years. What follows is Brad’s latest work on the greatest quarterbacks of all time.

Part I: Pre-Modern Era
Part II: 49-101
Part III: 40-48
Part IV: 31-39
Part V: 21-30
Part VI: 11-20
Part VII: 6-10
Part VIII: 1-5


I’ve been studying NFL history throughout my life. It’s a journey that began the first time I watched my dad’s copy of NFL’s Greatest Hits on VHS, accelerating when I read Total Football II, and continuing when I began sportswriting over a decade ago.

Something I’ve never done is publish my list of the greatest quarterbacks in NFL history. I’m finally stepping into the ring. But because I’ve done so much research over the years, this is not a simple list. Instead, I’ll present my choices as a series of articles, highlighting about 10 players per list, and counting down to number one. We began last week, with quarterbacks who preceded the Modern Era, like Sammy Baugh and Sid Luckman. [continue reading…]

{ 43 comments }

Brad Oremland is a longtime commenter and a fellow football historian. Brad is also a senior NFL writer at Sports Central. There are few who have given as much thought to the history of quarterbacks and quarterback ranking systems as Brad has over the years. You may recall that in April, he gave us a sneak peak at some quarterback rankings. Today, we begin seeing the words behind those numbers, starting with the pre-modern era quarterbacks.

Part I: Pre-Modern Era
Part II: 49-101
Part III: 40-48
Part IV: 31-39
Part V: 21-30
Part VI: 11-20
Part VII: 6-10
Part VIII: 1-5


I’ve been studying NFL history throughout my adult life. It’s a journey that began the first time I watched my dad’s copy of NFL’s Greatest Hits on VHS, accelerating when I read Total Football II, and continuing when I began sportswriting over a decade ago.

Something I’ve never done is to publish my list of the greatest quarterbacks in NFL history. Sparked by Adam Steele’s crowd-sourcing project here at Football Perspective, I’m finally stepping into the ring. But because I’ve done so much research over the years, this is not a simple list. Instead, I’ll present my choices as a series of articles, highlighting about 10 players per list, and counting down to number one. [continue reading…]

{ 10 comments }

The GOAT.

The GOAT.

On February 20th, Football Perspective hosted a “Wisdom of Crowds” election with respect to the question: Who is the Greatest Running Back of All Time?™ Well, Football Perspective guest commenter Adam Steele offered to count the ballots, and I’ll chime in with some commentary.

There were 41 ballots entered, with each person ranking his or her top 20 running backs. The scoring system was simple: 20 points for a 1st place vote, 19 for a 2nd place vote, and so on. As it turns out, the race for the top spot was heated, with three players running away from the pack.

This chart is sortable by total points, points per ballot (using 41 as the denominator), GOAT votes, top 5 votes, and top 10 votes. In the interest of statistical significance, a player needed to appear on at least five ballots in order to be ranked in the table below. [continue reading…]

{ 113 comments }

Beginning on Friday the 6th, Football Perspective hosted a “Wisdom of Crowds” election with respect to that age old question: Who is the Greatest Quarterback of All Time?™ Well, Football Perspective guest commenter Adam Steele offered to count the ballots and provide a summary. What follows are his words, and the results from the contest.


Two of the greatest  quarterbacks of all time

Two of the greatest quarterbacks of all time

First, I want to offer my sincere appreciation to all the readers who participated in this project, as it wouldn’t have been possible without your contributions. We generated over 300 comments and lots of great discussion. And, as you’re about to see, every vote really did matter.

After tallying 80 ballots, 2,000 votes, and 26,000 ranking points, the difference between first and second place was just eight points. That’s insane. Well, I won’t tease you any longer, so here are the results:

This chart is sortable by total points, points per ballot (using 80 as the denominator), GOAT votes, top 10 votes, and top 25 votes. In the interest of statistical significance, a player needed to appear on at least five ballots in order to be ranked in the table below. [continue reading…]

{ 159 comments }
Brady likes the second half of the season

Brady likes the second half of the season

When we think about the most dominant teams of all time, the New England Patriots of the last few years don’t leap immediately to mind. Yet, their performance late in the year has been mind-bogglingly good. From 2010-13, New England went 29-3 in the final eight games of each season, a record that no other team since 1960 can match over any four-year period. Including their three games this year, the Patriots are on a 32-3 run in regular-season games in the second half of the season. From 2010-2013, the Patriots also have the biggest four-year point differential in second-half games in the history of football.

Part of that huge point differential comes from the higher point totals that teams have than they did in the past, and from New England’s offensive-centric philosophy. As a result, when we look at Pythagenpat records, the Patriots are not as dominant. [1]I used 0.251 as the value in the Pythagenpat formula to find exponents for each team-year. Here are the hundred best late-season teams over any four-year period, according to Pythagenpat record. The Patriots from 2010-13 rank only 38th on the list, behind four other recent Patriots’ runs, some of those overlapping with 2010-13. The Patriots have been great and it is an unlikely outcome that they’d have no Super Bowls in the decade so far, but they also have not been quite as strong in terms of their true strength as their second-half records would suggest. As a high-scoring team, we would have expected them to lose more of their regular season games than they have. [continue reading…]

References

References
1 I used 0.251 as the value in the Pythagenpat formula to find exponents for each team-year.
{ 3 comments }

These two men look important

The two best regular season quarterbacks of all time?

Yesterday, I explained the methodology behind the formula involved in ranking every quarterback season since 1960. Today, I’m going to present the career results. Converting season value to career value isn’t as simple as it might seem. Generally, we don’t want a player who was very good for 12 years to rank ahead of a quarterback who was elite for ten. Additionally, we don’t want to give significant penalties to players who struggled as rookies or hung around too long; we’re mostly concerned with the peak value of the player.

What I’ve historically done — and done here — is to give each quarterback 100% of his value or score from his best season, 95% of his score in his second best season, 90% of his score in his third best season, and so on. This rewards quarterbacks who played really well for a long time and doesn’t kill players with really poor rookie years or seasons late in their career. It also helps to prevent the quarterbacks who were compilers from dominating the top of the list. For visibility reasons, the table below displays only the top 25 quarterbacks initially, but you can change that number in the filter or click on the right arrow to see the remaining quarterbacks. [1]Note that while yesterday’s list was just from 1960 to 2013, the career list reflects every season in history, using the same methodology as used in GQBOAT IV.

Here’s how to read the table. Manning’s first year was in 1998, and his last in 2013. He’s had 8,740 “dropbacks” in his career, which include pass attempts, sacks, and rushing touchdowns. His career value — using the 100/95/90 formula [2]And including negative seasons. is 12,769, putting him at number one. His strength of schedule has been perfectly average over his career; as a reminder, the SOS column is shown just for reference, as SOS is already incorporated into these numbers (so while Tom Brady has had a schedule that’s 0.25 ANY/A tougher than average, that’s already incorporated into his 10,063 grade). Manning is not yet eligible for the Hall of Fame, of course, but I’ve listed the HOF status of each quarterback in the table. Note that I only have quarterback records going back to 1960; therefore, for quarterbacks who played before and during (or after) 1960, only their post-1960 record is displayed. In addition, SOS adjustments are only for the years beginning in 1960. [continue reading…]

References

References
1 Note that while yesterday’s list was just from 1960 to 2013, the career list reflects every season in history, using the same methodology as used in GQBOAT IV.
2 And including negative seasons.
{ 109 comments }
Can you spot the GOAT?

Can you spot the GOAT?

In 2006, I took a stab at ranking every quarterback in NFL history. Two years later, I acquired more data and made enough improvements to merit publishing an updated and more accurate list of the best quarterbacks the league has ever seen. In 2009, I tweaked the formula again, and published a set of career rankings, along with a set of strength of schedule, era and weather adjustments, and finally career rankings which include those adjustments and playoff performances.  And two years ago, I revised the formula and produced a new set of career rankings.

This time around, I’m not going to tweak the formula much (that’s for GQBOAT VI), but I do have one big change that I suspect will be well-received.  Let’s review the methodology.

Methodology

We start with plain old yards per attempt. I then incorporate sack data by removing sack yards from the numerator and adding sacks to the denominator. [1]I have individual game sack data for every quarterback back to 2008. For seasons between 1969 and 2007, I have season sack data and team game sack data, so I was able to derive best-fit estimates for … Continue reading To include touchdowns and interceptions, I gave a quarterback 20 yards for each passing touchdown and subtracted 45 yards for each interception. This calculation — (Pass Yards + 20 * PTD – 45 * INT – Sack Yards Lost) / (Sacks + Pass Attempts) forms the basis for Adjusted Net Yards per Attempt, one of the key metrics I use to evaluate quarterbacks. For purposes of this study, I did some further tweaking. I’m including rushing touchdowns, because our goal is to measure quarterbacks as players. There’s no reason to separate rushing and passing touchdowns from a value standpoint, so all passing and rushing touchdowns are worth 20 yards and are calculated in the numerator of Adjusted Net Yards per Attempt. To be consistent, I also include rushing touchdowns in the denominator of the equation. This won’t change anything for most quarterbacks, but feels right to me. A touchdown is a touchdown.

Now, here comes the twist.  In past year, I’ve compared each quarterback’s “ANY/A” — I put that term in quotes because what we’re really using is ANY/A with a rushing touchdowns modifier — and then calculated a value over average statistic after comparing that rate to the league average. For example, if a QB has an “ANY/A” of 7.0 and the NFL average “ANY/A” is 5.0, and the quarterback has 500 “dropbacks” — i.e., pass attempts plus sacks plus rushing touchdowns — then the quarterback gets credit for 1,000 yards above average. [continue reading…]

References

References
1 I have individual game sack data for every quarterback back to 2008. For seasons between 1969 and 2007, I have season sack data and team game sack data, so I was able to derive best-fit estimates for each quarterback in each game. For seasons between 1960 and 1969, I gave each quarterback an approximate number of sacks, giving him the pro-rated portion of sacks allowed by the percentage of pass attempts he threw for the team.
{ 41 comments }

Even for Football Perspective, this is a very math-heavy post. I’ve explained all the dirty work and fine details behind this system, but if you want to skip to the results section, I’ll understand. Heck, it might even make more sense to start there and then work your way back to the top.

Background

In 2012, Neil Paine wrote a fascinating article on championship leverage in the NBA, building on Tom Tango’s work on the same topic in Major League Baseball. Championship Leverage was borne out of the desire to quantify the relative importance of any particular playoff game. Truth be told, this philosophy has more practical application in sports where each playoff round consists of a series of games. But Neil applied this system to the NFL playoffs and crunched all the data for every playoff game since 1965. Then he was kind enough to send it my way, and I thought this data would make for a good post.

The best way to explain Championship Leverage is through an example. For purposes of this exercise, we assume that every game is a 50/50 proposition. At the start of the playoffs, the four teams playing on Wild Card weekend all have a 1-in-16 chance of winning the Super Bowl (assuming a 50% chance of winning each of four games). This means after the regular season ended, the Colts had a 6.25% chance of winning the Super Bowl. After beating Kansas City, Indianapolis’ win probability doubled to 12.5%. Win or lose, the Colts’ Super Bowl probability was going to move by 6.25%, a number known as the Expected Delta.

New England, by virtue of a first round bye, began the playoffs with a 12.5% chance of winning the Lombardi. With a win over Indianapolis, the Patriots’ probability of winning the Super Bowl jumped 12.5% to 25%; had New England lost, the odds would have moved from 12.5% to zero. Therefore, the Expected Delta in a Division round game is 12.5%. [continue reading…]

{ 20 comments }

This guy was pretty good.

This guy was pretty good.

About a month ago, Chase & I developed a stat called True Receiving Yards, which seeks to put all modern & historical receiving seasons on equal footing by adjusting for the league’s passing YPG environment & schedule length, plus the amount the player’s team passed (it’s easier to produce raw receiving stats on a team that throws a lot), with bonuses thrown in for touchdowns and receptions. It’s not perfect — what single stat in a sport with so many moving parts is? — but it does a pretty good job of measuring receiving productivity across different seasons and across teams with passing games that operated at vastly different volumes.

Anyway, today’s post is basically a data dump to let everyone know we’ve extended TRY data back to 1950 (before, it was only computed for post-merger seasons). Here are the new all-time career leaders among players who debuted in 1950 or later (see below for a key to the column abbreviations):
[continue reading…]

{ 13 comments }

Straight cash, homey.

Straight cash, homey.

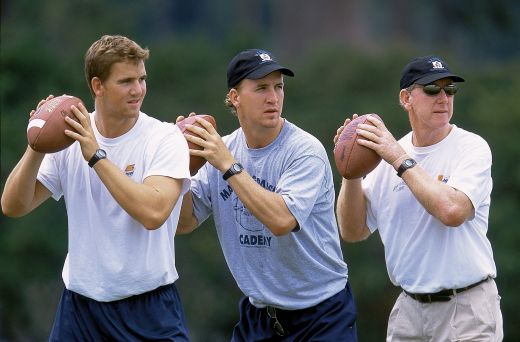
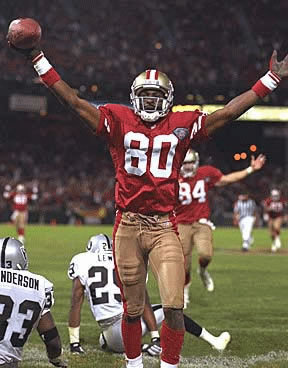
In 1998, 21-year-old Randy Moss made a stunning NFL debut, racking up 17 touchdowns and 1,260 True Receiving Yards, the 2nd-best total in football that season. The Vikings’ primary quarterback that year, Randall Cunningham, was a former Pro Bowler and MVP, but all that seemed like a lifetime ago before the ’98 season. He’d been out of football entirely in 1996, and in 1997 he posted an Adjusted Net Yards per Attempt average that was 1.2 points below the league’s average (for reference’s sake, replacement level is usually around 0.75 below average). With Moss in ’98, though, Cunningham’s passing efficiency numbers exploded: he posted a career best +3.2 Relative Adjusted Net Yards per Attempt, miles ahead of his perfectly-average overall career mark. If we adjust for the fact that Cunningham was also 35 at the time (an age at which quarterbacks’ RANY/A rates tend to be 1.1 points below what they are at age 27), Cunningham’s 1998 rate was actually 4.3 points better than we’d expect from the rest of his career, a staggering outlier.

The following year, Jeff George took over as the Vikings primary quarterback, and he promptly posted a Relative ANY/A 2.2 points higher than expected based on his age and the rest of his career. [1]Cunningham’s RANY/A was also 1.0 better than expected in limited action. George left Moss and Minnesota after the season, and he would throw only 236 passes the rest of his career, producing a cumulative -0.6 RANY/A in Washington before retiring.

From 2000-04, Moss was the primary target of Daunte Culpepper, whose RANY/A was 0.7 better than expected (based on Culpepper’s career numbers) when Moss was around. [2]That number is an average weighted by the number of TRY Moss had in each season Although he’d enjoyed one of the best quarterback seasons in NFL history in 2004, Culpepper was never the same after Moss was traded to Oakland; in fact, he never even had another league-average passing season, producing a horrible -1.2 RANY/A from 2005 until his retirement in 2009. [3]To be fair, Culpepper tore his ACL, MCL, and PCL halfway through the 2005 season, which also was a factor in his decline.

Moss’s stint with the Raiders was famously checkered — although Kerry Collins’ RANY/A was 0.6 better than expected in 2005, Aaron Brooks played 2.5 points of RANY/A below his previous standards in 2006 — but we all know what happened when he joined the Patriots in 2007. With Moss, Tom Brady’s RANY/A was a whopping 1.3 points higher than expected from the rest of his career, and Moss also played a big role in Matt Cassel’s RANY/A being +1.0 relative to expectations after Brady was lost for the season in 2008.

While Moss’s post-Pats career hasn’t exactly been the stuff of legends, the majority of his career (weighted by True Receiving Yards) saw him dramatically improve his quarterbacks’ play relative to the rest of their careers. In fact, his lifetime WOWY (With or Without You) mark of +1.1 age-adjusted RANY/A ranks 3rd among all receivers who: a) had at least 3,000 career TRY, b) started their careers after the merger, and c) played exclusively with quarterbacks who started their careers after the merger. And the first two names on the list are possibly explained by other means. The table below lists all 301 receivers with 3,000 career TRY. The table is fully sortable and searchable, and you can click on the arrows at the bottom of the table to scroll. The table is sorted by the QB WOWY column.
[continue reading…]

References

References
1 Cunningham’s RANY/A was also 1.0 better than expected in limited action.
2 That number is an average weighted by the number of TRY Moss had in each season
3 To be fair, Culpepper tore his ACL, MCL, and PCL halfway through the 2005 season, which also was a factor in his decline.
{ 7 comments }

This guy's 1982 Chargers sure come up a lot when we do lists like these.

This guy's 1982 Chargers sure come up a lot when we do lists like these.

More than a decade ago (on a side note: how is that possible?), Doug wrote a series of player comments highlighting specific topics as they related to the upcoming fantasy football season. I recommend that you read all of them, if for no other reason than the fact you should make it a policy to read everything Doug Drinen ever wrote about football, but today we’re going to focus on the Isaac Bruce comment, which asked/answered the question:

Is this Ram team the biggest fantasy juggernaut of all time?

“This Ram team,” of course, being the 1999, 2000, & 2001 Greatest Show on Turf St. Louis Rams. At the time, Doug determined that those Rams were not, in fact, the best real-life fantasy team ever assembled, by adding up the collective VBD for the entire roster. They ranked tenth since 1970; the top 10 were:

1. 1. 1975 Buffalo Bills – 550 Simpson (281) Ferguson (98) Braxton (83) Chandler (44) Hill (42)

2. 1982 San Diego Chargers – 542 Chandler (190) Fouts (126) Winslow (121) Muncie (92) Brooks (10) Joiner (1)

3. 1994 San Francisco 49ers – 514 Young (208) Rice (140) Watters (98) Jones (67)

4. 1995 Detroit Lions – 478 Mitchell (136) Moore (132) Sanders (121) Perriman (87)

5. 1984 Miami Dolphins – 470 Marino (243) Clayton (145) Duper (76) Nathan (6)

6. 1998 San Francisco 49ers – 467 Young (200) Hearst (137) Owens (81) Rice (46) Stokes (1)

7. 1986 Miami Dolphins – 456 Marino (210) Duper (94) Clayton (76) Hampton (61) Hardy (13)

8. 2000 Minnesota Vikings – 452 Culpepper (170) Moss (123) Smith (87) Carter (70)

9. 1991 Buffalo Bills – 449 Thomas (157) Kelly (143) Reed (80) Lofton (51) McKeller (17)

10. 1999 St. Louis Rams – 435 Faulk (184) Warner (179) Bruce (71)

As an extension of Chase’s recent post on the The Best Skill Position Groups Ever, we thought it might be useful to update Doug’s study in a weekend data-dump post. I modified the methodology a bit — instead of adding up VBD for the entire roster, for each team-season I isolated the team’s leading QB and top 5 non-QBs by fantasy points (using the same point system I employed when ranking the Biggest Fluke Fantasy Seasons Ever). I then added up the total VBD of just those players, to better treat each roster like it was a “real” fantasy team.

Anyway, here are the results. Remember as well that VBD is scaled up to a 16-game season, so as not to short-change dominant fantasy groups from strike-shortened seasons (:cough:1982 Chargers:cough:).
[continue reading…]

{ 1 comment }

I prefer cooking in a Garrison  Hearst replica jersey

I prefer cooking in a Garrison Hearst replica jersey.

There’s nothing like a truly great fluke fantasy season. Because they can help carry you to a league championship (and therefore eternal bragging rights — flags fly forever, after all), a random player who unexpectedly has a great season will often have a special place in the heart of every winning owner. And even if you only use their jerseys as makeshift aprons to cook in, fluke fantasy greats are a part of the fabric of football fandom. That’s why this post is a tribute to the greatest, most bizarre, fluke fantasy seasons of all time (or at least since the 1970 NFL-AFL merger).

First, a bit about the methodology. I’m going to use a very basic fantasy scoring system for the purposes of this post:

  • 1 point for every 20 passing yards
  • 1 point for every 10 rushing or receiving yards
  • 6 points for every rushing or receiving TD
  • 4 points for every passing TD
  • -2 points for every passing INT

I’m also measuring players based on Value Based Drafting (VBD) points rather than raw points. In a nutshell, VBD measures true fantasy value by comparing a player to replacement level, defined here as the number of fantasy points scored by the least valuable starter in your league. For the purposes of this exercise, I’m basing VBD on a 12-team league with a starting lineup of one QB, two RBs, 2.5 WRs, and 1 TE. That means we’re comparing a player at a given position to the #12-ranked QB, the #24 RB, the #30 WR, or the #12 TE in each season. If a player’s VBD is below the replacement threshold at his position, he simply gets a VBD of zero for the year.
[continue reading…]

{ 2 comments }

On Monday, I explained my methodology for ranking every wide receiver in football history, and yesterday, I presented a list of the best single seasons of all time. Today the career list of the top 150 wide receivers. As usual, I implemented a 100/95/90 formula, giving a player credit for 100% of his production in his best season, 95% of his value in his second-best season, 90% in his third year, and so on. The table below is fully sortable and lists the first and last year each person played wide receiver [1]Note that I have excluded seasons where a wide receiver played running back or tight end. This is generally not a big deal, but does hurt someone like Lenny Moore.; you can use the search feature to find the best receiver to ever play for each team (for example, typing ‘ram’ for the Rams ‘clt’ for the Colts.)
[continue reading…]

References

References
1 Note that I have excluded seasons where a wide receiver played running back or tight end. This is generally not a big deal, but does hurt someone like Lenny Moore.
{ 55 comments }

Yesterday, I explained my methodology for ranking every wide receiver in football history. Today I’m going to present a list of single-season leaders, which presents some problems.

I think the method I described yesterday does a good job adjusting for era, as receivers are only given credit for their yards above the baseline, which is different each season. But there are some other complicating factors unique to football. Seasons have had varying lengths: a receiver who plays 12 games in a 12-game season can’t be penalized the way you would penalize a receiver who only plays in 12 games now. Since older receivers are generally at a disadvantage for many reasons, I decided to simply pro-rate the value for all non-16 game seasons as if it was a 16-game season. However, I have also included downward adjustments for players in other leagues and during World War II. [1]The fine print: For players in 1943, 1944, and 1945, and for players in the AAFC, I only gave the receivers credit for 60% of the value they created. For the AFL, I gave players 60% of their value in … Continue reading

The table below lists the top 200 wide receiver seasons of all-time.
[continue reading…]

References

References
1 The fine print: For players in 1943, 1944, and 1945, and for players in the AAFC, I only gave the receivers credit for 60% of the value they created. For the AFL, I gave players 60% of their value in 1960 and 1961, 70% in 1962, 80% in 1963, 90% in 1964, and 100% in 1965 through 1969. In case it wasn’t obvious, all of these adjustments are arbitrary.
{ 12 comments }

We know how this story will end.

We know how this story will end.

Regular readers know that one of my projects this off-season is to come up with a better way to grade wide receivers. I first attempted to rank every wide receiver four years ago. That study, which I will reproduce this week, has some positives and negatives. My goal is to eventually come up with four or five different ranking systems, so consider the series this week to be the first of several ranking systems to come.

The first step in this system is to combine the three main stats — receptions, receiving yards and receiving touchdowns — into one stat: Adjusted Catch Yards. We know that a passing touchdown is worth about 20 yards, so I’m crediting a receiver with 20 yards for every touchdown reception. Next, we need to decide on an appropriate bonus for each reception.

We want to give receivers credit for receptions because, all else being equal, a receiver with more receptions is providing more value because he’s likely generating more first downs. I looked at all receivers over a 12-year period who picked up at least 30 receiving first downs. I then used the number of receptions and receiving yards those players had as inputs, and performed a regression to estimate how many first downs should be expected. The best-fit formula was:
[continue reading…]

{ 6 comments }

The original standard for postseason success.

On Wednesday, I explained the methodology for grading each quarterback in each season. Yesterday, I came up with an all-time career list of the best quarterbacks based on their regular season play. Today, a look at playoff performances.

Using the same formula, we can grade each quarterback in each game and adjust for era [1]Note that I do not have individual playoff sack data prior to 2008, so I am using pro-rated sack numbers based on team sack data.. However, it should be obvious that the sample sizes here are incredibly small, and the stats are even less likely to tell the true story when looking at just one game. Strength of schedule becomes a significant factor here, as well. But, caveats aside, there’s a lot we can do with playoff data. For example, we can rank every quarterback performance in Super Bowl history:

RkQBTmOppSBW/LAttPydTDINTCYCYPVAL
1Joe MontanaSFOMIA19W353313040611272
2Steve YoungSFOSDG29W363256043111.1264
3Troy AikmanDALBUF27W302734038112.3258
4Joe MontanaSFODEN24W292975039713.3256
5Kurt WarnerSTLTEN34W45414204479.7225
6Jim PlunkettOAKPHI15W212613032014.5219
7Phil SimmsNYGDEN21W252683032312.4216
8Doug WilliamsWASDEN22W293404135811.6211
9John ElwayDENATL33W293361133111181
10Jim McMahonCHINWE20W202560028411.6174
11Joe MontanaSFOCIN23W36357203519165
12Jake DelhommeCARNWE38L33323303258.8146
13Tom BradyNWECAR38W48354313697.7141
14Terry BradshawPITDAL13W30318412667.8140
15Mark RypienWASBUF26W33292212878.7128
16Terry BradshawPITRAM14W213092321410.2123
17Bart StarrGNBKAN1W23250212248.7121
18Terry BradshawPITDAL10W19209202009.5121
19Aaron RodgersGNBPIT45W39304303488.3118
20Brett FavreGNBNWE31W27246202688.1111
21Drew BreesNORIND44W39288203218107
22Ken StablerOAKMIN11W19180101838.7103
23Troy AikmanDALPIT30W23209102188.791
24Kurt WarnerARIPIT43L43377313297.387
25John ElwayDENNYG21L37304112706.581
26Bart StarrGNBOAK2W24202101826.579
27Joe MontanaSFOCIN16W22157101887.876
28Tom BradyNWEPHI39W33236202597.475
29Joe NamathNYJBAL3W28206001956.568
30Peyton ManningINDNOR44L45333113086.867
31Ken AndersonCINSFO16L34300222546.467
32Jeff HostetlerNYGBUF25W32222102346.966
33Bob LeeMINOAK11L9811010010.965
34Roger StaubachDALMIA6W19119201406.763
35Steve McNairTENSTL34L36214002085.661
36Eli ManningNYGNWE46W4029610302761
37Terry BradshawPITMIN9W1496101046.559
38Kurt WarnerSTLNWE36L4436512287655
39Roger StaubachDALPIT13L30228311614.653
40Jim KellyBUFNYG25L30212002056.652
41Jim PlunkettRAIWAS18W25172101746.448
42Roger StaubachDALDEN12W25183101424.845
43Brad JohnsonTAMOAK37W34215212106.245
44Earl MorrallBALDAL5W15147011026.843
45Ben RoethlisbergerPITARI43W30256112096.537
46Bob GrieseMIAMIN8W77300637.934
47Brett FavreGNBDEN32L42256312405.634
48Daryle LamonicaOAKGNB2L34208211814.932
49Fran TarkentonMINMIA8L28182011414.531
50Gary KubiakDENNYG21L448004510.225
51Troy AikmanDALBUF28W27207011595.521
52Tom BradyNWENYG46L41276212616.120
53Len DawsonKANGNB1L27211111354.219
54Trent DilferBALNYG35W25153101545.517
55Tom BradyNWESTL36W27145101545.314
56Len DawsonKANMIN4W1714211974.910
57Gary KubiakDENSFO24L32800256.87
58Frank ReichBUFWAS26L11100109.45
59Steve YoungSFODEN24W32000206.55
60Vince FerragamoRAMPIT14L25212011274.44
61Danny WhiteDALDEN12W250031.14
62Matt HasselbeckSEAPIT40L49273112344.53
63Ben RoethlisbergerPITGNB45L40263222115.12
64Bill MusgraveSFOSDG29W160065.20
65Fran TarkentonMINOAK11L35205121323.7-4
66Babe ParilliNYJBAL3W10000-0.4-5
67Zeke BratkowskiGNBKAN1W1000-1-0.8-5
68Jay SchroederWASDEN22W1000-1-0.6-6
69Pete BeathardKANGNB1L5170071.3-6
70Tony BanksBALNYG35W1000-1-0.7-6
71Eli ManningNYGNWE42W34255211824.9-8
72Bob GrieseMIAWAS7W118811443.4-8
73Peyton ManningINDCHI41W38247111844.7-10
74John ElwayDENGNB32W2212301984.3-12
75Don StrockMIAWAS17L3000-3-0.9-17
76Steve FullerCHINWE20W4000-3-0.6-23
77Ron JaworskiPHIOAK15L38291131463.8-28
78Joe TheismannWASMIA17W2314322742.8-33
79Dan MarinoMIASFO19L50318122194.1-33
80Elvis GrbacSFOSDG29W1000-30-28.2-36
81Johnny UnitasBALNYJ3L2411001652.7-37
82David WoodleyMIAWAS17L149711281.9-37
83Donovan McNabbPHINWE39L51357332494.5-40
84Norris WeeseDENDAL12L102200-18-1.6-42
85Gale GilbertSDGSFO29L63001-17-2.7-44
86Gary CuozzoMINKAN4L31601-32-9.6-46
87Johnny UnitasBALDAL5W98812-12-1.3-47
88Tom BradyNWENYG42L48266102194.1-53
89Bob GrieseMIADAL6L2313401301.3-58
90Boomer EsiasonCINSFO23L2514401782.6-65
91Jim KellyBUFDAL28L50260011823.4-66
92Stan HumphriesSDGSFO29L49275121893.7-67
93Ben RoethlisbergerPITSEA40W2112302452-67
94Tony EasonNWECHI20L6000-40-5.6-72
95Roger StaubachDALPIT10L2420423371.2-78
96Chris ChandlerATLDEN33L3521913912.5-79
97Joe KappMINKAN4L2518302391.4-81
98John ElwayDENWAS22L3825713932.2-90
99Rex GrossmanCHIIND41L2816512541.9-90
100Steve GroganNWECHI20L3017712561.6-105
101Jim KellyBUFDAL27L78202-72-9.3-107
102Joe TheismannWASRAI18L3524302731.8-112
103Craig MortonDALBAL5L2612713-2-0.1-112
104Fran TarkentonMINPIT9L2610203-33-1.3-127
105Earl MorrallBALNYJ3L177103-64-3.8-136
106Frank ReichBUFDAL27L3119412160.5-137
107Neil O'DonnellPITDAL30L49239131222.3-147
108Billy KilmerWASMIA7L2810403-48-1.6-159
109Drew BledsoeNWEGNB31L4825324741.4-178
110John ElwayDENSFO24L2610802-22-0.7-182
111Rich GannonOAKTAM37L4427225350.7-212
112Craig MortonDENDAL12L153904-157-9-214
113Jim KellyBUFWAS26L5827524300.5-269
114Kerry CollinsNYGBAL35L3911204-124-2.9-335

If you type Montana’s name into the search box, you can see that he has the 1st, 4th, 11th and 27th best performance in Super Bowl history. The best performance in a losing effort goes to Jake Delhomme, who shredded the Patriots secondary in the second half of Super Bowl XXXVIII (he began the game 1 for 9 for 1 yard). The worst performance in a winning effort, unsurprisingly, goes to Ben Roethlisberger in Super Bowl XL, although Joe Theismann against the Dolphins gets an honorable mention. Worst performance overall goes to Kerry Collins, although Craig Morton’s 4 interceptions and 39 yards on 15 attempts against his former team in Super Bowl XII could give Collins a run for his money.

What about best championship game performances in the pre-Super Bowl era?

RkQBTmOppYearW/LAttPydTDINTCYCYPVAL
1Tobin RoteDETCLE1957W192804038019304
2Sid LuckmanCHIWAS1943W262865038614.8248
3Otto GrahamCLERAM1950W33298412927.7236
4Sammy BaughWASCHI1937W33335313209.7228
5Harry NewmanNYGCHI1933L192092120410.7197
6Charlie ConerlyNYGCHI1956W101952023222.1192
7Bart StarrGNBNYG1961W171643022413.2152
8Otto GrahamCLEDET1954W121633219312.9135
9Frank RyanCLEBAL1964W182063121211.2132
10Norm Van BrocklinRAMCLE1951W61281014824.7129
11Tobin RoteSDGBOS1963W151732022613.1127
12Sid LuckmanCHINYG1941W121600016013.3125
13George BlandaHOULAC1960W313013036111.6123
14Charlie ConerlyNYGBAL1958W141871019011.6122
15Arnie HerberGNBNYG1938L141231014310.2117
16Johnny UnitasBALNYG1959W29264202677.4115
17Charlie O'RourkeCHIWAS1942L71280012818.3105

[continue reading…]

References

References
1 Note that I do not have individual playoff sack data prior to 2008, so I am using pro-rated sack numbers based on team sack data.
{ 8 comments }

Yesterday, I explained the methodology behind the formula involved in ranking every quarterback season in football history. Today, I’m going to present the career results. Converting season value to career value isn’t as simple as it might seem. Generally, we don’t want a player who was very good for 12 years to rank ahead of a quarterback who was elite for ten. Additionally, we don’t want to give significant penalties to players who struggled as rookies or hung around too long; we’re mostly concerned with the peak value of the player.

What I’ve historically done — and done here — is to give each quarterback 100% of his value or score from his best season, 95% of his score in his second best season, 90% of his score in his third best season, and so on. This rewards quarterbacks who played really well for a long time and doesn’t kill players with really poor rookie years or seasons late in their career. It also helps to prevent the quarterbacks who were compilers from dominating the top of the list. The table below shows the top 150 regular season QBs in NFL history using that formula, along with the first and last years of their careers, their number of career attempts (including sacks and rushing touchdowns), and their career records and winning percentages (each since 1950). For visibility reasons, I’ve shown the top 30 quarterbacks below, but you can change that number in the filter or click on the right arrow to see the remaining quarterbacks.
[continue reading…]

{ 21 comments }

In 2006, I took a stab at ranking every quarterback in NFL history. Two years later, I acquired more data and made enough improvements to merit publishing an updated and more accurate list of the best quarterbacks the league has ever seen. In 2009, I tweaked the formula again, and published a set of career rankings, along with a set of strength of schedule, era and weather adjustments, and finally career rankings which include those adjustments and playoff performances.

If nothing else, that was three years ago, so the series was due for an update. I’ve also acquired more data, enabling me to tweak the formula to better reflect player performance. But let’s start today with an explanation of the methodology I’m using. To rank a group of players, you need to decide which metric you’re ordering the list by. I’ll get to all of the criteria I’m not using in a little bit, but the formula does use each of the following: pass attempts, passing touchdowns, passing yards, interceptions, sacks, sack yards lost, fumbles, fumbles recovered, rush attempts, rushing yards and rushing touchdowns. Most importantly, the formula is adjusted for era and league.

Two of the best quarterbacks ever.

So where do we begin? We start with plain old yards per attempt. I then incorporate sack data by removing sack yards from the numerator and adding sacks to the denominator [1]I have individual sack data for every quarterback since 1969. For seasons before then, I have team sack data going back to 1949. For seasons before 1950, I ignored sacks; for seasons between 1950 … Continue reading. To include touchdowns and pass attempts, I gave a quarterback 20 yards for each passing touchdown and subtracted 45 yards for each interception. This calculation — (Pass Yards + 20 * PTD – 45 * INT – Sack Yards Lost) / (Sacks + Pass Attempts) forms the basis for Adjusted Net Yards per Attempt, one of the key metrics I use to evaluate quarterbacks.

For purposes of this study, I did some further tweaking. I’m including rushing touchdowns, because our goal is to measure quarterbacks as players. There’s no reason to separate rushing and passing touchdowns from a value standpoint, so all passing and rushing touchdowns are worth 20 yards and are calculated in the numerator of Adjusted Net Yards per Attempt. To be consistent, I also include rushing touchdowns in the denominator of the equation. This won’t change anything for most quarterbacks, but feels right to me. A touchdown is a touchdown.
[continue reading…]

References

References
1 I have individual sack data for every quarterback since 1969. For seasons before then, I have team sack data going back to 1949. For seasons before 1950, I ignored sacks; for seasons between 1950 and 1969, I gave each quarterback an approximate number of sacks, giving him the pro-rated portion of sacks allowed by the percentage of pass attempts he threw for the team. While imperfect, I thought this “fix” to be better than to ignore the data completely, especially for years where one quarterback was responsible for the vast majority of his team’s pass attempts.
{ 13 comments }
Previous Posts