≡ Menu

There are lots of bad things one could write about the NFC South. But for the most part, the Atlanta Falcons had been a competitive team this year, and not just by NFC South standards. Entering week 17, Atlanta had posted an average Game Script of +0.7; sure, that’s not very good, but it’s above average! The Falcons had not been embarrassing, and in fact, had outscored opponents by 40 points through three quarters.

Sure, Atlanta had issues maintaining leads in the fourth quarter, but they were rarely soundly beaten from start to finish. The Falcons had (prior to Sunday) four bad Game Scripts this year. Three of them came on the road: -12.8 in Baltimore, -10.6 in Green Bay, and -8.5 in Cincinnati, and all three of those teams are notable for being much stronger at home in recent years. The fourth was a -8 against the Steelers, but even then, Atlanta had the ball down by just seven with 6 minutes remaining.

Then, week 17 came. The Panthers led by 10-0 after the first quarter, the largest deficit Atlanta faced after one quarter all year. Carolina upped that margin to 21 points at halftime, the second largest halftime lead an opponent had against the Falcons this year (Green Bay was up by 24 points). The 31-point margin after three quarters was easily the largest margin, too. It was a start-to-finish beating by the Panthers, who posted a Game Script of 16.4 in the process.

That was the second largest Game Script for Carolina this year, and by quite a large margin. Other than another December blowout over a division rival (New Orleans), the Panthers didn’t have a Game Script of over +7. But are the Panthers peaking at the right time, or just beating up on NFC South opponents? Tune in next week: actually, never mind. The Cardinals are an NFC West team in name only; with Ryan Lindley under center, Arizona is actually the fifth member of the NFC South. [continue reading…]

{ 1 comment }

New York Times, Post Week-17: Reviewing the Surprises

This week at the New York Times, a look at the bigger over- and under-achievers with respect to the pre-season Vegas lines:

Every year, Las Vegas sets forth a projected number of wins for each N.F.L. team. Most years, the majority of teams finish within a couple of games of that projection; this year, 20 of the league’s 32 teams finished within two wins of their projected wins total from before the season. But every year, there are also a few outliers; today, a review of the two biggest overachievers and two largest underachievers of the 2014 season.

Dallas Cowboys (Projected wins: 8. Actual: 12.)

Projecting an eight-win season for the Cowboys seemed like a safe bet: Dallas finished with an 8-8 record in 2011, 2012 and 2013, and there was little reason for optimism in 2014. The defense allowed the most yards in the N.F.L. in 2013, then lost three of its best players: DeMarcus Ware moved on to the Broncos, Jason Hatcher signed with the Redskins, and Sean Lee tore an anterior cruciate ligament in May. The expectation was that the offense would be good, but that the defense could be one of the worst in history.

But the defensive coordinator Rod Marinelli turned a unit short on talent into a respectable on-field product. Marinelli got the most out of linemen like Jeremy Mincey, Tyrone Crawford and Henry Melton. Inside linebacker Rolando McClain isn’t just a candidate for comeback player of the year: His production was one of the more shocking developments of the season. A former draft bust, McClain officially retired in May 2013. More than a year later, the Cowboys traded a sixth-round pick to Baltimore for McClain and a seventh-round pick. But he was the Cowboys’ most dependable linebacker in 2014 and finished as a top 10 inside linebacker, according to Pro Football Focus.

You can read the full article here.

{ 1 comment }

Quick Reactions From Week 17 of the 2014 season

Some quick thoughts on all the week 17 action.

Baltimore 20, Cleveland 10

The Ravens ranked 5th in DVOA entering week 17, so it sure felt like Baltimore was a worthy playoff team. But Baltimore looked horrible in week 16 against Houston and then trailed 10-3 entering the third quarter against a Browns team starting Connor Shaw at quarterback.

How good are the Ravens? Baltimore swept the NFC South, and beat the Titans and Jaguars. The four other Ravens wins: a split with the Steelers, a sweep of the Browns, and an impressive-at-the-time win over Miami. That means the Ravens finished the year with just one win teams with a winning record. The losses were all to good teams: Pittsburgh, a sweep by the Bengals, the Colts, the Texans, and the Chargers. So the 2014 Ravens went 1-6 against teams with winning records, and 9-0 against the rest of the NFL.

Given what happened with Joe Flacco and the team in 2012, I don’t think anyone is going to brand Baltimore as a team that can’t beat good teams. But you can be sure that if, say, the Bengals had this split, that narrative would dominate the headlines. On the other hand, the Ravens are one of just six teams to finish 2014 with a +100 points differential. The silver living here is that the Ravens didn’t just beat bad teams, but that Baltimore tended to do so convincingly. [continue reading…]

{ 16 comments }

Rex Ryan Fired

This article should have been written two years ago. At the latest, it should have been written last year. Technically, we’re still a few hours away from the title of this article being accurate and/or breaking news, but there’s no drama left in New York. Ryan is going to be fired as the Jets head coach.

The Jets went “all in” from 2009 to 2011 in the hopes of winning a Super Bowl. New York got very, very close, reaching consecutive AFC Championship Games in 2009 and 2010. After the 2008 season, the Jets had a talented roster but were in need of a new head coach and a new quarterback. Then general manager Mike Tannenbaum tabbed Rex Ryan as that man. Ryan retained offensive coordinator Brian Schottenheimer, and then New York traded up to acquire Mark Sanchez.

At that point, the fates of Tannenbaum, Ryan, Schottenheimer, and Sanchez were aligned. Other than the owner, the general manager, head coach, offensive coordinator [1]Particularly when the head coach has a defensive background., and the quarterback may be the four most important men in any football organization. Together, the quartet began a new era of Jets football. And it was very successful… for two seasons.

The 2011 season was very disappointing, with a cherry on top being a disaster of a finale in Miami. The Jets then decided to move on from Schottenheimer, which made sense: things roll downhill in all walks of life, and the NFL is no different. Sure, Sanchez had turned into a bust, and maybe Ryan had lost control of the team, and perhaps Tannenbaum’s drafting had taken a turn for the worse, but maybe, just maybe, the team’s troubles were all the fault of the offensive coordinator! As a first step, keeping the nucleus intact but with a new coordinator made sense: it was the path of least change.

Unfortunately, Schottenheimer’s replacement turned out to be Tony Sparano, so you can imagine how that ended. After the 2012 season, the Jets fired Tannenbaum, and Sparano, and the majority of the defensive coaches moved on, too. ((DC Mike Pettine went to Buffalo,while Ass. HC/LB coach Bob Sutton, Ass. DB coach Jim O’Neil, OLB coach Mike Smith, and Ass. DL coach Anthony Weaver all left, too.) Sanchez was only retained because of his enormous cap figure, but he had also played his last regular season game for the Jets. At that point, firing Rex made a lot of sense. [continue reading…]

References

References
1 Particularly when the head coach has a defensive background.
{ 2 comments }

A massively disappointing quarterback and Josh  McCown

A massively disappointing quarterback and Josh McCown

Passer rating is a stupid stat. But my interest in trivia trumps my disdain for passer rating, so let’s move on.

Josh McCown had a passer rating of 109.0 last year, the third best in the NFL in 2013. With one game left in the 2014 season, McCown has a passer rating of 70.5, and he is in a tight three-way race with Geno Smith and Blake Bortles to see who finishes the season with the worst passer rating. Update: McCown had a passer rating of 70.0 in week 17, and finished the year with a 70.5 passer rating. A decline of 38.5 points in a quarterback’s passer rating is enormous, but not unprecedented. In fact, eight other players (minimum 200 pass attempts both years) have seen larger declines:

#8) Daunte Culpepper (2004-2005)

In 2004, Culpepper set an NFL record with 5,123 yards of total offense.  I wrote about Culpepper’s great ’04 season and his subsequent decline at the PFR blog back in 2007, and I maintain that Culpepper was a very underrated quarterback during his time in Minnesota.  In 2004, he finished with a passer rating of 110.9; the next year, his final with the Vikings, he threw 6 touchdowns against 12 interceptions in seven games, before an ACL year ended his season.  He finished with a 72.0 passer rating, representing a 38.9 point drop from his lofty ’04 standard. [continue reading…]

{ 6 comments }

With their season on the line, the San Diego Chargers chose to dig deeper. Into a hole, that is.  On Saturday night, the 49ers jumped out to a 21-0 lead just 20 minutes into the game, and San Francisco took a 28-7 record into halftime. Even with six minutes left, San Diego still trailed by two touchdowns.

Down to their final drive, the Chargers needed to convert a 4th-and-8 (on a 17-yard pass to Eddie Royal) and a 4th-and-10 (to Dontrelle Inman), just to set up an 11-yard touchdown from Philip Rivers to Malcom Floyd with 32 seconds remaining.

Through 60 minutes, the Chargers had a Game Script of -11.3, which would tie the Lions/Falcons game for the most negative Game Script by a winning team all season. Because the game went to overtime, that Game Script number ended at -10.5, but that’s still easily the biggest comeback since the Detroit/Atlanta contest.

The other notable comeback of week 16 was in Miami, where the Vikings and Dolphins staged a crazy affair that resulted in a whopping 41 fourth quarter point. But Minnesota jumped out to an early lead and led 17-7 at the break, so the Vikings ended up with a Game Script of +4.3.

On the other end of the spectrum, there was only one large blowout: the Cowboys dominated the Colts by a score of 42-7, producing a Game Script of +23.9 in the process. The table below shows the week 16 Game Scripts data: [continue reading…]

{ 2 comments }

Rushing Defense and the Lions, Ravens, and Steelers

Earlier this year, I noted that the Seahawks were operating at a historic level when it came to yards per carry differential. Seattle hasn’t slowed down since then: through 15 games, the team has rushed 491 times for 2,630 yards, a 5.36 YPC average. Defensively, the Seahawks have allowed just 1,262 yards on 362 carries, which translates to an anemic 3.49 YPC average. As a result, the team is averaging 1.87 more yards per carry than its opponents, which would place them second since 1950 behind the 2007 Vikings.

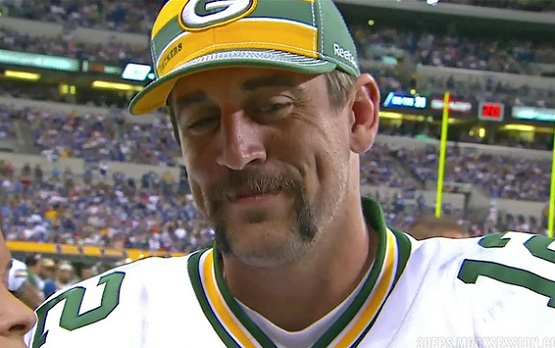
Over the last 30 NFL seasons, just one team has rushed for 2800 yards: the 2006 Atlanta Falcons, in the year where Michael Vick rushed for over 1,000 yards. Seattle has a good chance of being the second such team, thanks in no small part to Russell Wilson and his 842 rushing yards. Seattle’s rushing offense has been absurdly dominant this year, but that’s fodder for another day. Today I want to look at rush defense, and there’s another NFL team having a dominant season in that regard.

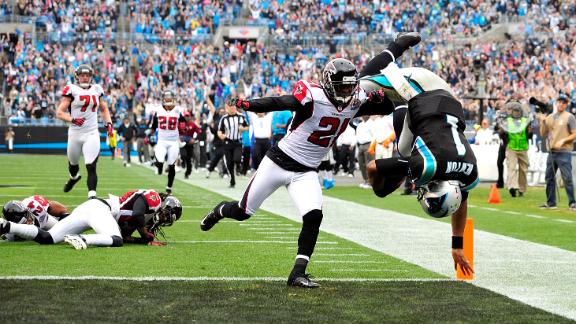
The Detroit Lions haven’t allowed a 100-yard rusher this year. Through 15 games, 31 NFL teams have allowed at least 1200 rushing yards, while Detroit has given up just 957 yards on the ground. That’s only 63.8 rushing yards per game, which would rank 4th among all teams since 1950, behind only the 2000 Ravens, 2006 Vikings, and 2010 Steelers. Detroit would need to allow just 46 yards against the Packers to pass the Steelers for 3rd place, 27 yards to pass the Vikings for 2nd, or 12 yards to pass the Ravens for first place. Okay, that probably won’t happen, but Detroit has been outstanding against the run this year. The Lions have been even better in the second half of the season against the run, allowing just 52.1 yards per game on the ground over the team’s last seven games.

And here’s a bit of good news for NFL fans: we could be heading towards a tremendous showdown or two in the postseason.  Assuming the Packers beat the Lions on Sunday, Detroit will fall to the sixth seed in the NFC, which would likely mean a trip to Dallas — and NFL leading rusher DeMarco Murray — in the first round. And if the Lions win that game, the second round would have them headed to Seattle to face the Seahawks unstoppable rushing attack, if Seattle beats the Rams in week 17.

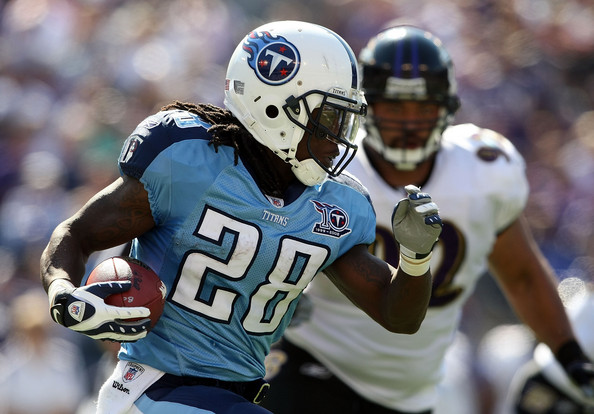
Detroit is one of just two teams this year that has not allowed a 100-yard rusher; the other is Baltimore, and the Ravens have not allowed a 100-yard rusher in 25 games, dating back to week six of the 2013 season (when Eddie Lacy rushed for 120 yards). That makes the Ravens just the 34th team since 1960 to go 25 games without allowing a 100-yard rusher; of course, for Baltimore, they need to extend the streak into the 2016 season to break the franchise record of 46 straight games.

It feels as though the Ravens have had a great run defense for the team’s entire history, courtesy of Ray Lewis and a host of talented rush defenders. As it turns out, Baltimore has allowed just 44 100-yard games since entering the league in 1996, but that’s only the second best mark. Over that same time period, the Steelers have allowed just 36 100-yard rushing games.

Baltimore’s run defense was nothing special in the early days of the franchise, while the mid-’90s Steelers run defense was dominant. If we look back just to 1999, the Steelers have allowed 33 100-yard rushers, while the Ravens have allowed only 32. Then again, change the cut-off to 2000, and Pittsburgh drops to 28, with Baltimore staying at 32.

Undoubtedly the most impressive part of the streak from either franchise belongs to Pittsburgh. From 2004 to 2010, the Steelers allowed just five 100 yard rushers. That’s mind-boggling. Among all teams since 1978, the only team other than Pittsburgh to allow fewer than ten 100-yard rushers over any seven-year period was the ’82 to ’88 Bears, who allowed nine.

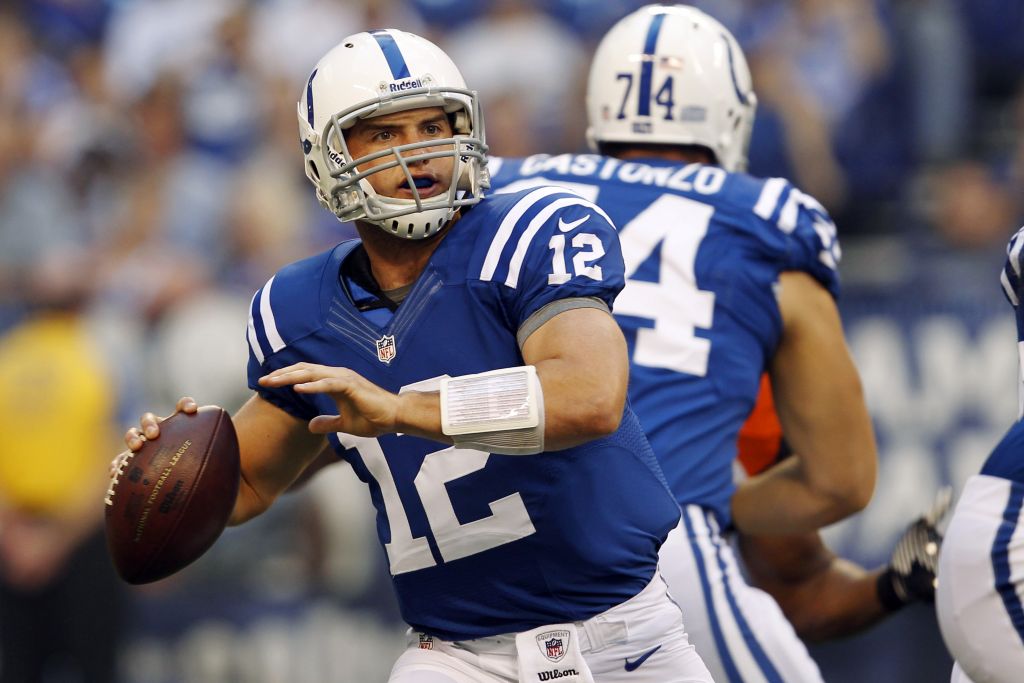
Rudi Johnson hit the century mark in week four of the 2004 season; over Pittsburgh’s next 53 games, only Edgerrin James (124 yards in a 26-7 Colts win in 2005) rushed for 100 yards against the Steelers. In 2007, Thomas Jones and Fred Taylor each did it in the second half of the year, and then that was it until Ray Rice in week 16 of the 2009 season.  No 100-yard rushers allowed in either the 2008 or 2010 season.

{ 2 comments }

Rookie Receivers and the 2014 Season

Odell Beckham is ridiculous. Period.

Mike Evans, in just about any other year, would be considered the best rookie wide receiver in the NFL. Players like Kelvin Benjamin and Sammy Watkins would stand out in most years, too: both have over 25% of their team’s receiving yards.

Jordan Matthews has 767 receiving yards, which is only considered unimpressive against when compared against the above backdrop. Ditto Jarvis Landry and his 79 receptions. Martavis Bryant has seven touchdowns. The Jaguars have three rookie receivers playing well. And on and on we could go (just as I did in late October, and as Bill Barnwell did after week twelve).

Through 16 weeks of the 2014 season, rookies have been responsible for 12.6% of all receptions in the NFL, 12.7% of all receiving yards, and 13.7% of all touchdowns. As it turns out, that does make the 2014 class a very special one. The table below shows the percentage of all receptions, receiving yards, and receiving touchdowns by rookies in each year (other than 1987) since 1970: [continue reading…]

{ 2 comments }

New York Times, Post Week-16 (2014): Projected Award Winners

This week at the New York Times — the players I expect to win the major NFL awards.

Most Valuable Player: Aaron Rodgers, Green Bay Packers

The Pittsburgh Steelers have a pair of strong candidates in Ben Roethlisberger and Le’Veon Bell, as do the Dallas Cowboys with Tony Romo and DeMarco Murray. There will be a faction who vote for J. J. Watt, who is having another monster year at defensive end. Indianapolis’ Andrew Luck (N.F.L. high 38 touchdown passes) or Tom Brady (New England has the best record in the league) could also wind up picking up some votes.

But the best player this year has been Aaron Rodgers. The Green Bay star leads the league in Adjusted Net Yards per Attempt, an advanced metric that incorporates several aspects of quarterback play. Rodgers ranks first in interception rate (1 percent), second in touchdown rate (7.2 percent), and third in net yards per pass attempt (7.57), an across-the-board level of dominance that cannot be matched. Green Bay leads all teams in points scored per drive, while the Packers have punted a league-low 48 times. The Packers offense is a ruthlessly efficient offensive machine, and Rodgers is the driving force behind the team’s success.

You can read the full article here.

{ 0 comments }

The NFC South is upside down

The NFC South is upside down.

The Atlanta Falcons began the season with a 2-6 record.  In the second half of the year, the team was 4-7 and then 5-9.  The Carolina Panthers began the year with a 3-8-1 record. One of these two teams will make the playoffs.

I’m not even sure what else there is to say.  The phrase “left for dead” is probably too kind.  Carolina fell to 3-8-1 in embarrassing fashion; the team’s 8th loss came in a game where the Vikings returned two blocked punts for touchdowns, and the Panthers body language read “checked the #*$! out.”

From October 6th to December 6th, the Carolina Panthers did not win a game.  Through week 13, the Panthers ranked 28th in points differential.  The Panthers may turn out to be the most unlikely playoff team in NFL history. [continue reading…]

{ 2 comments }

Alfred Morris and Production Through Three Years

The 2012 OROY and Washington's most productive player from the 2012 draft

The 2012 OROY and Washington’s most productive player from the 2012 draft

Alfred Morris was just a sixth round pick. During his rookie season, he happened to play alongside the eventual offensive rookie of the year. Since then, RG3 has continued to dominate headlines, while Morris continues to plug away without garnering a fraction of the attention. For example, did you know that Morris has now hit the 1,000-yard mark for the third straight season? He’s also rushed for 7 touchdowns each year in his career.

Do you know how many other players have rushed for 1,000 yards and seven scores in each of their first three seasons? Seven: Earl Campbell, Ottis Anderson, Eric Dickerson, Barry Sanders, LaDainian Tomlinson, Adrian Peterson, and Chris Johnson. That’s five Hall of Fame caliber running backs and Anderson/Johnson, a duo that has combined for nearly 19,000 rushing yards and still counting.

Morris has rushed for 3,919 yards and 27 touchdowns in his career, with one game left in his third season. In addition to the six of the seven players above (Anderson had 26 rushing touchdowns through three years), only five other players have hit those marks through three years: Clinton Portis, Terrell Davis, Emmitt Smith, Edgerrin James, and Walter Payton.

In other words, Morris’ production through three years puts him in in the inner circle of elite running back performance. Of the thirteen running backs mentioned in this post, ten were first round picks. The eleventh was Portis, a player who fell to the second round solely due to concerns about his size and durability. None of the other players were drafted in the second, third, fourth, or fifth rounds; the other two were Morris and Davis, both six round picks under Mike Shanahan. [continue reading…]

{ 3 comments }

Quarterback Passing Value and First Downs

Nine days ago, I looked at the leaders in passing value, measured as the difference between each quarterback’s ANY/A average and league average, multiplied by such passer’s number of dropbacks. This is the conventional method I have used to measure passing value, but that doesn’t make it the best.

Over the summer, Brian Burke of Advanced Football Analytics fame, helped me determine the value of first down. His research concluded that a first down was worth about 9 marginal yards. I was short on time, so I didn’t have the chance to incorporate that into my formula last week. But I will rectify that today.

In addition, I will provide -30 yards for each “net fumble” — defined as fumbles minus fumbles recovered. And since last week I calculated the numbers relative to average, this time around I will compare player production to replacement value, defined as 80% of league average. [1]Customarily, I use 75%, but I think with the first down bonus, 80% makes more sense here.

Let’s use Aaron Rodgers as an example. The Packers star has thrown 458 times for 3,837 yards, 35 touchdowns (+700), with 5 interceptions (-225), 9 fumbles, and 5 fumble recoveries (-120). He has also been sacked 27 times and lost 166 yards on those plays. Finally, Rodgers has picked up 188 first downs (+1692), which means he has a total of 5,718 adjusted net yards. Over his 485 dropbacks, that gives him an average of 11.79 “ANY/A”, while the league average is 8.91. That means Rodgers has produced 1,397 yards of value over average, and 2,261 yards of value over replacement. [continue reading…]

References

References
1 Customarily, I use 75%, but I think with the first down bonus, 80% makes more sense here.
{ 6 comments }

Records Against the Spread

The Titans lost to the Jaguars last night, dropping Tennessee’s record to a woeful 2-13. The 2014 season started off nicely for the Titans, who upset the Chiefs in Kansas City, 26-10, on opening day. Since then, not only has Tennessee gone just 1-13 (the sole win being a 2-point home victory against Jacksonville), but the team is a mind-bogglingly poor 2-11-1 against the spread.

Points spread data is not official, of course, and some sources of data are better than others. Using what is available at Pro-Football-Reference, I calculated the worst teams against the spread since 1978. If the Titans fail to cover next week against the Colts, they will end the year at 3-12-1 against the spread. That would make them one of just 13 teams since 1978 to post such a poor ATS record. On the other hand, it would only tie them with another AFC South team from the past two years:

TeamYearWLTwin%ATS WATS LATS TPerc
BAL200751100.31331300.188
NWE198121400.12531300.188
PIT19809700.56331300.188
CIN198741100.26731200.2
HOU201321400.12531210.219
STL201121400.12531210.219
NYG200341200.2531210.219
OAK200341200.2531210.219
DAL199761000.37531210.219
HOU199421400.12531210.219
BAL198121400.12531210.219
SFO197821400.12531210.219
HOU19821800.1112700.222
PHI201241200.2541200.25
TAM201141200.2541200.25
CAR201021400.12541200.25
JAX200851100.31341200.25
STL20027900.43841200.25
CIN200221400.12541200.25
ARI200031300.18841200.25
OAK199741200.2541200.25
CIN199131300.18841200.25
RAM199131300.18841200.25
NWE199011500.06341200.25
NYJ198941200.2541200.25
NOR198551100.31341200.25
ATL198441200.2541200.25
HOU198431300.18841200.25
DEN20088800.541110.281
PHI200561000.37541110.281
SFO200210600.62541110.281
NOR199931300.18841110.281
CIN199831300.18841110.281
NYJ199241200.2541110.281
DEN199051100.31341110.281
MIA198861000.37541110.281
DET197921400.12541110.281
CHI20138800.541020.313
WAS201331300.18851100.313
OAK201241200.2551100.313
KAN201221400.12551100.313
CLE201051100.31351100.313
ARI201051100.31351100.313
DEN201041200.2551100.313
JAX20097900.43851100.313
DET200921400.12541020.313
DEN20077900.43851100.313
STL200731300.18851100.313
DEN20069700.56351100.313
STL200561000.37551100.313
NOR200531300.18851100.313
SEA20049700.56351100.313
TEN200451100.31351100.313
CHI200241200.2551100.313
CLE200031300.18851100.313
MIN199910600.62541020.313
SFO199941200.2551100.313
DET199851100.31351100.313
STL199841200.2551100.313
DET199651100.31351100.313
DEN19947900.43841020.313
PHI19947900.43851100.313
RAM199351100.31351100.313
IND199341200.2551100.313
NYG199261000.37551100.313
CHI199251100.31351100.313
NYG19918800.551100.313
IND199111500.06351100.313
CHI198961000.37551100.313
WAS19887900.43851100.313
STL198551100.31351100.313
MIN198431300.18851100.313
GNB19838800.541020.313
SDG198361000.37551100.313
NYG198331210.21951100.313
NYJ198041200.2551100.313
DAL197911500.68851100.313

The 2007 Ravens went 5-11 overall and 3-13 against the spread, making them the worst team in recent history when it comes to covering the point spread. That year marked the end of the Brian Billick, Steve McNair, and Kyle Boller eras in Baltimore. And while first-year head coach Ken Whisenhunt is probably safe, Titans fans can rest easy knowing that the Jake Locker era is almost certainly over. As for Zach Mettenberger and Charlie Whitehurst? The door may be about to close on them as well. After losing to the Jets and Jaguars, Tennessee looks to be in great shape once the music stops to land Marcus Mariota or Jameis Winston.

{ 5 comments }

Week Fifteen Game Scripts: Bengals Dominate Manziel

Entering week 15, one of the biggest storylines was that Johnny Manziel was set to make his first start of the season. Manziel’s opening performance was a flop: his -0.56 Adjusted Yards per Attempt average was the second lowest by a quarterback this season, although not the lowest by a quarterback in a Browns/Bengals game. The Bengals won 30-0 in a game that was never in doubt for much of the second half; Cincinnati’s +16.6 Game Script was the highest of the week.

The Patriots, Chiefs, and Saints all posted double digit Game Script scores as well. In the process, New England clinched the AFC East, Kansas City kept their playoff hopes alive and avenged an uglier loss to Oakland, and the Saints? Well, New Orleans still controls its own destiny for the playoffs despite a 6-8 record.

The comebacks were light this week, as only Detroit (-3.3) and the Jets (-1.5) managed to win with a negative Game Script. The table below shows the Game Scripts data from week 15: [continue reading…]

{ 1 comment }

Nuke

Would you believe this guy is good at catching footballs?

Houston Texans wide receiver DeAndre Hopkins is having a fine year. While his 69 receptions is tied for only 24th in this era where catching passes is easier than ever, he’s averaging an impressive 16.9 yards per reception. No player with more than 50 receptions has a higher yards per catch average, which is why Hopkins ranks 9th in receiving yards despite ranking 24th in receptions.

But 9th is still just 9th, which is a long cry from 1st. But consider that the Texans are just 31st in pass attempts this year: in that light, ranking 9th looks a lot more impressive. And then consider the state of the Houston quarterback play. The Texans actually rank above average in yards per attempt, but there’s a reason that statistic is misleading: that reason is DeAndre Hopkins.

Houston passers (Ryan Fitzpatrick, mostly, with some Ryan Mallett and Tom Savage cameos) are averaging 7.4 yards per attempt, but that is the result of a 10.7 Y/A average on passes to Hopkins and 6.2 yards per attempt on all other passes.

So start with a player who ranks 9th in receiving yards, adjust for the fact that he’s on the team with the second fewest passes in football, and then consider that his quarterbacks are terrible on passes to everyone else on his team. That’s how you end up with Hopkins being responsible for a league-high 38.6 percent of his team’s receiving yards. [continue reading…]

{ 6 comments }

New York Times, Post Week-15 (2014): AFC Parity

This week at the New York Times: AFC and its (lack of) parity:

The New England Patriots and the Denver Broncos have the two best records in the A.F.C. The Indianapolis Colts are the class of the A.F.C. South, at 10-4, but no other team in that division has a winning record. The Cincinnati Bengals are first in the North, while the Pittsburgh Steelers and the Baltimore Ravens, longtime division heavyweights, are tied for second.

The San Diego Chargers and the Kansas City Chiefs cannot challenge the Broncos in the West, but both teams have winning records. The Miami Dolphins, despite some early optimism, have fallen to .500. On the other side of the spectrum, the Jacksonville Jaguars and the Oakland Raiders are both again in line for a top-five pick. The Jets have scored the third fewest points among teams in the conference, and quarterback Geno Smith has the lowest passer rating in the N.F.L.

This is an accurate snapshot of how the A.F.C. looks with only two weeks left in the 2014 regular season. It also describes the conference at the conclusion of the 2013 regular season. Despite the perception that parity exists to a greater degree in the N.F.L. than in other major professional sports, that has not been the case over the last several years in the A.F.C.

You can read the full article here.

{ 4 comments }

College Football Season Recap

The college football regular season is over. You can view the SRS ratings for each team here, and the single-game SRS ratings from each game involving an FBS team here. That list is sorted by the best single-game performances of the year, and Ohio State’s 59-0 thrashing of Wisconsin in the Big 10 Championship Game takes the top prize there. But today I thought it would be fun to go back and look at some of the most unusual performances of the year.

Biggest Upset: Northwestern State 30, Lousiana Tech 27

Northwestern State is an FCS school with a rating of just 23.7. Louisiana Tech is actually pretty good, finishing 8-5 and 37th in the SRS with a rating of 43.4. Given that the game was in Louisiana, we would put Northwestern State as 23-point underdogs, but on September 20th, they pulled the shocking upset. Although it was not the most noteworthy upset of the day, because….

Biggest Upset involving a Power 5 school: Indiana 31, Missouri 27

Missouri won the SEC East, although the Tigers were not a great team, finishing with a 48.9 SRS rating. Of course, Indiana is kind of terrible: the Hoosiers began the year 0-7 in Big Ten play before edging by Purdue in the season finale. Given that the game was in Columbia and that Indiana finished with a 31.4 SRS rating, Missouri should have won by 20.4 points. Instead, Indiana pulled the shocking upset, and gave SEC haters something to crow about.

The table below shows the 25 biggest upsets of the year: the Virginia Tech/Ohio State game slides into the top five, as does this year’s Bedlam game, which flew a bit under the radar given what else was going on in college football last week. For each team, I’ve listed their SRS rating and their opponent’s SRS rating, along with the difference between the two teams’ ratings after taking into account home field.

[continue reading…]

{ 2 comments }

2014 College Bowl Preview

The Army/Navy game concluded our college football regular season. As a result, it’s now Bowl season for the Football Bowl Subdivision. The table below shows all 38 games, along with each team’s SRS ratings, the average of the two teams’ ratings, and the difference between the two ratings.

DateFavoriteSRSUnderdogSRSBowlLocationAvgDiff
12-20-14Utah45.3Colorado St41.1Royal Purple Las Vegas BowlLas Vegas NV43.24.1
12-20-14Utah St37.8UTEP29.6Gildan New Mexico BowlAlbuquerque NM33.78.2
12-20-14Western Michigan34Air Force32.8Famous Idaho Potato BowlBoise ID33.41.2
12-20-14Nevada34.2Louisiana-Lafayette30.2R+L Carriers New Orleans BowlNew Orleans LA32.24
12-20-14South Alabama25.9Bowling Green23.9Raycom Media Camellia BowlMontgomery AL24.92
12-22-14Memphis41.6Brigham Young38.2Miami Beach BowlMiami FL39.93.4
12-23-14Marshall46.3Northern Illinois34Boca Raton BowlBoca Raton FL40.112.3
12-23-14Navy34.6San Diego St32.1San Diego County Credit Union Poinsettia BowlSan Diego CA33.42.4
12-24-14Western Kentucky35.5Central Michigan30.2Popeyes Bahamas BowlNassau BA32.85.2
12-24-14Rice30.6Fresno St29.8Hawaii BowlHonolulu HI30.20.8
12-26-14Louisiana Tech43.4Illinois33.7Zaxby`s Heart of Dallas BowlDallas TX38.59.8
12-26-14North Carolina St37.8Central Florida36.8Bitcoin St. Petersburg BowlSt. Petersburg FL37.31
12-26-14North Carolina37Rutgers34.2Quick Lane BowlDetroit MI35.62.8
12-27-14Southern Cal51.3Nebraska47.7National University Holiday BowlSan Diego CA49.53.6
12-27-14Arizona St47.5Duke42.4Hyundai Sun BowlEl Paso TX455.2
12-27-14Miami FL44.1South Carolina41.6Duck Commander Independence BowlShreveport LA42.82.5
12-27-14Virginia Tech41.8Cincinnati39Military BowlAnnapolis MD40.42.9
12-27-14Boston College42.5Penn State37.3New Era Pinstripe BowlBronx NY39.95.2
12-29-14Oklahoma52.8Clemson47.1Russell Athletic Florida Citrus BowlOrlando FL49.95.7
12-29-14Texas A&M47.6West Virginia47.2AutoZone Liberty BowlMemphis TN47.40.4
12-29-14Arkansas52.2Texas41.9Advocare V100 Texas BowlHouston TX4710.3
12-30-14Georgia56.9Louisville47.1Belk BowlCharlotte NC529.9
12-30-14LSU52.3Notre Dame42.9Franklin American Mortgage Music City BowlNashville TN47.69.4
12-30-14Stanford48.3Maryland39.9Foster Farms BowlSanta Clara CA44.18.4
12-31-14TCU60.5Mississippi58Chick-fil-A Peach BowlAtlanta GA59.32.5
12-31-14Mississippi St55.5Georgia Tech50.7Capital One Orange BowlMiami Gardens FL53.14.8
12-31-14Arizona48.6Boise St44.8VIZIO Fiesta BowlGlendale AZ46.73.8
01-01-15Alabama61.6Ohio State57.6Allstate Sugar BowlNew Orleans LA59.64.1
01-01-15Baylor57.4Michigan St56.1Goodyear Cotton Bowl ClassicArlington TX56.81.3
01-01-15Oregon61Florida St51.6Rose Bowl Presented by Northwestern MutualPasadena CA56.39.4
01-01-15Auburn55.9Wisconsin49.7Outback BowlTampa FL52.86.3
01-01-15Missouri48.9Minnesota44Buffalo Wild Wings Citrus BowlOrlando FL46.54.8
01-02-15Kansas St53.7UCLA50.3Valero Alamo BowlSan Antonio TX523.4
01-02-15Tennessee47Iowa41TaxSlayer BowlJacksonville FL446.1
01-02-15Washington44.2Oklahoma St37.8TicketCity Cactus BowlTempe AZ416.4
01-02-15Pittsburgh40Houston33.1Lockheed Martin Armed Forces BowlFort Worth TX36.57
01-03-15Florida47.4East Carolina38Birmingham BowlBirmingham AL42.79.4
01-04-15Arkansas St34.1Toledo33.8GoDaddy BowlMobile AL340.4

Best Bowls

The Sugar Bowl, featuring Alabama and Ohio State, checks in as the best game of Bowl season, as measured by the average ratings of the two teams. The Crimson Tide have the best SRS rating, while Ohio State has the 5th highest rating.

The other playoff matchup comes in the Rose Bowl, but Florida State’s poor rating actually drops them game to #4 behind the Peach Bowl (TCU/Ole Miss) and even the Cotton Bowl Classic (Baylor/Michigan State).

The worst game? That’s South Alabama and Bowling Green in the new Camelia Bowl. Yes, the inaugural game of a new Alabama Bowl game featuring two six-loss teams will kick off at 9:20 on the opening night of Bowl season. Make sure you have your schedule cleared for that one.

Biggest Mismatches

Marshall and Northern Illinois face off in a game that, on the surface, appears to be a very good one. Marshall is 12-1 and a legitimately good team. On the other hand, while Northern Illinois is 11-2, a bunch of close wins against MAC teams doesn’t make UNI a good team. The Huskies lost by 38 against Arkansas and by 17 at home against a bad Central Michigan team. Northern Illinois is 12.3 points worse than Marshall in the SRS, which makes traveling to Boca Raton even more depressing.

Arkansas/Texas, Georgia/Louisville, and Louisiana Tech/Illinois are all 10-point mismatches, too. Of course, Bowl season has a habit of deviating from the regular season script, so don’t blame me when all the underdogs win. According to Vegas, the Foster Farms Bowl at Levi’s Stadium in Santa Clara is the most lopsided matchup. One reason for that: Stanford is the de facto host here, and the Cardinal are 14 point favorites against Maryland. [continue reading…]

{ 2 comments }

The Worst Matchups in NFL History

Johnson returns to Nashville

Johnson returns to Nashville

The Jets and the Titans play tomorrow, in a matchup of 2-11 teams that ranks as one of the worst in NFL history. If you’re watching this game, you’re either a diehard fan of both teams or are fascinated by the idea of a Chris Johnson revenge game (which is probably even sadder than being a fan of either team). It’s even worse than the Colts-Jaguars game of a few years ago, when the 2-13 Colts needed a loss in Jacksonville to the 4-11 Jags in order to secure the rights to Andrew Luck. Something similar could be on the line in Tennessee: with the Jets, Bucs, and Titans all 2-11 (not to mention the Jaguars and Raiders), there are three quarterback-needy teams in a draft with two marquee quarterbacks: Jameis Winston and Marcus Mariota. As a result, the loser of the New York/Tennessee game could ultimately be the long-term winner.

This will be the first matchup of 2-11 teams since a 2008 game between the Rams and Seahawks. That game turned out to be much less exciting for draftniks with the benefit of hindsight: St. Louis selected Jason Smith with the second overall pick, while the Seahawks drafted Aaron Curry fourth overall.

So what’s the worst matchup of teams in NFL history? You can’t use just winning percentage, and it’s hard to compare teams who have played a different number of games. One solution is to add 11 games of .500 ball to each team. For the Jets and Titans, that would make both teams 7.5-16.5, which translates to an adjusted winning percentage of 0.313. That would be tied for the 19th worst game in NFL history.

The worst? There’s a tie there, too, involving a pair of Colts teams a decade apart. In 1981, the 1-14 Colts defeated the 2-13 Patriots. Baltimore had an adjusted (after adding 11 games of .500 play) winning percentage of 0.250, while New England was at 0.288, for an average of 0.269. The win swung the first overall pick to the Patriots and dropped the Colts to second overall, although Kenneth Sims and Johnie Cooks didn’t change the fate of either franchise. Ten years later, the Colts were again 1-14 and were scheduled to play the 2-13 Bucs. The twist here: Tampa Bay had already traded the team’s first round pick in 1992 to Indianapolis in exchange for Chris Chandler in 1990. The Bucs defeated the Colts, and Indianapolis selected Steve Emtman and Quentin Coryatt with the first two picks. Spoiler alert: that didn’t change the fate of the franchise, either. [continue reading…]

{ 3 comments }

The Arizona Cardinals and Pythagenpat Records

The secret to Arizona's success

The secret to Arizona’s success

At 8-1 — but with just a 0.668 Pythagenpat winning percentage — I wrote about the good fortune of the Arizona Cardinals. Fortune is relative: the Cardinals have lost both Carson Palmer and Drew Stanton to injuries, and just about every key contributor you can think of along the way. But the team’s good fortune when it comes to Pythagenpat winning percentage has continued. (For the uninitiated, you can read more about how to calculate Pythagenpat records here.)

Since that article, Arizona has gone 3-2 despite being outscored by 10 points. That is both a fact and doubles as the most 2014 Arizona Cardinals sentence you could ever write. The 11-3 Cardinals are definitely not the worst 11-3 team ever, but they aren’t too far from the top of the list. If we look at all teams with at least 11 wins in their first 14 games, Arizona checks in as the 8th biggest overachiever. Given that the 2004 Falcons had a worst points differential *and* were fortunate to face an easy schedule, Arizona can’t match Atlanta when it comes to worst 11-3 teams. [continue reading…]

{ 4 comments }

Number one in our hearts

Number one in our hearts

Aaron Rodgers has thrown for 3,652 yards and 35 touchdowns on his 416 pass attempts this year. He has throw just three interceptions, although he has taken 26 sacks for 156 yards. Do the math, and Rodgers is averaging 9.19 Adjusted Net Yards per Attempt this year. Through 14 weeks, the NFL average is 6.24 ANY/A, which means Rodgers is averaging 2.95 ANY/A better than average. Over the course of his 442 dropbacks, this means Rodgers has produced 1,303 yards of Adjusted Net Yards of Value over average.

ANY/A leaves much to be desired as the end-all, be-all measure of quarterback play, but it’s simple, easy to understand, and works well for historical comparisons. At the end of the year, I will produce an SOS-adjusted version of the statistic, but today, I just wanted to take a quick look at the leaderboard. There are a few surprises, after the very expected result at the top of the list. [continue reading…]

{ 4 comments }

Advanced Football Analytics Podcast: Appearance #4

Yes, I somehow keep getting invited back to talk football on the Advanced Football Analytics (formerly Advanced NFL Stats) podcast.  In this episode, we talk college football playoffs, preview week 15 match-ups, and discuss some of my recent articles.

You can listen here, or subscribe on iTunes, Stitcher, or RSS

{ 0 comments }

Week Fourteen Game Scripts: Comeback Colts Return

Luck had gone 20 consecutive regular season games without a game-winning drive

Luck had gone 20 consecutive regular season games without a game-winning drive

As a rookie in 2012, Andrew Luck led Indianapolis on a league-high seven game-winning drives in the fourth quarter. In 2013, the Colts won games with Game Scripts of -11, -4.6, and -2.8, and Luck recorded four 4th quarter comebacks for the second straight year.

This year? Indianapolis did not have a single victory with a negative Game Script, and Luck did not record a game-winning drive or a 4th quarter comeback, until this past weekend in Cleveland. It’s worth noting that the comeback was in part the result of Luck’s mistakes: the Browns raced out to a 21-7 lead thanks to two Luck turnovers that went for defensive touchdowns. But in the final four minutes, the star quarterback led the Colts on an 11-play, 90-yard drive for the game-winning touchdown.

That was the only big comeback of the week. On the blowout side, the Carolina Panthers — you know, the team that was on a six-game losing streak and had not won a game since October 5th — produced the most dominant performance of the week, finishing with a Game Script of +22.9 in a blowout over New Orleans. The Giants similarly embarrassed the Titans, producing a Game Script of +18.5.

Below are the week 14 Game Scripts data, and three games near the top of the list show the difference between Game Script and points differential.  The Packers had a Game Script of 10.6 but won by only 6 against Atlanta, while St. Louis won by 24 but with a Game Script of only 10.  But the Game Script measures the average points differential throughout the game: Green Bay led Atlanta 31-7 at halftime, while the Rams were up by just six points at the break.  The Broncos led Buffalo 24-3 after three quarters, which led to a Game Script of +9.6, even though Denver wind up winning by only seven points. [continue reading…]

{ 1 comment }

Guest Post: Marginal Drops

Munir Mohamed, a reader of Football Perspective, has agreed to write this guest post for us. And I thank him for it.


Regular readers are familiar with Adam Steele’s threepart series here on Marginal YAC; today, I want to look at drops, and marginal drops.  As Adam noted, Sportingcharts.com keeps track of dropped passes. [1]Some fine print: Unfortunately, that data is only recorded on a team level, not at the individual passer level.  As a result, I gave each quarterback his pro rata portion of his team’s dropped … Continue reading

Her’s how to read the table below, which is sorted by career Marginal Drops.  Over the course of this data set, Eli Manning completed 2,929 of his 5,008 passes, for a completion percentage of 58.5%.  Manning’s Giants dropped an estimated 299.4 of his passes; if we add those to his 2,929 completions, Manning was therefore “On Target” with 64.5% of his throws.  Relative to league average, Manning had 44 more drops than we would expect. Manning’s drop percentage — i.e., his number of drops divided by his total number of completions and drops, was 9.3%, which represents his percentage of catchable balls that were dropped. Manning lost 516.5 yards from his marginal drops, or 52.9 yards last from marginal drops per 300 completions. [continue reading…]

References

References
1 Some fine print: Unfortunately, that data is only recorded on a team level, not at the individual passer level.  As a result, I gave each quarterback his pro rata portion of his team’s dropped passes relative to the percentage of team incompletions for the entire team.

For example, let’s say the Jaguars have 30 dropped passes. Assume QB A for the Jaguars has 200 incompletions, and QB B has 100 incompletions. My methodology handled this by crediting QB A with 20 dropped passes and QB B with 10 drops. The numbers in this article are from 1992-2013. In the table below, “Marginal Drops” represents how many drops above average a quarterback had compared to league average rate. If a passer has positive Marginal Drops, this means he had more drops than expected.

{ 10 comments }

New York Times, Post Week-14 (2014): Under-the-Radar Ravens

I was on vacation last week, but the weekly New York Times posts are back! This week, a look at the Ravens, a team quietly positioning itself as one of the league’s best.

With three weeks remaining in the N.F.L. regular season, the cream is rising to the top.

The Green Bay Packers have scored 369 points over their last 10 games and Aaron Rodgers is the front-runner for most valuable player. The New England Patriots have won eight of their last nine games (with the only loss at Green Bay) and outscored opponents by a league-best 10.3 points a game. The Seattle Seahawks are the defending Super Bowl champions; after an uneven start they are starting to play like it. They have allowed 507 yards over the last three weeks, the fewest in the N.F.L. by any team in a three-game stretch in over three years.

But the Baltimore Ravens are the only team that ranks in the top quarter of the league in both points scored and points allowed. It is hard to imagine a team two years removed from winning the Super Bowl flying under the radar, but that is what is happening in Baltimore, with national coverage of the domestic violence episode involving their former player Ray Rice overshadowing the team’s performance.

You can read the full article here.

{ 6 comments }

NFL Passing, 1950 Through Week 13, 2014

In case you haven’t noticed, 2014 is on pace to become the greatest passing season in NFL history. Which may not be surprising, since just a few months ago, the three best passing seasons in NFL history were the 2012, 2011, and 2013 seasons. Falling into fifth place will be the… 2010 NFL season. So passing numbers are on the rise, but you already knew that.

Through week 13 of the 2014 season, the NFL average Adjusted Net Yards per Attempt — defined as gross passing yards, plus 20 yards for every touchdown pass, minus 45 yards for every interception, and minus sack yards, all divided by the total number of pass attempts plus sacks — was at 6.26.  Most passing statistically typically take a trip south in December (and prior to SNF, the week 14 average was 5.85), but 6.26 would be a significant outlier even in our high-flying times. The graph below shows the NFL average ANY/A for each season since 1950.  Of course, we are doing a bit of apples-to-oranges comparisons by using full season numbers for all years and through-13-weeks numbers for 2014, but so be it: [continue reading…]

{ 11 comments }

The college football regular season is over. Florida State ends the year as the only unbeaten team, even if the defining characteristic of the Noles’ season was their inability to ever earn any style points. FSU ends the regular season a mind-boggling 3-10 against the spread, which is all you need to know about how the team played relative to expectations on a weekly basis.

Most agree that Alabama and Oregon are the top two teams in the country; the SRS agrees with the consensus! The Crimson Tide have emerged with an SRS rating of 62.0, with the Ducks narrowly behind at 61.5.  The Seminoles are down at 15 in the SRS, which is unsurprising to regular readers.  The SRS is a predictive system, like Las Vegas; this implies that Florida State would be an underdog to all the top teams, which is hard to argue against.

Of course, FSU will take one of the four golden tickets, as will Alabama and Oregon.  The fourth spot in the first ever college football playoff will come down to TCU, Ohio State, or Baylor.  The SRS is not necessarily a great way to decide which team should advance — after all, that should be based more on resume than on best team — but it can be instructive to look at the ratings.  In this case, those three teams check in at #3, #5, and #6.

As always thanks to Dr. Peter R. Wolfe for providing the weekly game logs. Some more playoff thoughts about the jump:

[continue reading…]

{ 4 comments }

The Baylor/TCU Question

Today, TCU will finally play Iowa State, the worst team in the Big 12, and Baylor will finally play Kansas State, the best team in the Big 12 after Baylor and TCU. At that point, both the Horned Frogs and Bears will have faced each other and nine common opponents. [1]In addition to the remaining 8 teams in the Big 12, both TCU and Baylor beat SMU in nonconference play. The chart below shows how each team fared against those ten common opponents, treating Baylor/TCU as one team.

On the X-Axis is each opponent, in (roughly) descending order from left to right in terms of strength. For both Baylor and TCU, the other team was its toughest opponent, while Iowa State and SMU were the two easiest opponents both teams faced. On the Y-Axis is the home field adjusted margin of victory. Of note: TCU lost by 3 to Baylor, but the game was played in Waco, so both teams get a 0 for that game. TCU is represented by the purple dot below, with Baylor’s results displayed in green:

baylor tcu [continue reading…]

References

References
1 In addition to the remaining 8 teams in the Big 12, both TCU and Baylor beat SMU in nonconference play.
{ 6 comments }

Quarterback Musical Chairs

Not every team is so lucky.

Not every team is so lucky.

There are 13 teams with very clear quarterback situations for the near future. By that I mean, barring unforeseeable injury, you can say with 95% confidence who the team’s week 1, 2015 starting quarterback will be. Those teams are, in no particular order: Green Bay (Aaron Rodgers), Indianapolis (Andrew Luck), Carolina (Cam Newton), Baltimore (Joe Flacco), New Orleans (Drew Brees), Atlanta (Matt Ryan), Detroit (Matthew Stafford), Kansas City (Alex Smith), Pittsburgh (Ben Roethlisberger), Jacksonville (Blake Bortles), San Diego (Philip Rivers), Seattle (Russell Wilson), and New England (Tom Brady).

We can get to an even half the league by adding San Francisco (Colin Kaepernick), Miami (Ryan Tannehill), and the New York Giants (Eli Manning), but I think each of those situations are slightly cloudier due to potential uncertainties higher up in the organization. Will Jim Harbaugh still be coaching the 49ers in 2015, and if not, what does that mean for Kaepernick? If the Dolphins miss the playoffs for the sixth straight year, would that mark the end of the Joe Philbin — and Tannehill — eras in South Beach? Manning is actually entering the last year of his contract in 2015, and comes with a cap hit of $19.75M and dead money of just $2.25M if he’s cut or traded. He’s not worth $20M per year, and if Tom Coughlin is gone, will a new coach want to go in a new direction?

Still, the smart money is on those three wearing the same uniforms in 2015; more importantly for our musical chairs purposes, all three will be starting quarterbacks somewhere next year. Peyton Manning could retire if the Broncos win the Super Bowl, but odds are he brings our list up to 17 quarterback situations we can clearly identify for week 1 of the 2015 season. We can get to an even 20 by including Cincinnati (it’s unlikely Andy Dalton isn’t the starter this time next year), Dallas (Tony Romo will be the guy if healthy, but his back troubles moves him out of the group 1 list), and Minnesota (no, Teddy Bridgewater has not been great, but he’s been capable enough as a 22-year-old rookie to be given the job at the start of the 2015 season).

[continue reading…]

{ 9 comments }

Over the prior two weeks, we were short on comebacks. Things took a big turn towards exciting in week 13:

  • The Bengals trailed the Bucs 3-0 for most of the first quarter, and then 10-0 for the majority of the second. Cincinnati would ultimately take the lead by the end of the third quarter, but the Bengals still finished with a -3.0 Game Script.
  • On Monday Night Football, the Jets also jumped out to a 10-0 first-half lead before ultimately falling to Miami, 16-13. But more to come on this game later in the post.
  • Another team that fell behind 10-0 early was San Diego. In fact, the Chargers didn’t take their first lead against the Ravens until the final minute, winning 34-33 despite posting a Game Script of -5.9.
  • But the biggest “comeback” of the week was in Jacksonville, where the Jaguars ruined Tom Coughlin’s homecoming. New York stormed out to a 21-0 lead, but imploded in the second half, allowing Jacksonville to steal the win, 25-24. Jacksonville won with a Game Script of -6.8, the fourth largest of the year and the worst Game Script by a victor since the Lions 21-point comeback in London against the Falcons.

Below are the Game Scripts data for each game in week 13: [continue reading…]

{ 9 comments }
Previous Posts